Crypto's Tectonic Plates
Forming Crypto's Foundation: The ChainPulse Report

There are very subtle pieces in crypto that are moving like tectonic plates.
While we go about our day to day lives the movement is unnoticed. Yet, this shifts are creating the mountains and valleys that will pepper the landscape of crypto for the years to come.
And for anybody looking to set up shop or make long term investments in the space, it is essential you pay attention.
If you choose to ignore them, you might find yourself next to a volcano in time.
A few of the tectonic plates I’m referencing here are government regulation, lobbyists, and central bank digital currencies (CBDC).
These three topics will collide at some point in the near future. When they do, the seismic activity will be felt in the markets.
It’s an event many in the industry wish took place during Crypto Winter of late 2018 when crypto never made headline news.
Fortunately or perhaps unfortunately, there are a few events in the pipeline that’ll likely create dry land for crypto to build upon or create a bubbling hot ring of volcanoes and with it unnecessary caution in the years ahead.
Frankly, if the result of these three entities meeting is positive, then the mythological supercycle event for bitcoin becomes possible. If it’s negative, then the blow could put the industry in a six month recovery scenario.
So let’s dive into it. But first…
If this is your first Weekly ChainPulse Report, our team at Jarvis Labs want to welcome you. In this piece we go over what the market looks like from the perspective of global macro markets, from a 10,000 ft view of bitcoin and crypto markets, and a granular view that helps you navigate the week ahead.
Consider it your roadmap for trading bitcoin and crypto.
Moving forward we publish this issue every Wednesday, and then publish short updates on this piece before the weekend on Friday and then during the start of the trading week - Monday. This way you know if we’re taking a detour.
OK, about those tectonic plates…
Government regulation is preparing to heat up in June of this year. One event to mark your calendar for is the end of the 12-month review of the Financial Task Force (FATF) standards on virtual assets and service providers. It’s set to come to an end in June.
What is it?
Peter Van Valkenburgh from the lobbying group CoinCenter voiced his thoughts on the matter in a twitter thread:
There's new FATF draft guidance for crypto, and its not good.
— Peter Van Valkenburgh (@valkenburgh) 6:25 PM ∙ Mar 22, 2021
One of the main critiques is on VASPs, which would target a DEX like Uniswap, and force them to implement some know your customer policies.
More importantly DeFi would suddenly become a hot bed of regulatory issues overnight if FATF’s recommendations were adopted in countries around the globe.
With so much money being made in this area of crypto there is bound to be some push back.
Additionally, this coincides pretty well with the timeline we saw for the United States CBDC. It’s expected in July that the Federal Reserve Bank of Boston and Massachusetts Institute of Technology will unveil their research and plans for the digital dollar.
This will be the first major push for a CBDC in the U.S.
In preparation for regulatory hurdles like FATF and maybe others that coincide with the the Fed’s CBDC roll out, Wall Street is beginning to circle its wagon to defend the network.
Just this week Fidelity, Square, Coinbase, Paradigm announced the formation of another lobbying group called the Crypto Council for Innovation. This is a group created to protect the billions of dollars these organizations stand to lose if regulation crushes their bottom line.
Government regulations, lobbying groups, and CBDC discussions will ramp up more than we’ve ever seen in the coming months. Make no mistake about this. These are massive moments that will shape the landscape for the next ten years.
We look to keep track of these events in the coming months.
Let’s hope innovation wins.
Macro
In this section we tend to hit on topics such as the FED policy, global monetary policy, DXY (US dollar index), gold, and bonds. We do this to understand what might effect bitcoin in the coming weeks.
The regulatory situation is really taking the headlines across the board today as DXY and yields aren’t threatening.
What caught my eye was the SEC vs Ripple court case. This is a major lawsuit where the U.S. government is trying to bury Ripple Labs.
Whether it’s right, wrong, justified or not is really not relevant here. Instead, what’s relevant is Ripple Labs got the judge to agree to one of their requests.
The SEC now needs to hand over internal discussions relating to BTC and ETH. We’re about to see internal office memos go public.
The reason is Ripple Labs wants to better understand what separates BTC and ETH from XRP. The idea here is to eventually form an argument for how XRP is similar.
Remember, BTC and ETH were said not to be securities while XRP was deemed a security. Further, the SEC filed dozens of lawsuits declaring various tokens as securities, and won. So this might set some precedent.
Also, traders, investors, innovators and others will soon get clearer guidance on what a security token is.
More importantly, if we see any double talk in these memos I wager we’ll see some bullish price action in crypto as a whole. That’s because crypto is over scrutinized and held to a different set of standards than other assets.
Even Hester Pierce has said this when discussing why bitcoin does not have an ETF yet.
I personally look forward to reading anything that makes the SEC look like school yard bullies here.
For now, I don’t know when the SEC needs to hand over documents. I imagine in a month or so. But that doesn’t mean we won’t see leaks or new information emerge beforehand.
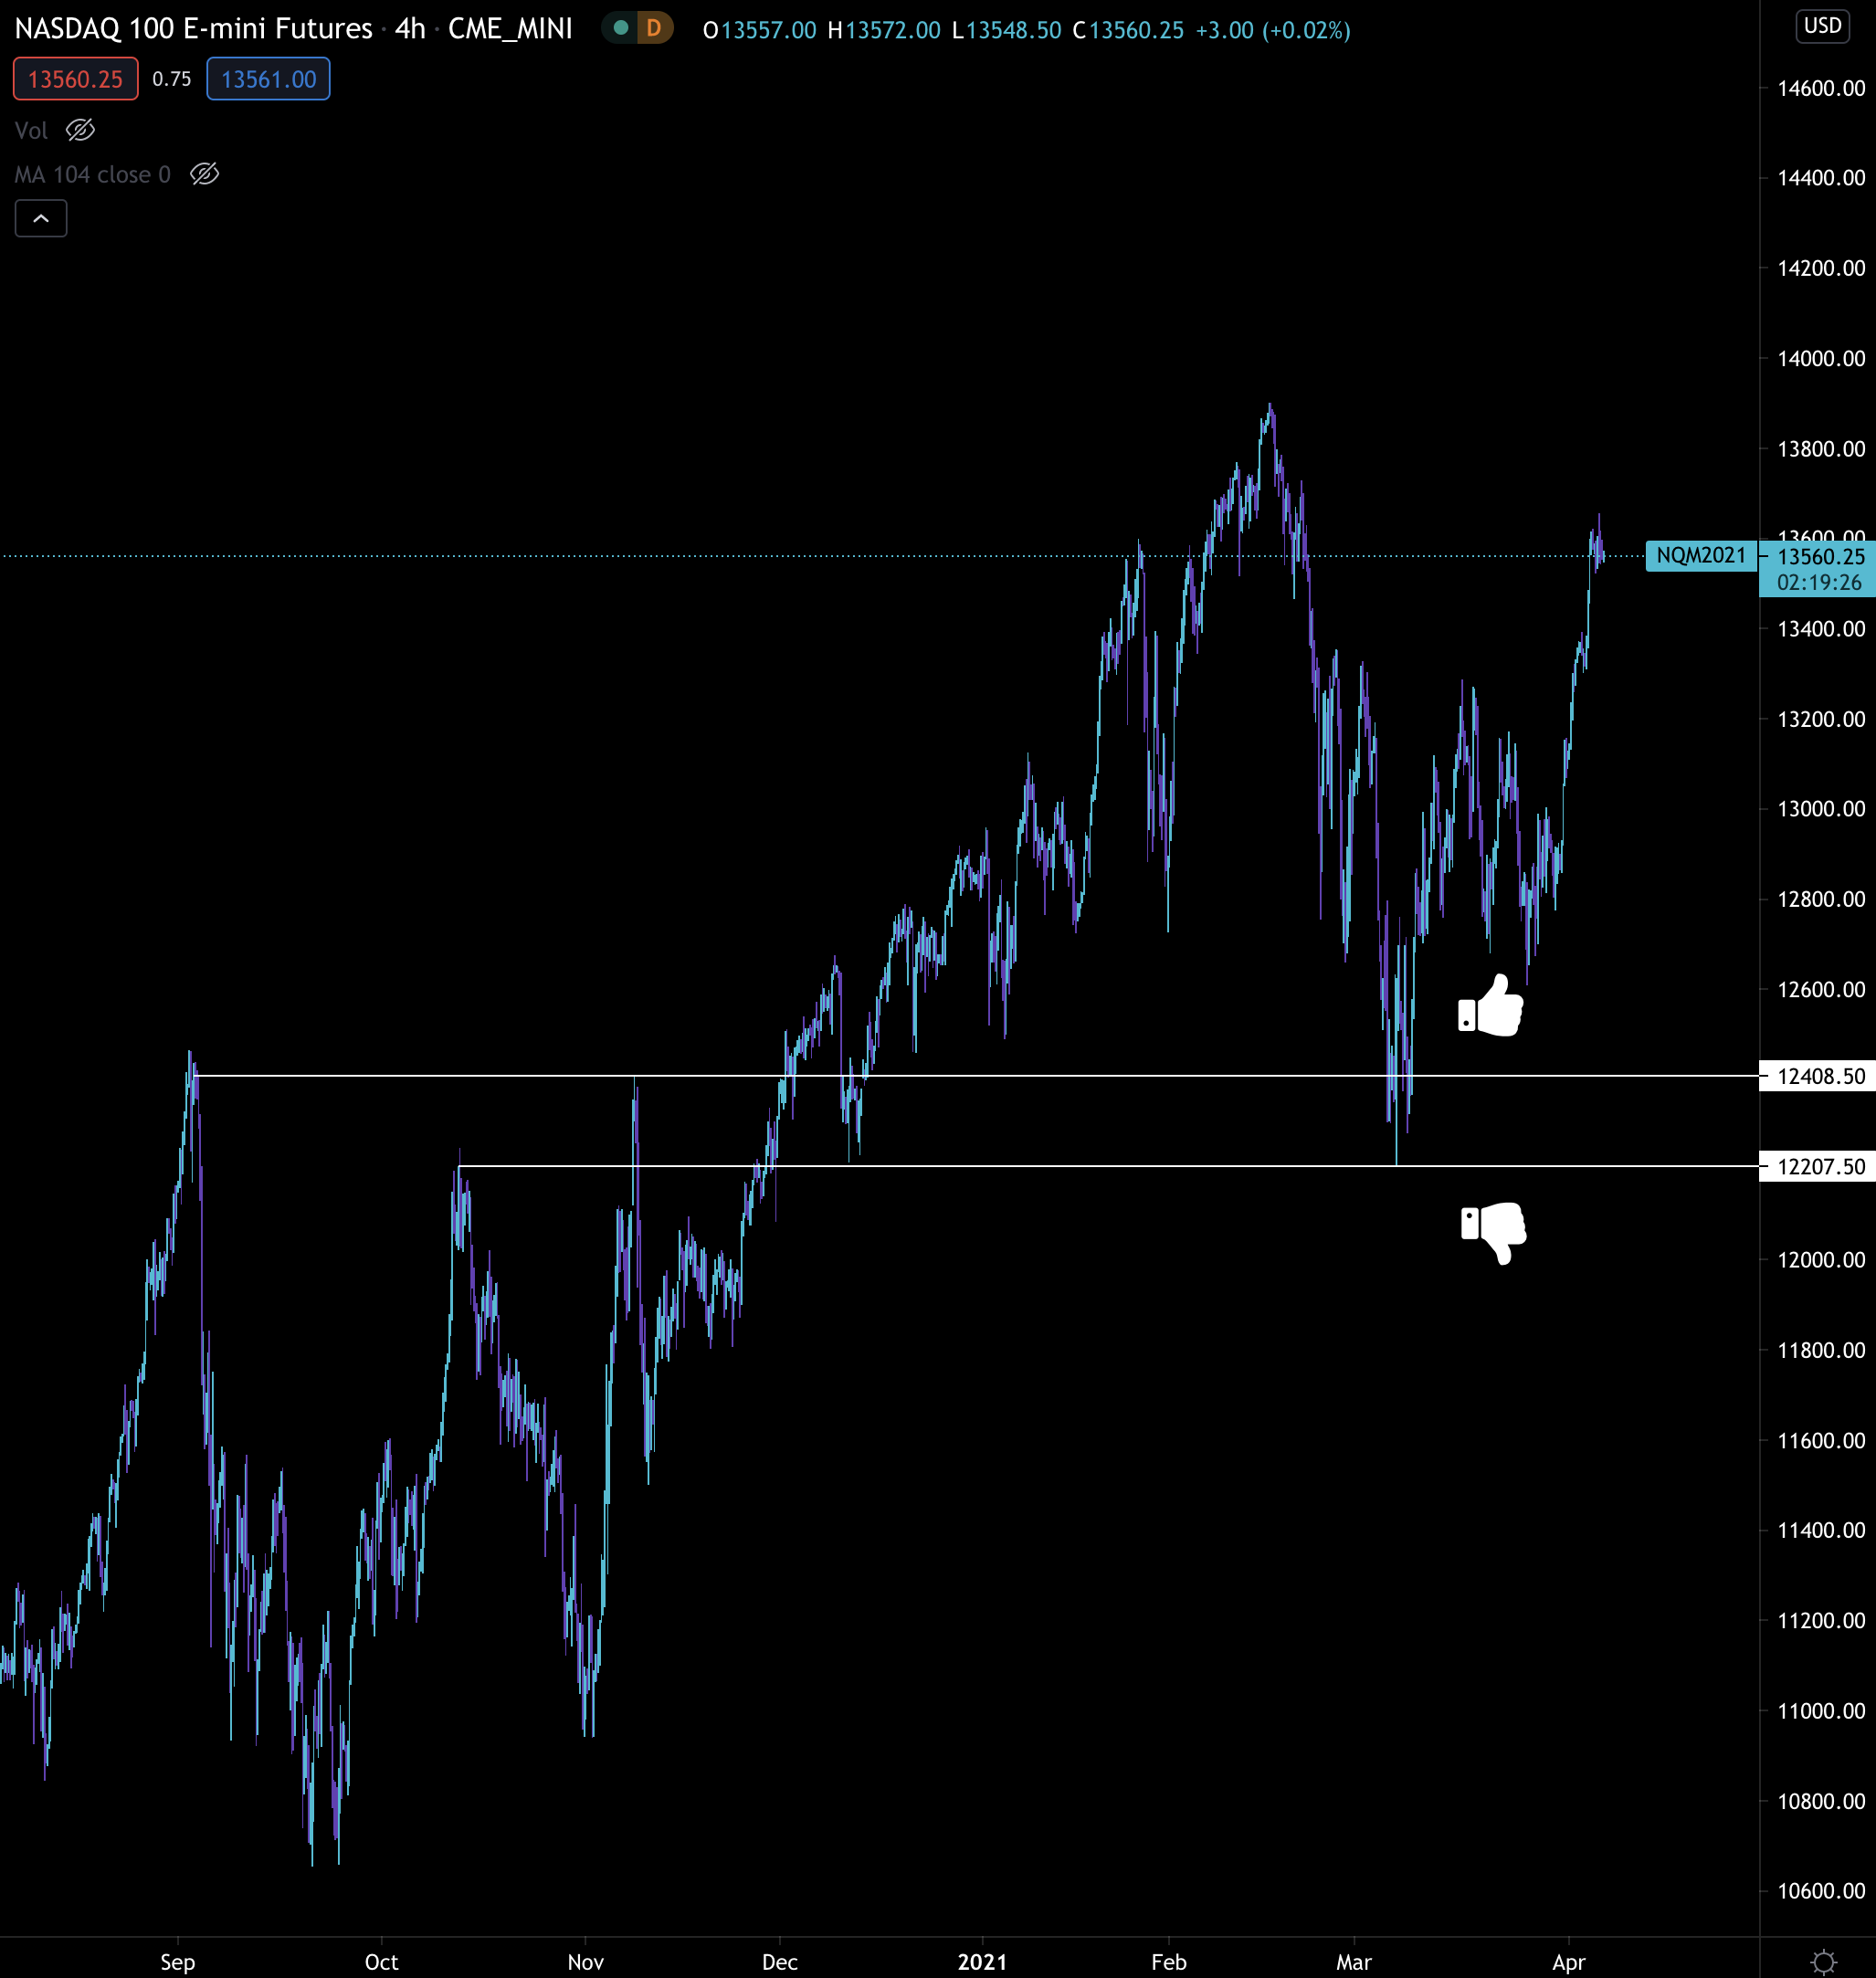
Outside of regulatory concerns, I have my eye on the NDX (Nasdaq 100) chart. this is an index that trades like a growth stock and can have correlations to bitcoin from time to time.
Right now it’s near the top of its trading range. If we get a strong sell off here then expect a bit of spill over into BTC later in the week.
The lower white horizontal lines are reference points in case a selloff gains momentum. Anything below this area could create some trouble… But again, we’re not near this area so no need to dive into it today. We have a ton more to cover…
Macro On-Chain Beat
This is the 10,000 ft view on what bitcoin and crypto look. We look to hone in on questions that ask, is the market overheated… is now a time to hedge… where do we stand in comparison to previous cycles.
And to address these questions we’ve been arming ourselves with a toolbox of indicators, metrics and charts to lean on when things start to get euphoric. That’s because when you truly believe this time is different, and price only goes up… These charts will help bring you back to reality.
This is why we lay these out like an overview. We will occasionally add or subtract things when appropriate. Let’s see what our toolkit is telling us…
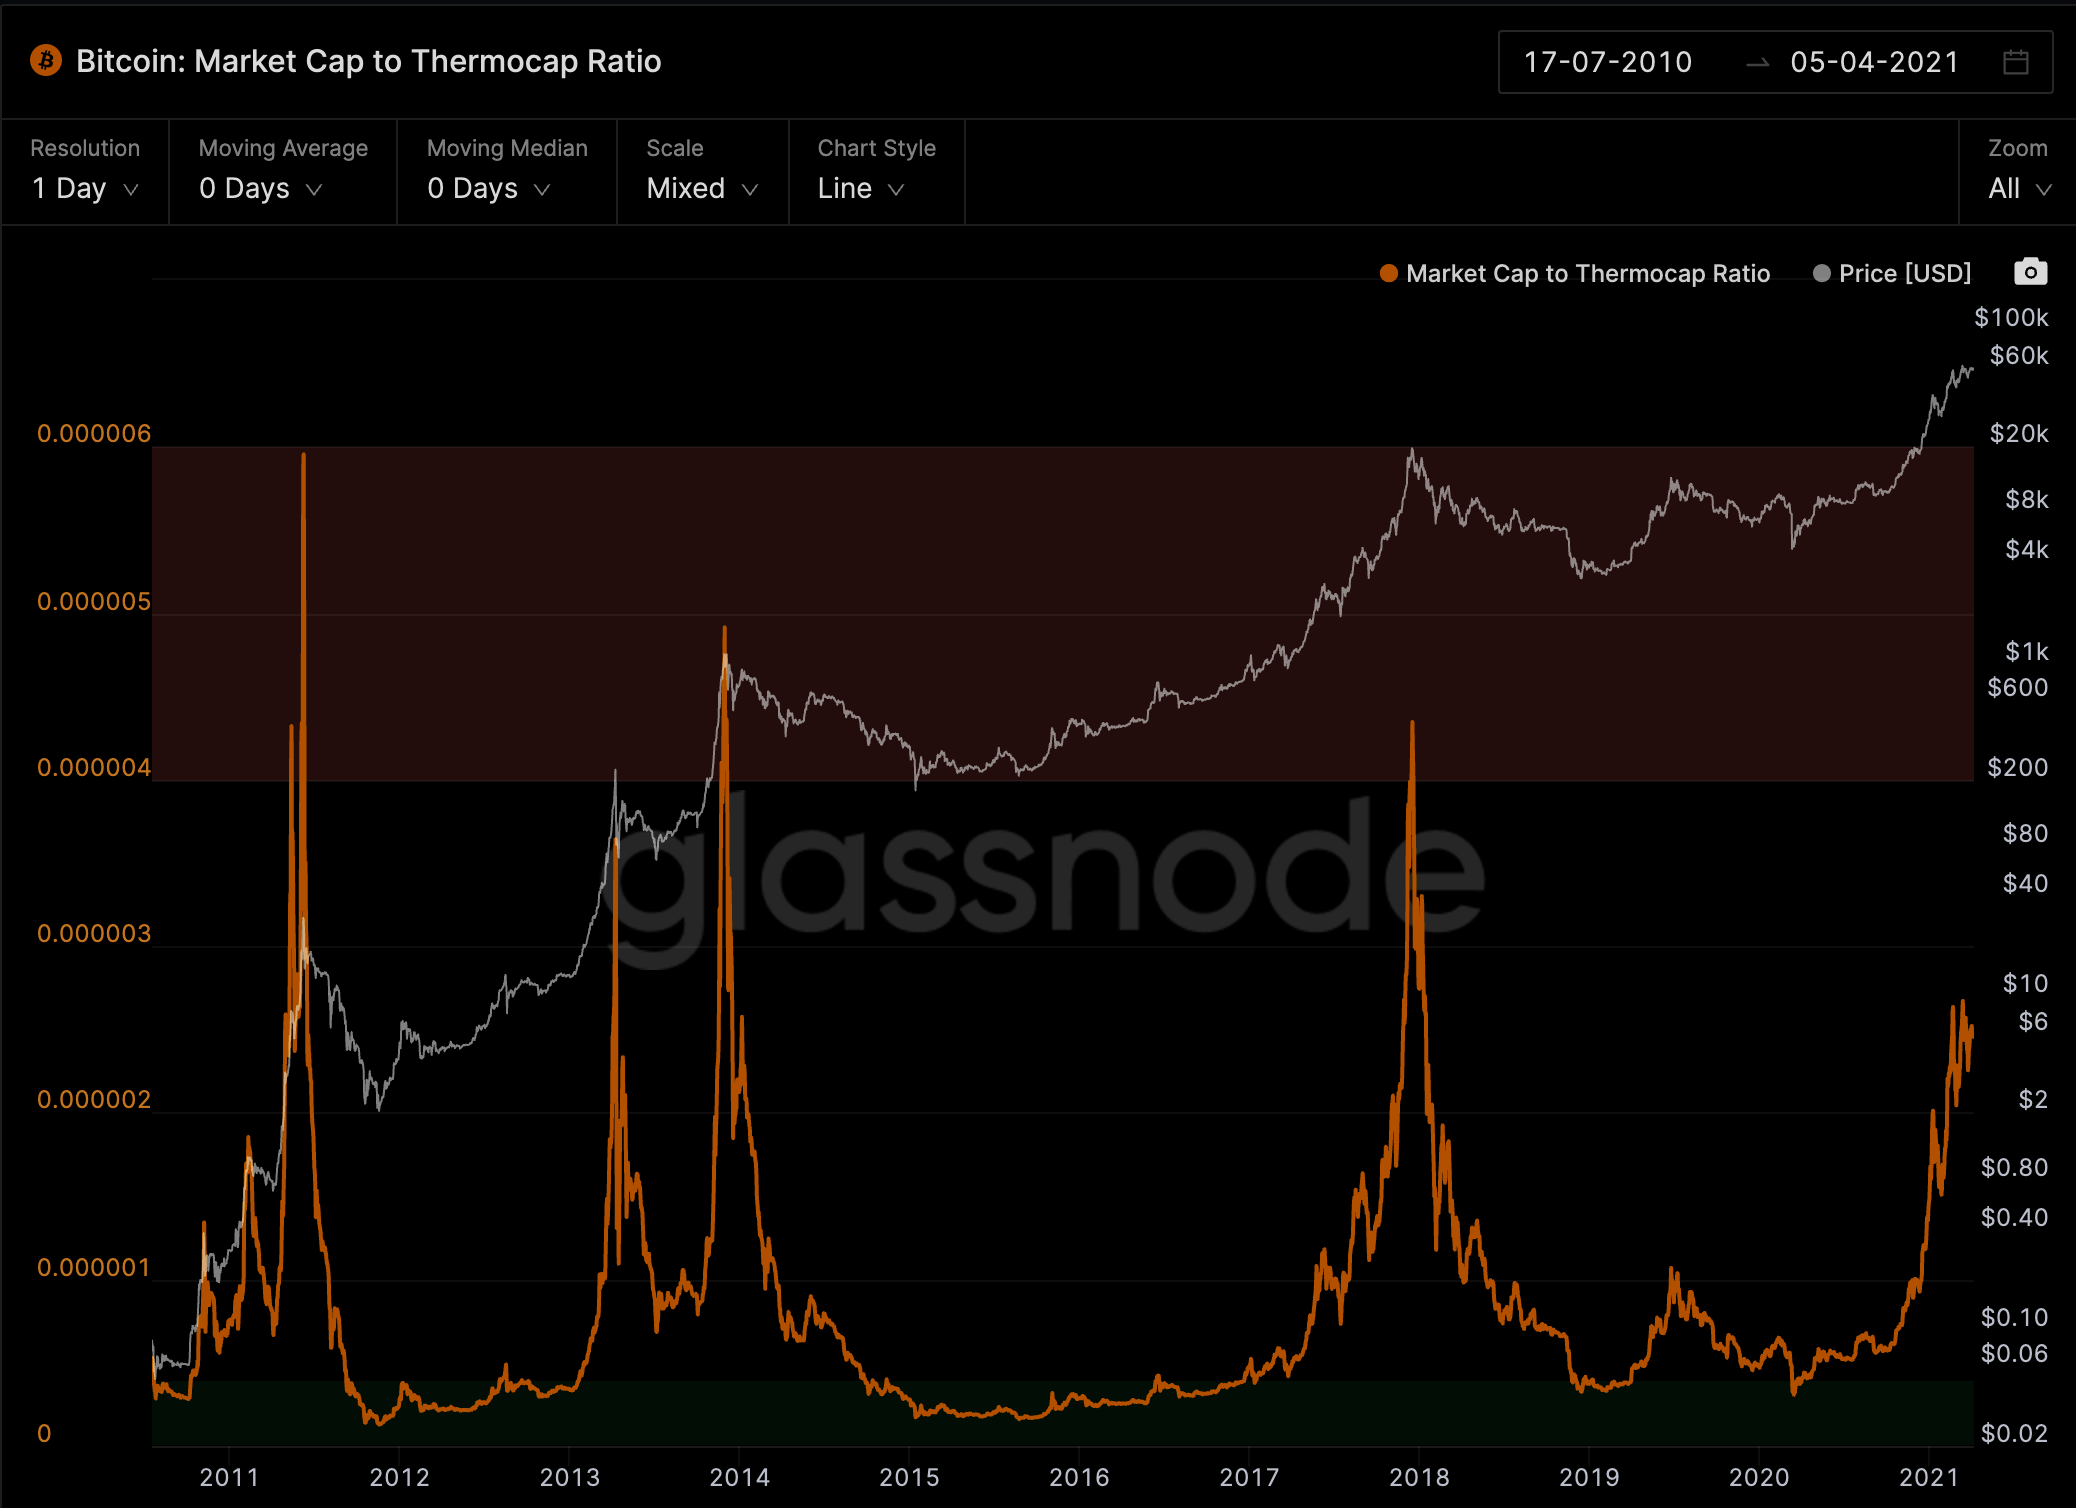
Market Cap to Thermocap Ratio - Rising, but not nearing the oversold area. This tells us the market is paying a fair price for the security bitcoin provides.
It’s important to note there’s a likelihood this metric does not enter the red zone this time around. What we really want to watch out for here are fast spikes. That’d be enough of a signal for us to take note.
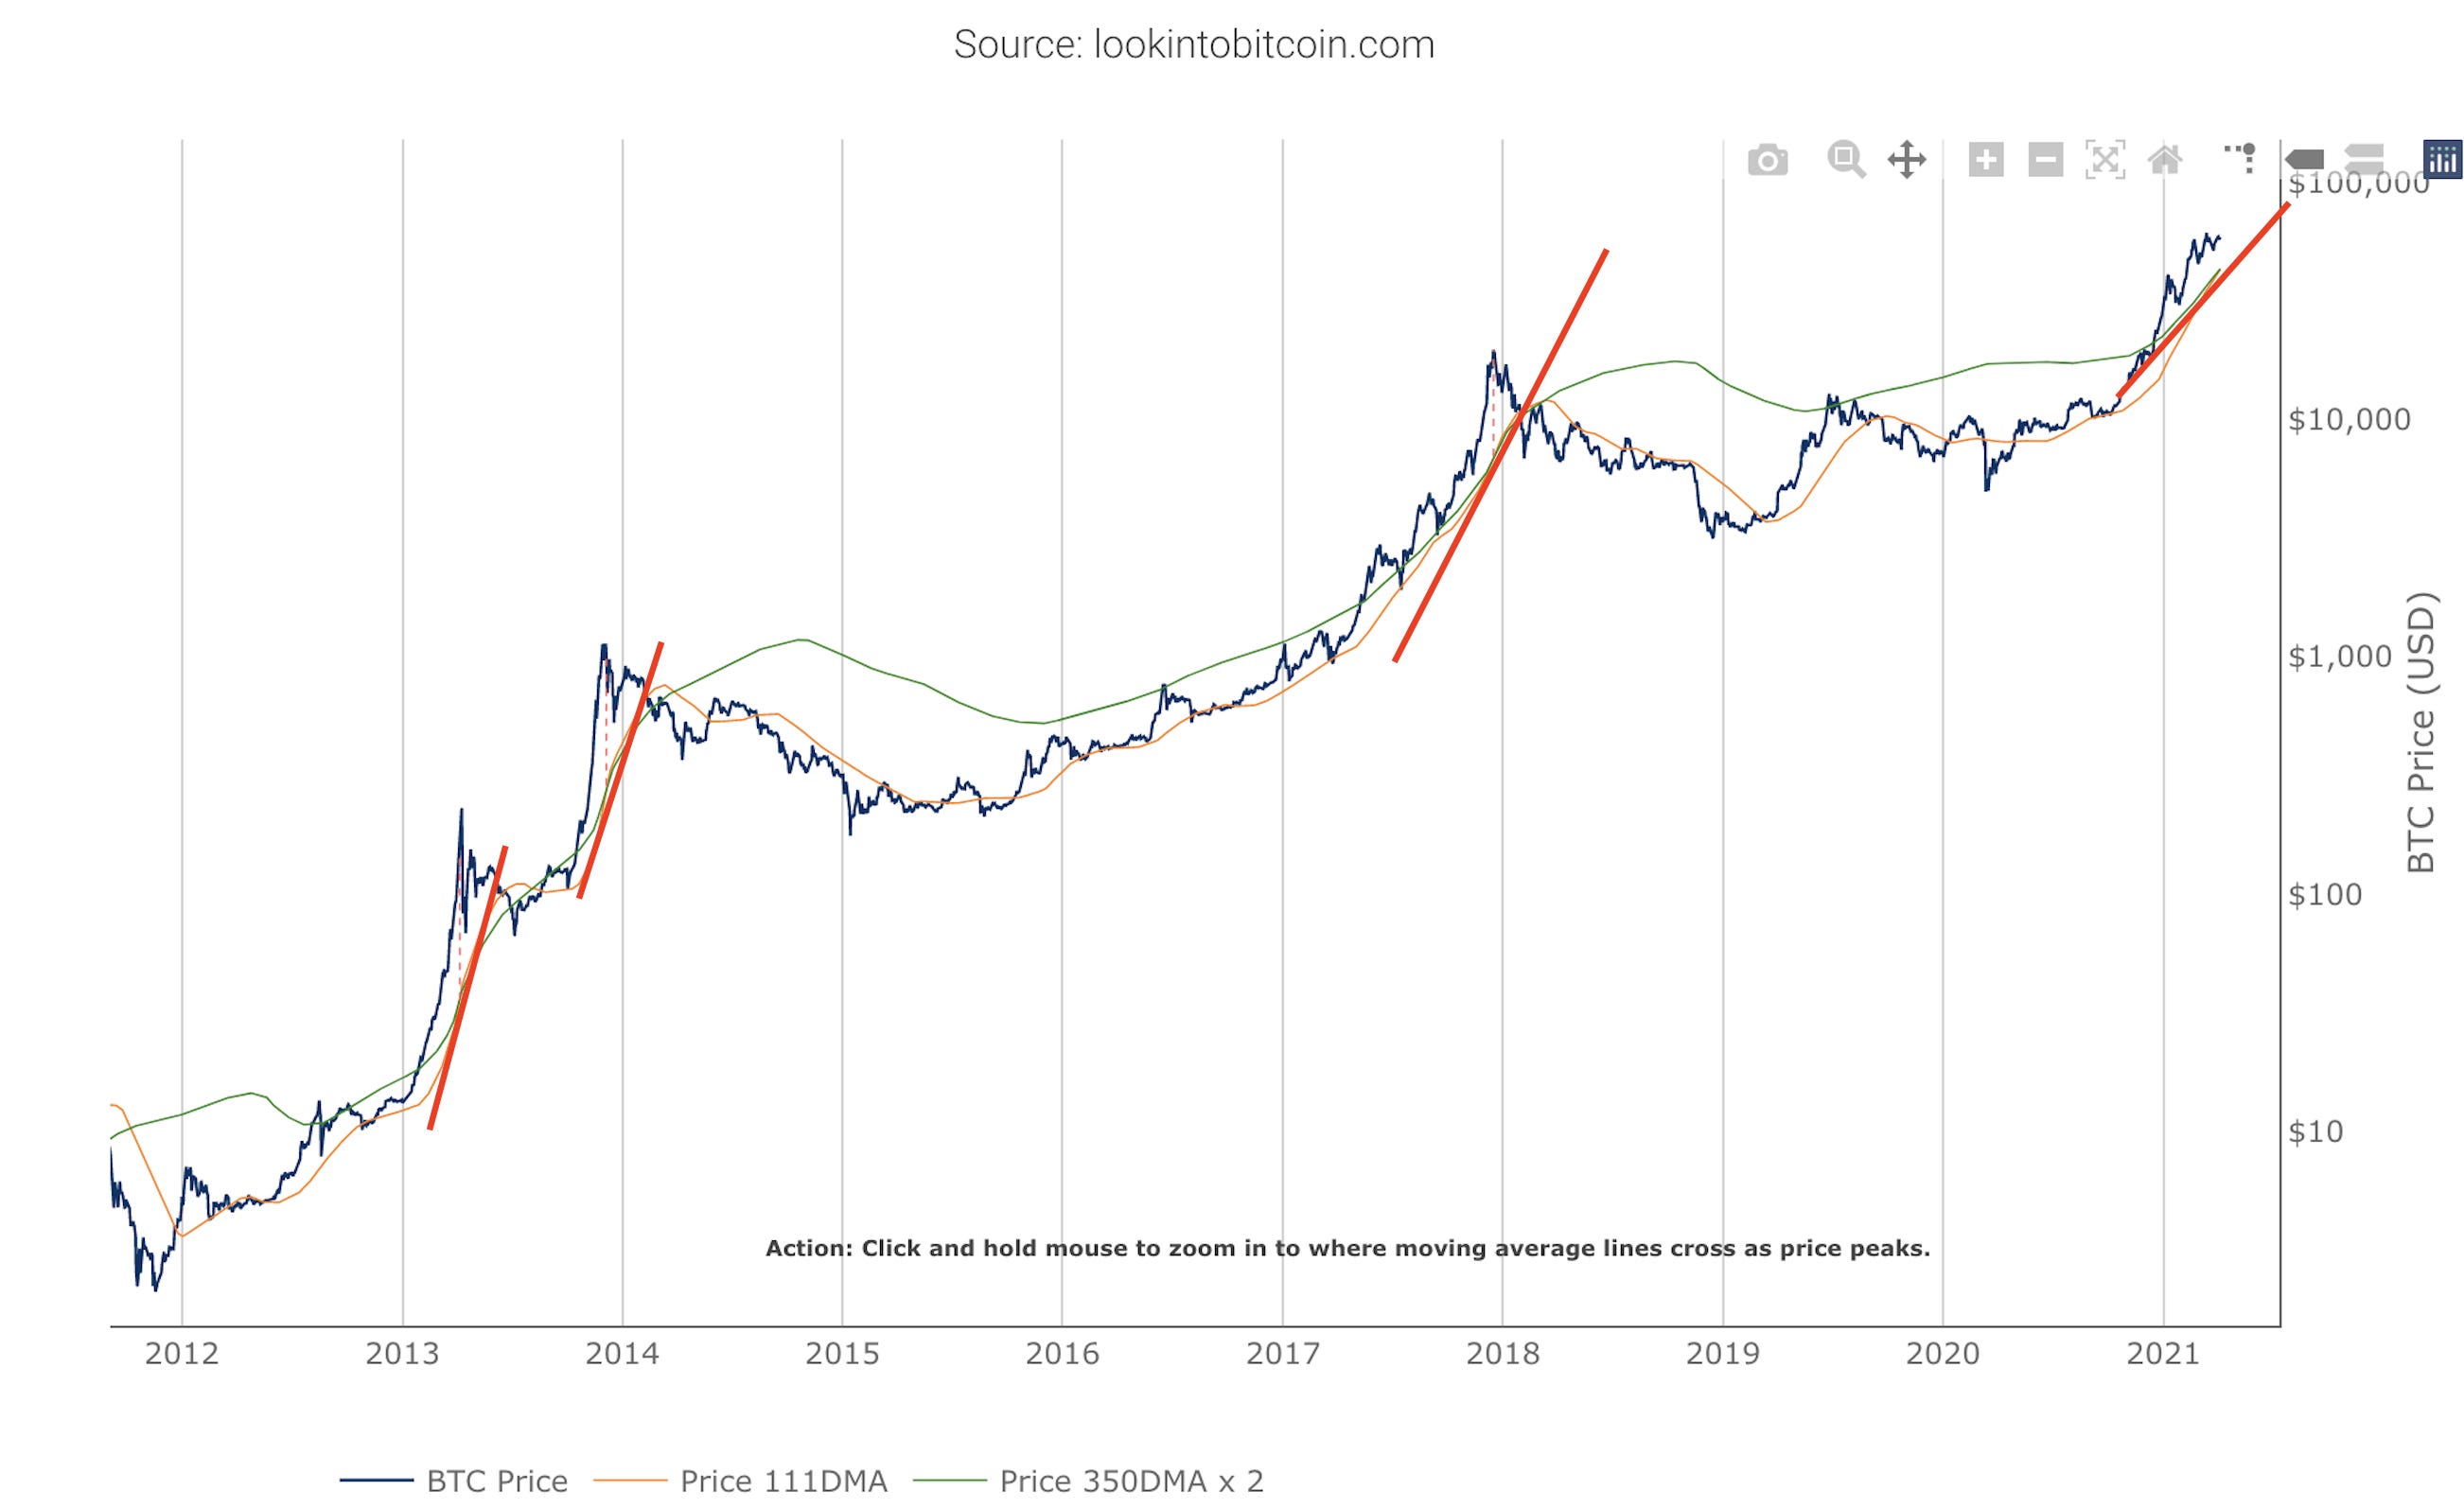
- The Pi Cycle Indicator - The two moving averages are less than $200 from one another. While they have not crossed yet, it’s likely to occur in the coming week. When these two moving averages cross it’s historically within days of a top.
This indicator is suggesting a top is near.
I’m leaning towards this indicator being a false positive at the moment. This is mostly due to the slope of the green line in the chart below, which is the 350dMA (multiplied by two). The slope is shown using red lines in my trusty paint tool, and its steepness is nowhere near the previous instances of these moving averages crossing.
- Mayer Multiple - We wrote this indicator off in last week’s issue, “Your Friend Just Called”. We will be removing this from our toolkit for now, perhaps we add it in at a later date.
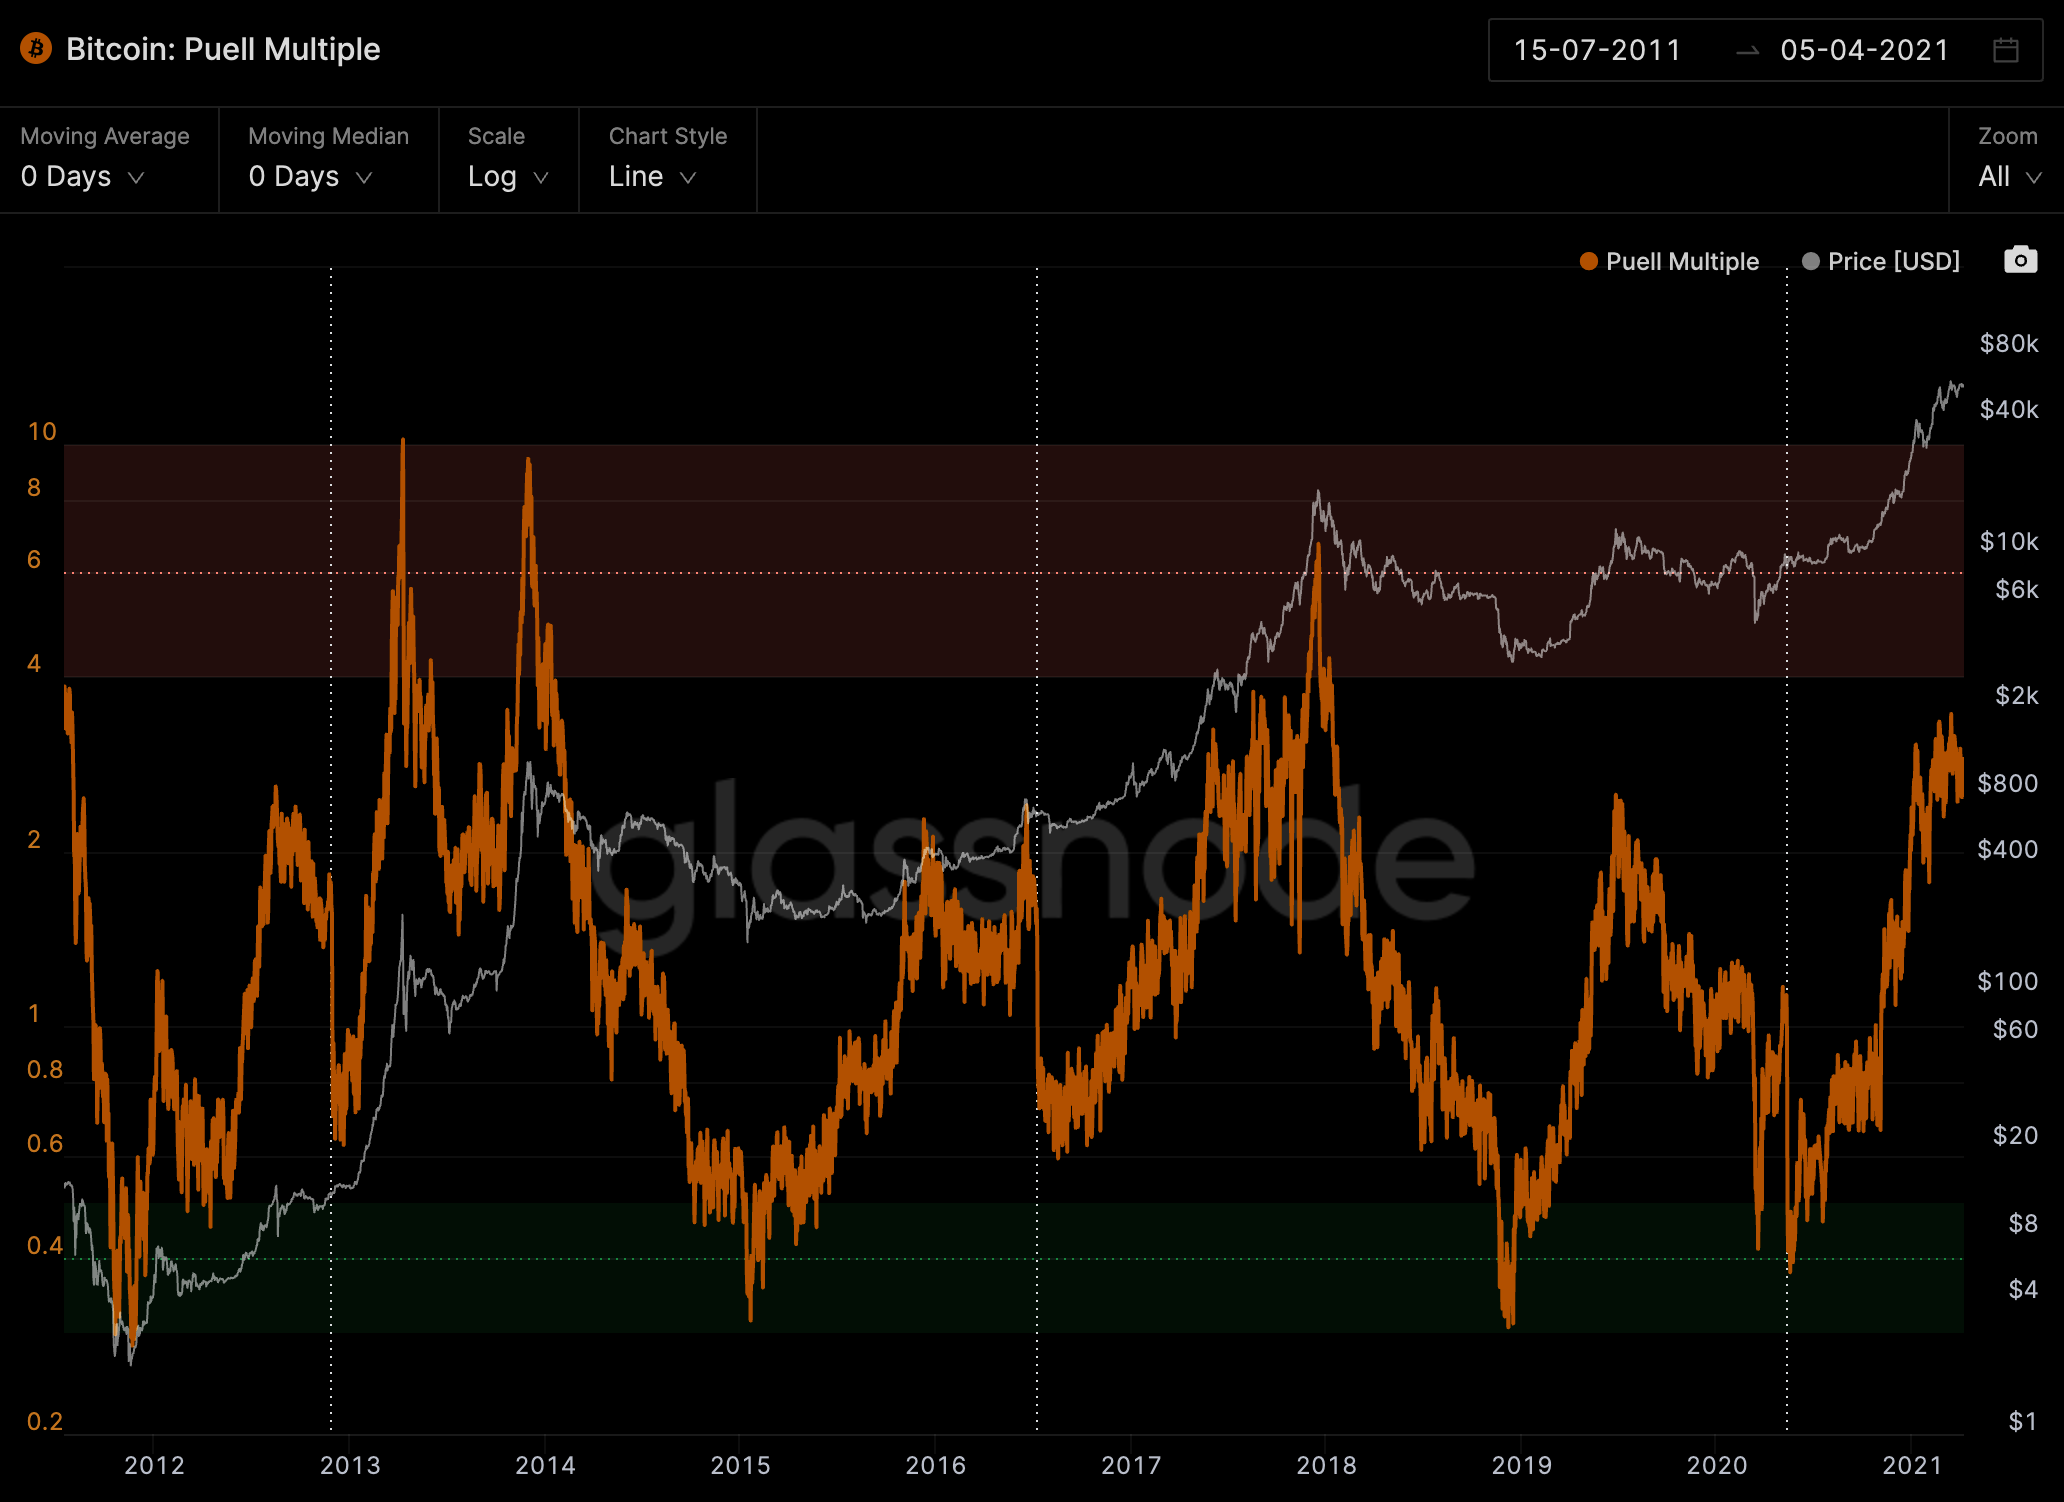
- Puell Multiple - This is our melt up indicator. When it’s in the red overbought zone we can be prepared for the last parabolic push. It’s neutral for now, but getting near. Similar to the Market Cap to Thermocap Ratio we really want to see a strong spike before making any sudden moves.
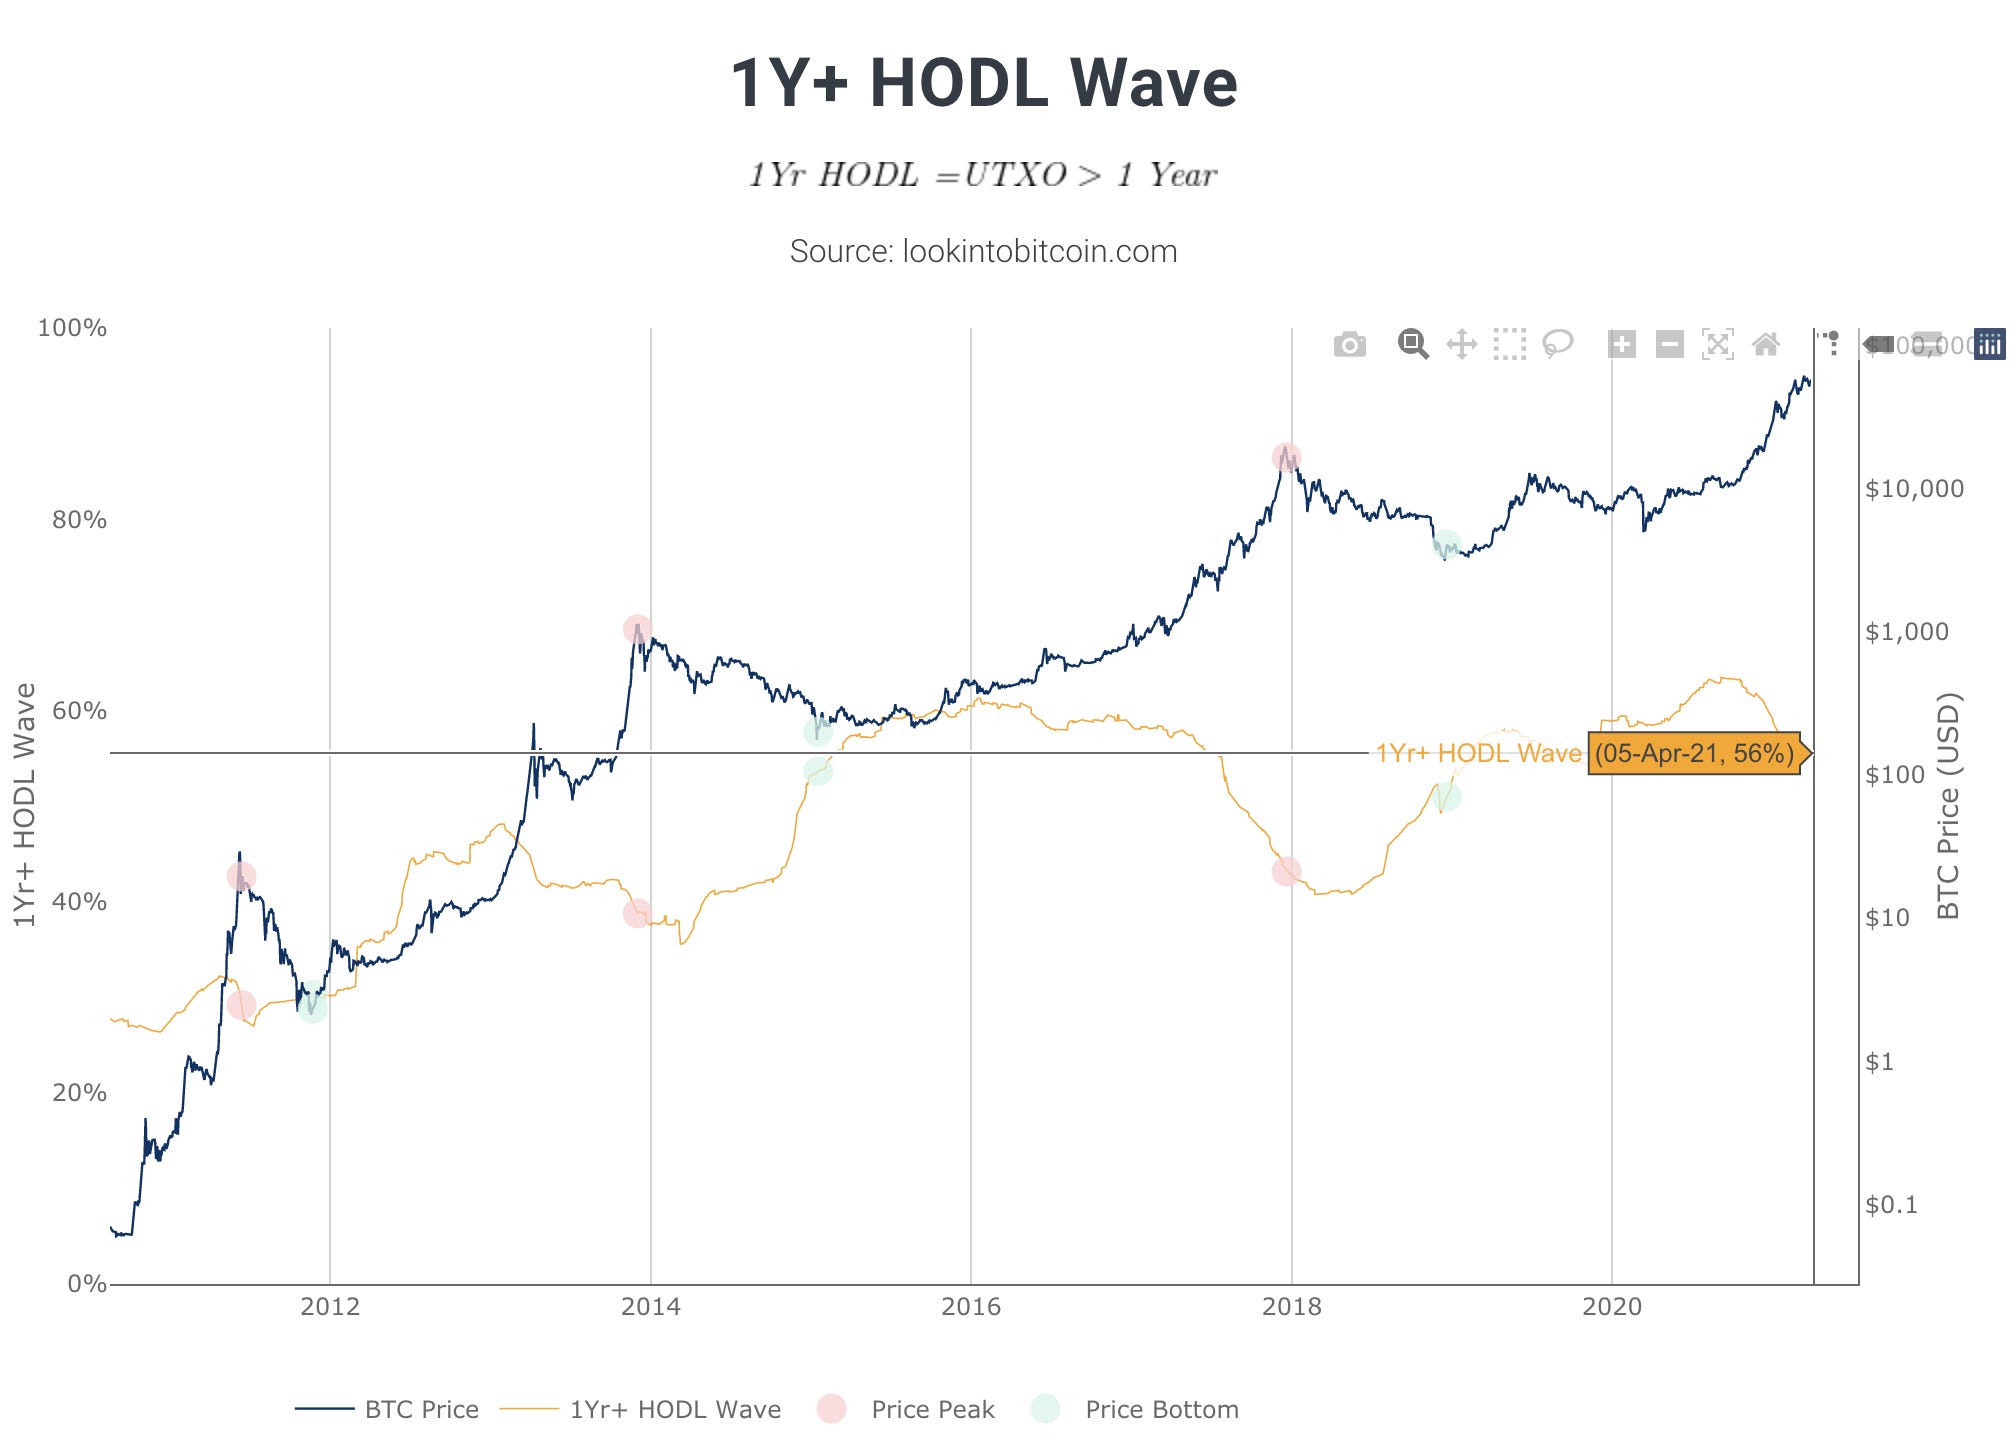
- 1 Year+ HODL Wave Chart - The amount of supply being HODLed for one year or greater still stands at 56%. This remains unchanged from last week.
- Once we dive below 50% then we’ll start taking note as it’ll indicate HODLers believe the price won’t rise any further. You can view the chart below.
The on-chain beat is not flashing any warning signs yet. We can lower our guard in thinking this is a top for the time being and hone in on a more granular look into the market.
ChainPulse
This is the bread and butter of Jarvis Labs. Our specialty is in the day to day. What’s the current structure right now, what does it mean for price, and when is a good time to enter the market. We built our proprietary trading software Jarvis AI with these questions in mind. We lean on it to find the pulse of the market.
The main behavior we see is based upon funding rates.
If price shows any strength traders in the futures market are apeing into positions with reckless abandon. It is like everybody believes price can literally go in one direction.
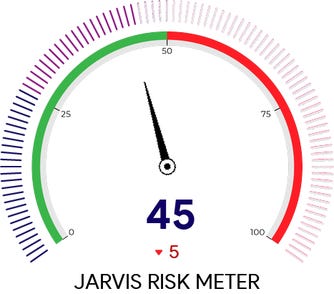
Here’s our hybrid risk meter we use. It’s a blend of on-chain metrics and funding rates. We feel it gives a more wholistic representation of the behavior of traders.
Whenever there’s strong price action to the upside we see the risk meter (pink line) spike. The teal line is price.
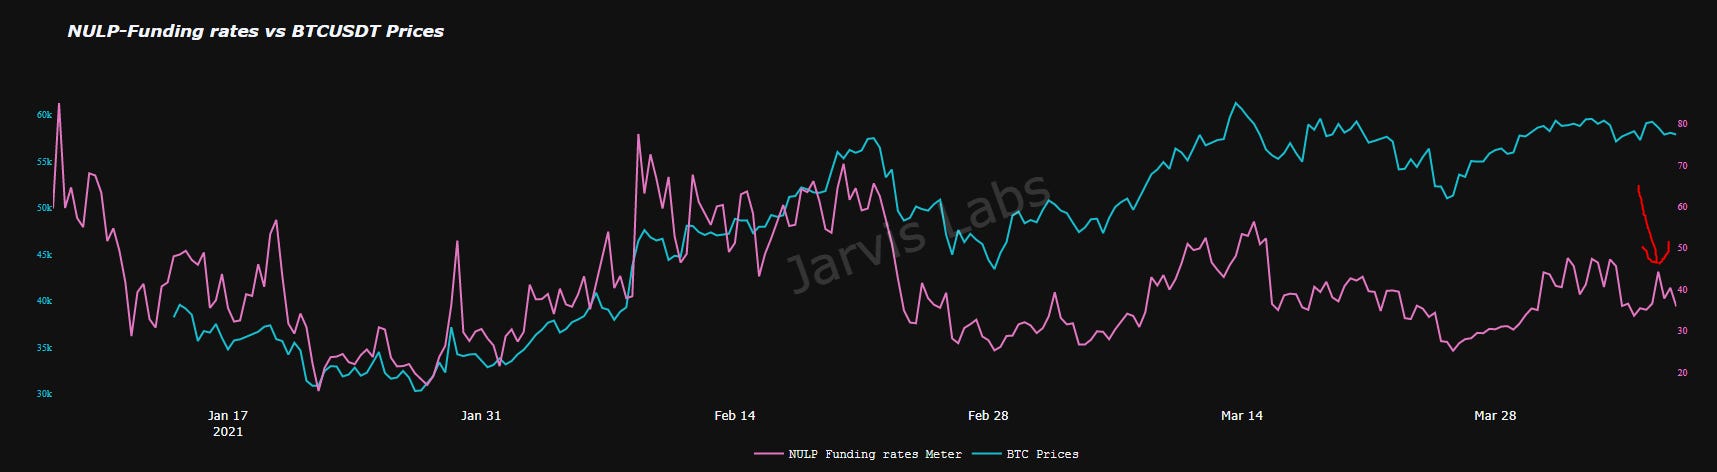
When behavior gets like this price tends to do the opposite. We saw that unfold yesterday.
From our in-house discussions we believe the market will grind out some of this FOMO / ape like behavior. We already saw strong price action on the heels of a massive options expiration date and a Grayscale unlocking event. (If you’re new and don’t know what the Grayscale Effect is, please read here for details.)
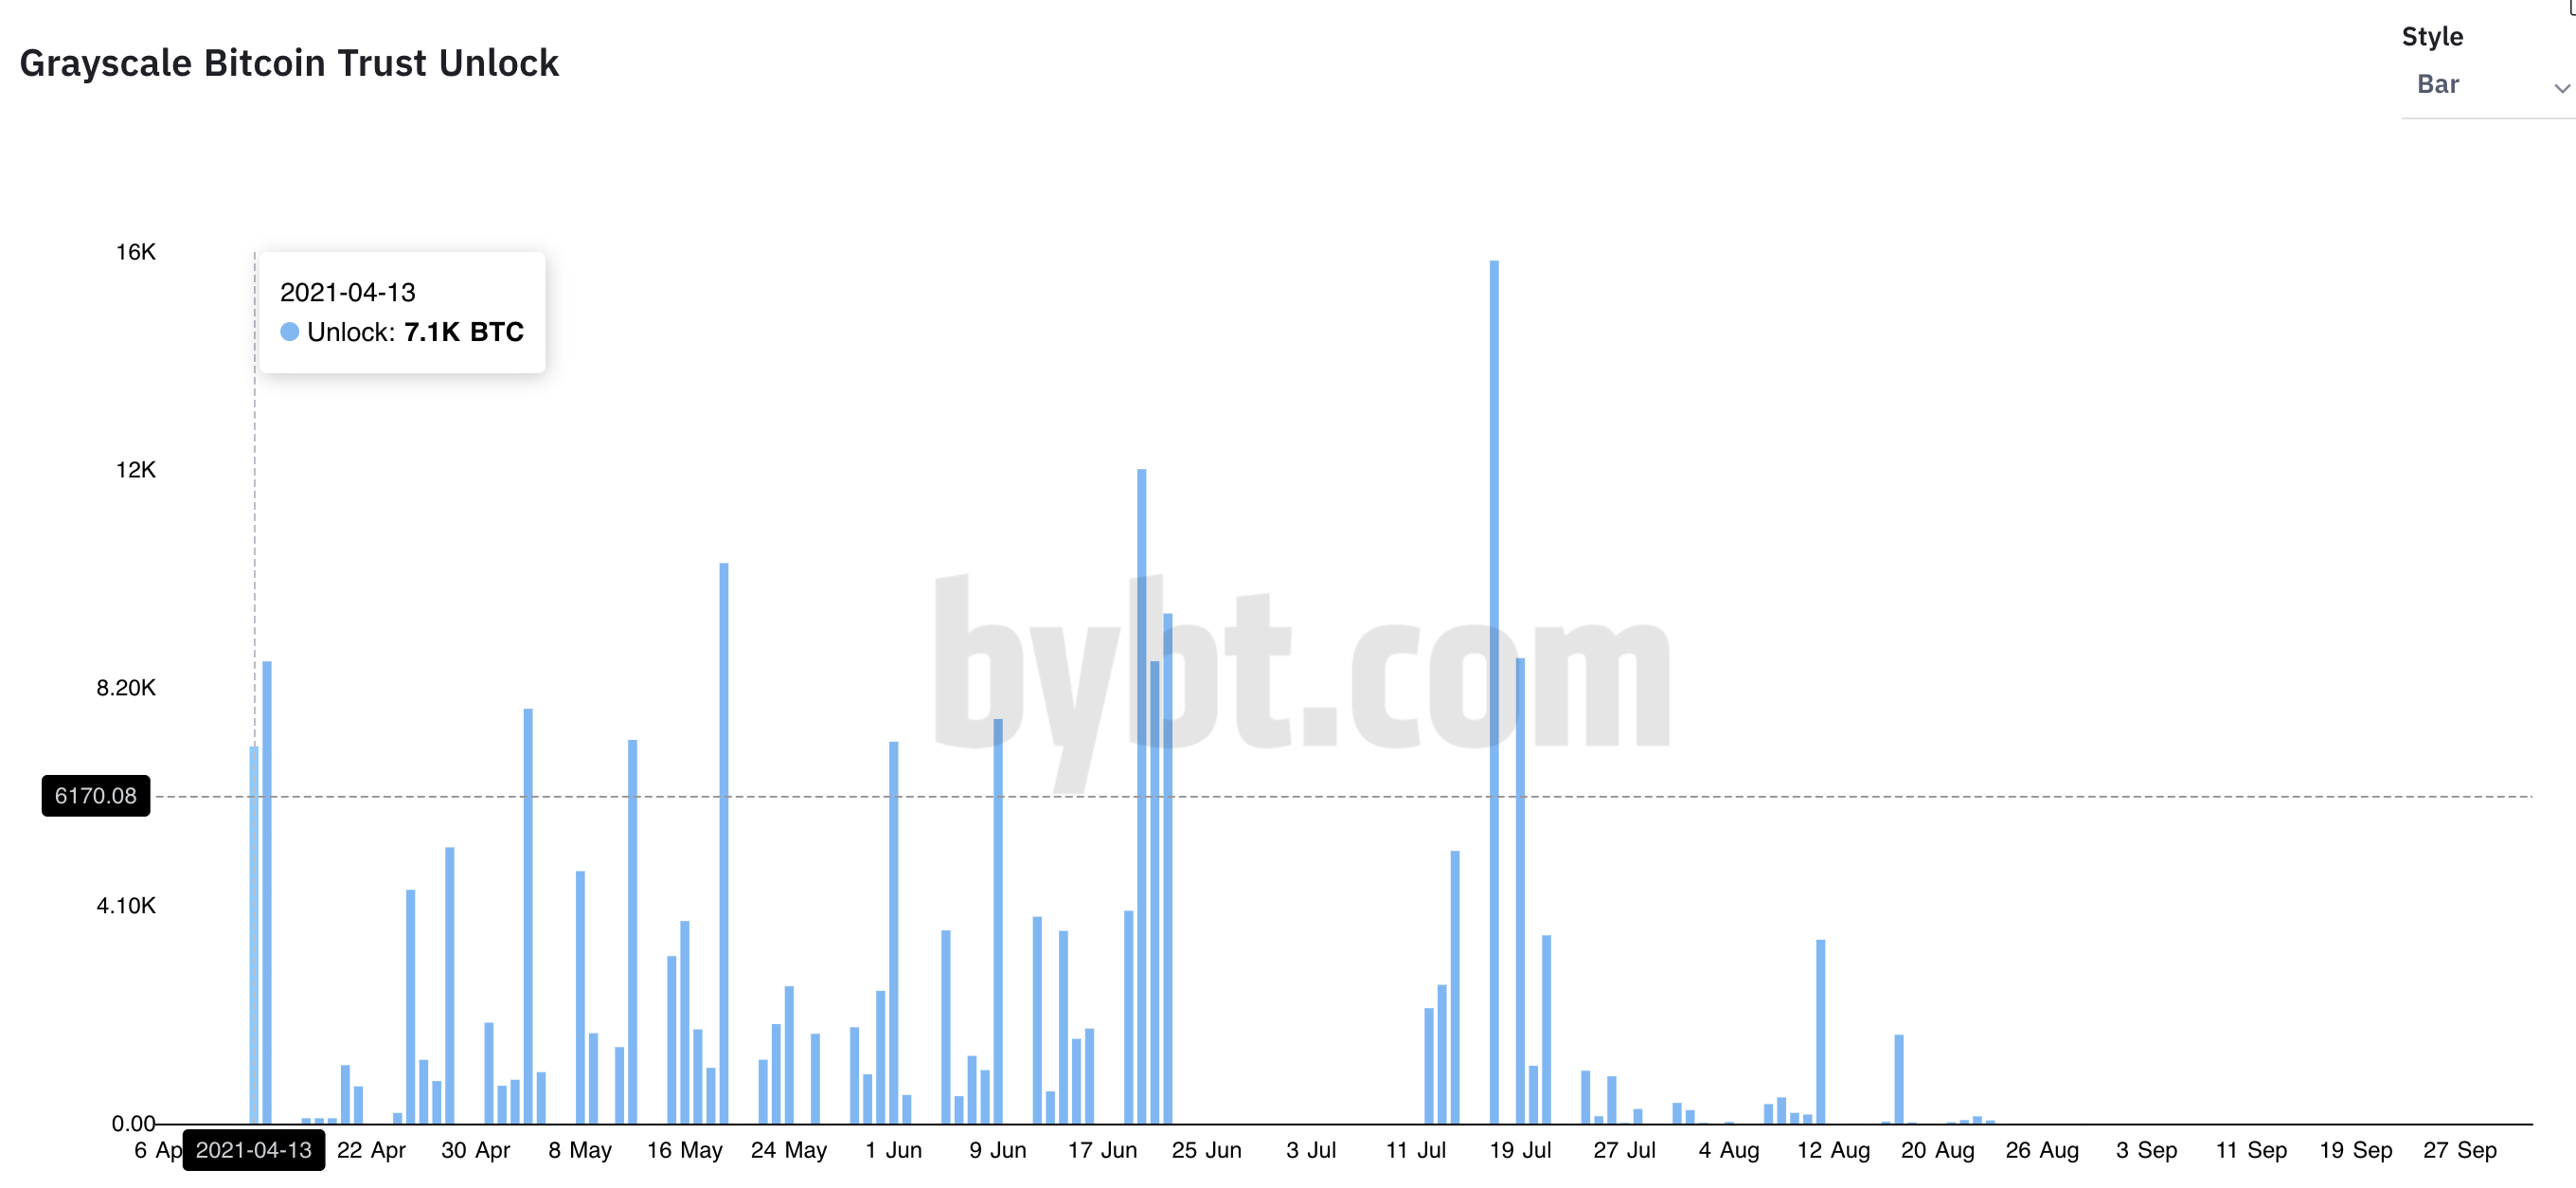
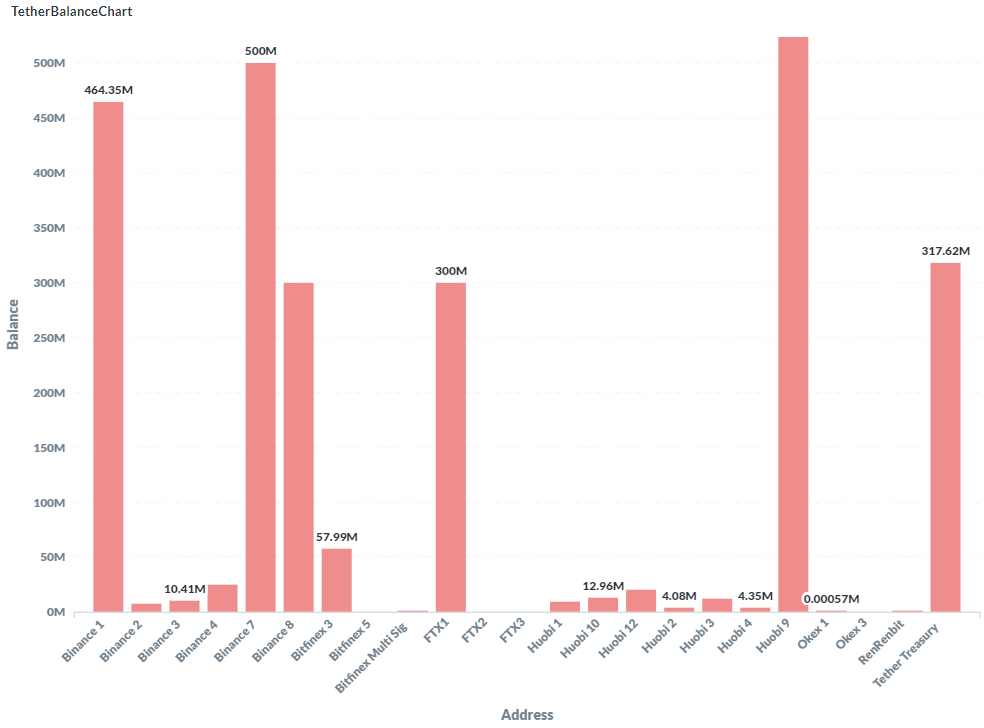
Speaking of Grayscale… sorry, bit of a detour here… check out this chart on bybt.com. This MIGHT make our lives a bit easier for writing purposes.
It shows daily unlocking amounts for GBTC. The thirteenth is your next unlocking according to bybt.com. The sources I use show a different date, so I’ll need to figure out where they source their information from. I hope it’s accurate as this could be very valuable for our work here.
Getting back to funding rates, here’s the funding rate profile.
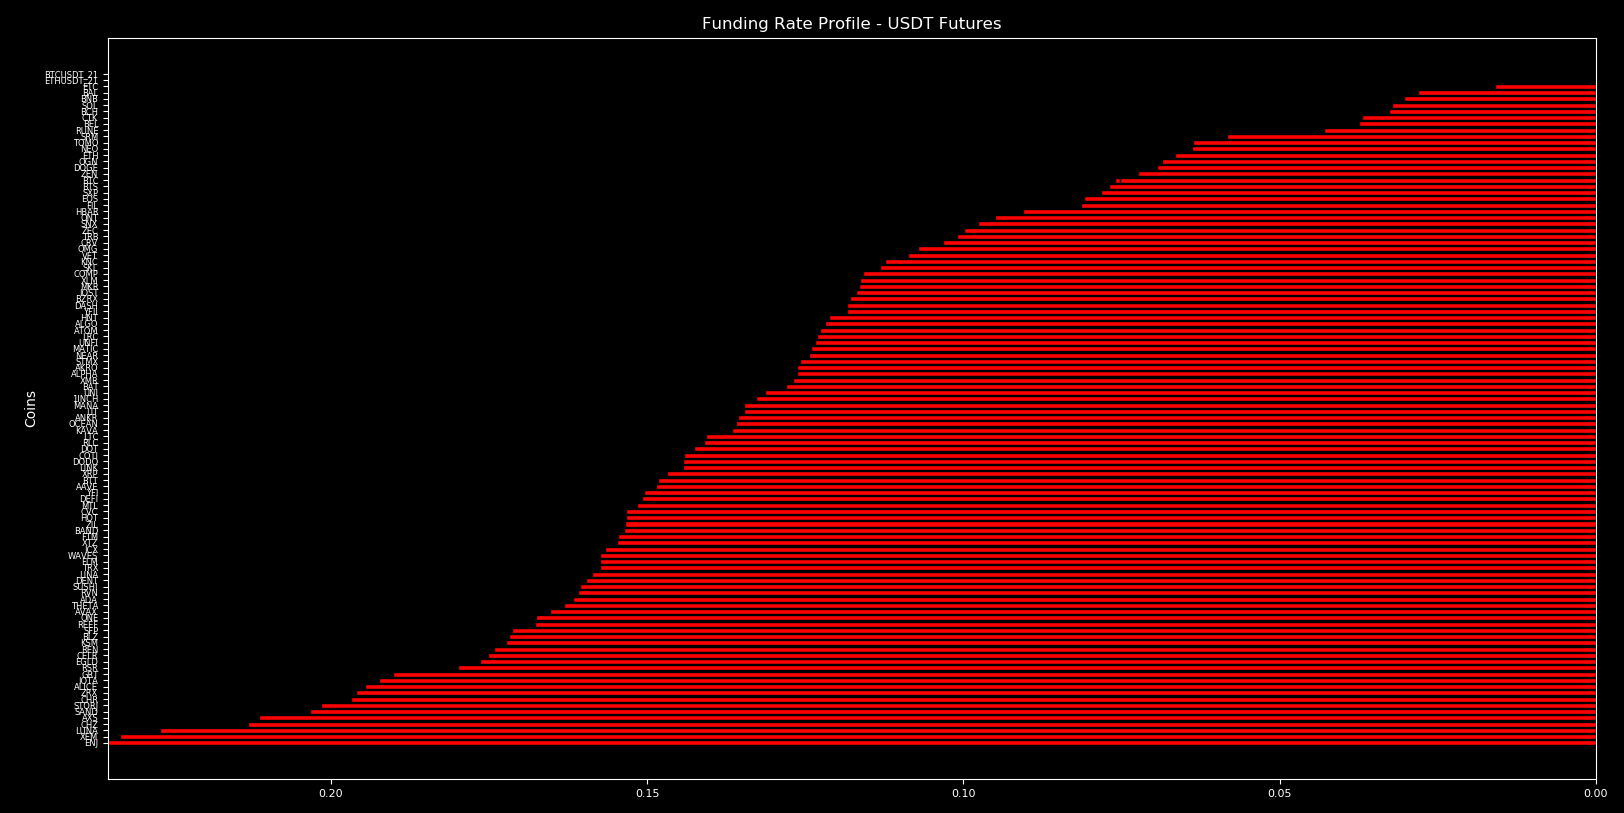
Remember, to figure out the annual rate on those long positions (red coloring) take the x-axis number (ie - 0.2) and multiple it by three (24 hours / 8 hours = 3) and then by 365 (days in a year) to generate an APY (ie - 219%). If the ticker is not showing then the funding rate is neutral at 0.015.
The higher the funding rates are, the more illogical the traders are. This tends to be another FOMO indicator that helps us determine if the market needs to cool off.
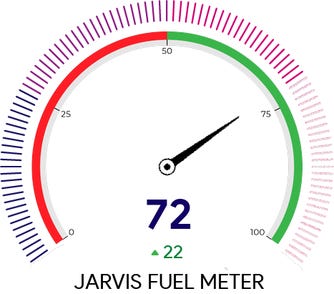
Lastly, the amount of fuel in the market is strong. This tells us buyers are likely to step up on any dips. It’s in part why we think a slow grind lower will be healthy. Whales will be able to accumulate and FOMO will be reduced in the market.
We’re expecting a bit of a slow week here before price steadily climbs its way into new all-time highs soon.
Chart of the Week
Here’s a chart we sent over to the CoinTelegraph team earlier this week. We feel like it sums up our thoughts on how we see the next two weeks playing out.
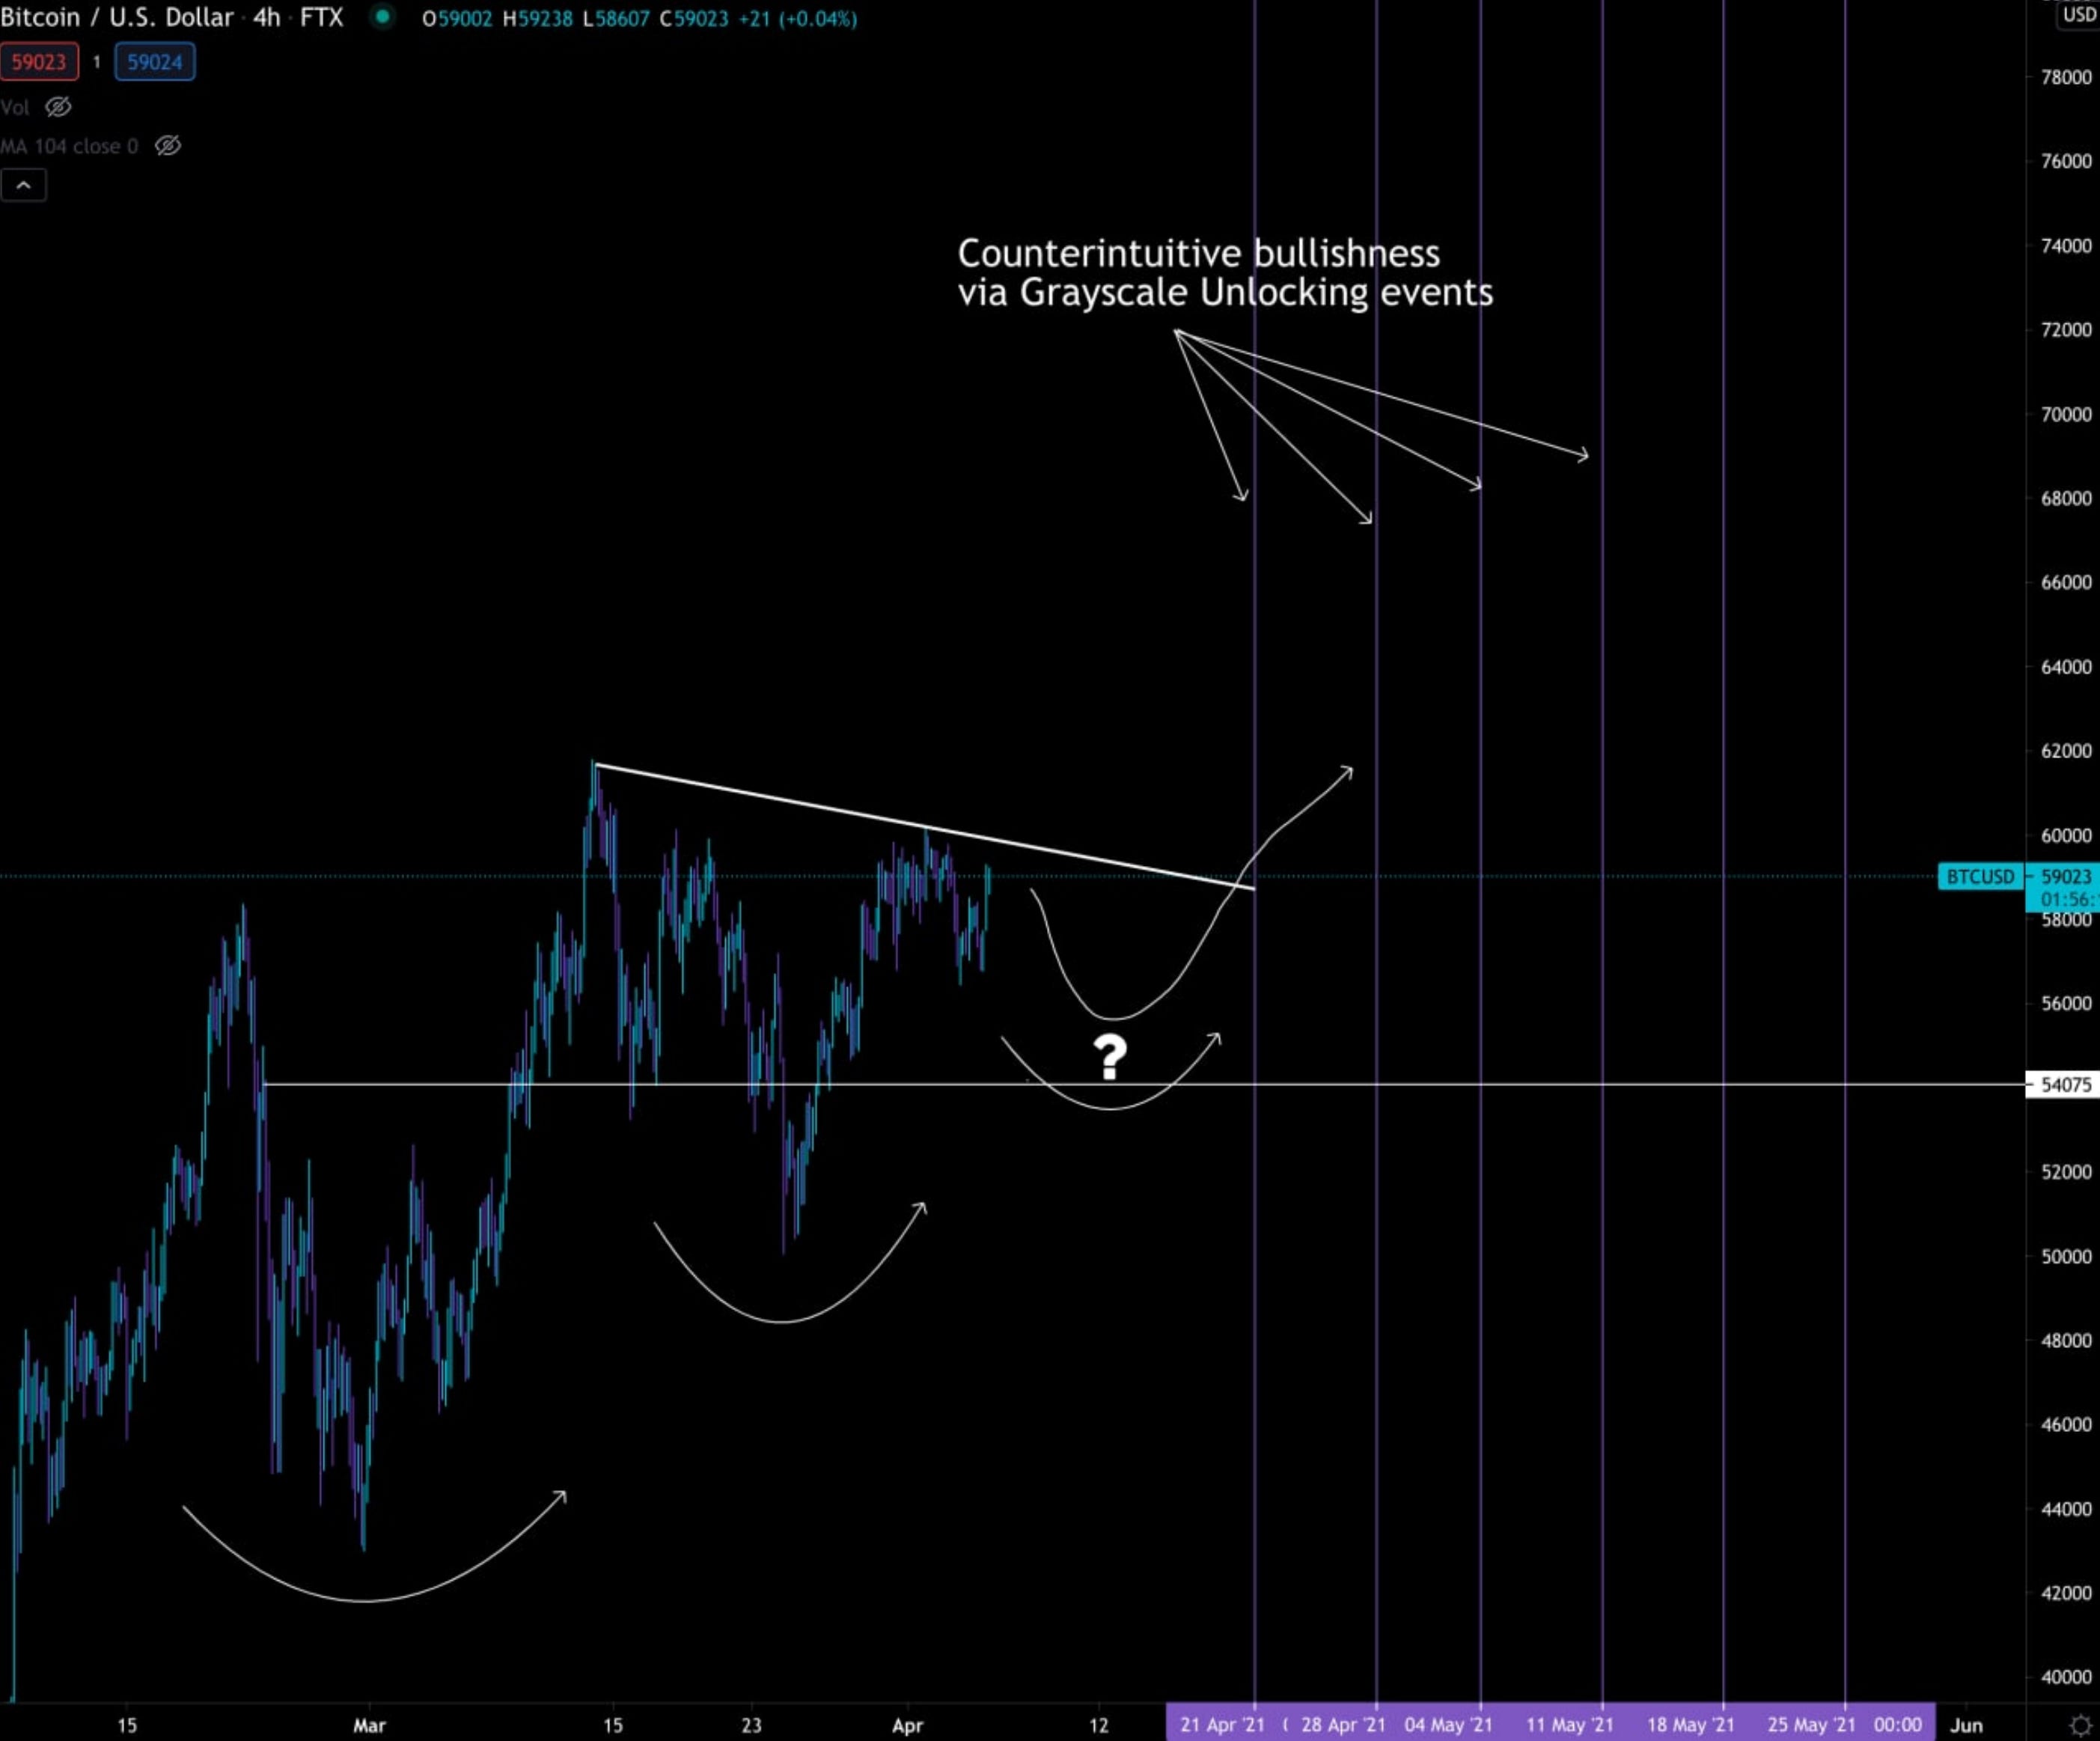
On-chain metrics indicate a solid base of support for Bitcoin’s price, with the only headwinds coming as a result of volatility in funding rates “as soon as there is any sort of pump”.
Due to this reaction, Lilly sees a possible retest of the $54,000 level to “grind away some of the FOMO” still found at that level, but he doesn’t see the price dropping any lower due to solid on-chain support at this level.
“Either way, we are setting up for a strong later half for April and beyond especially with the Grayscale Effect kicking in around that time.”
Let’s see how this if this chart plays out in the coming weeks.
Your Pulse on Crypto,
B
P.S. - A bit of housecleaning. We mentioned earlier, but as a reminder we are moving the main weekly ChainPulse report to Wednesday. This gives us adequate time to prepare each week for this issue. This new scheduling started with today’s. Moving forward Friday and Monday will be updates to this issue. If you are to read one issue per week, be sure this is the one.


