Adding Fuel to Fire
The meltup indicator you need to watch


$800 million liquidated in 15 minutes.
That was the result of bitcoin taking another dip after it broke its all-time high.
Honestly, it took us a bit by surprise as nothing initially showed itself on-chain. In fact, as price stalled shortly after its breakout, we saw just below the surface accumulation.
The tactic was beginning to look like whales trying to attract liquidity in order to push price higher. We’ve seen it many times before…
The pattern looks like this - Price breaks out of its current pattern, stalls, short positions begin to build, and then the market movers use those shorts as fuel to push higher.
This time it didn’t pan out that way.
In terms of why, some have mentioned an alert by CryptoQuant as being responsible. The critics point to a massive inflow alert regarding a transaction tied to Gemini. They state this is what led to cascading liquidations.
We don’t know if this is necessarily true or not, but we do think it’s rather short-sighted to blame such things on an on-chain data provider. After all, the market is massive and a single alert isn’t likely to create $100 billion+ moves.
But what we sort of wish did take place is more collaboration during the aftermath.
Look… we look at much of the data as the on-chain providers are working with. We know its limitations.
This is a bleeding edge territory in crypto and frankly, these guys are experts in the field. That applies to Glassnode, CryptoQuant and CoinMetrics. We’ve worked with them all and each of them are professionals. So if you find yourself wanting to point a finger or get upset, reconsider.
Find a way to be a solution. Offer any data you might know. This is crypto and that’s the mentality of the space. And while we’re on it… since many of you asked for our advice on the matter. I’ll state this…
Where Jarvis Labs differs from others is in how we label wallets. It’s all about its impact on price.
It’s not in terms of who’s behind the wallet.
We search for the signal to generate alpha. Which means often times we don’t need to know the individual or entity behind the wallet or necessarily why something is correlated.
In that way we try to emulate Jim Simons, arguably the most successful Quant trader of our time. He looks for signals and doesn’t necessarily need to understand the why.
Jim is doing pretty well based upon this line of thinking.
As for us, we’re doing good as well. Jarvis AI managed the risk by cutting bait just as risk started elevating and price started to drop.
Unfortunately for others, I’m sure the dip led to a host of questions.
In particular, is a new trend forming? Is another dip about to happen? Should I sell?
Well, using today’s metric we’ll show you why we believe the top is not in. And why we view this dip as an opportunity to find new entries before moving higher.
What’s more, we think price will soon enter a region we’re referring to as the meltup zone. It’s where price can go parabolic in a matter of a few weeks.
So let’s get started…
Today’s on-chain metric is called the Puell Multiple (PM). It is calculated by dividing the daily issuance value of bitcoins by 365MA of the issuance value.
Essentially its a value that’s helps determine if the market is running hot.
Right now about 900 BTC are minted per day. At a current price of $56k that’s about $50.4 million. The 365-day moving average of this figure is a little less than $15 million. When you divide the two you come up with the current reading of 3.38.
Now, in terms of what 3.38 means in the grand scheme of things let’s look at the chart below.
Essentially, whenever the PM goes above 4 price tends to just go bonkers. This happened once in the last halving cycle and twice in the cycle before.
The red box highlights the area above a reading of 4.
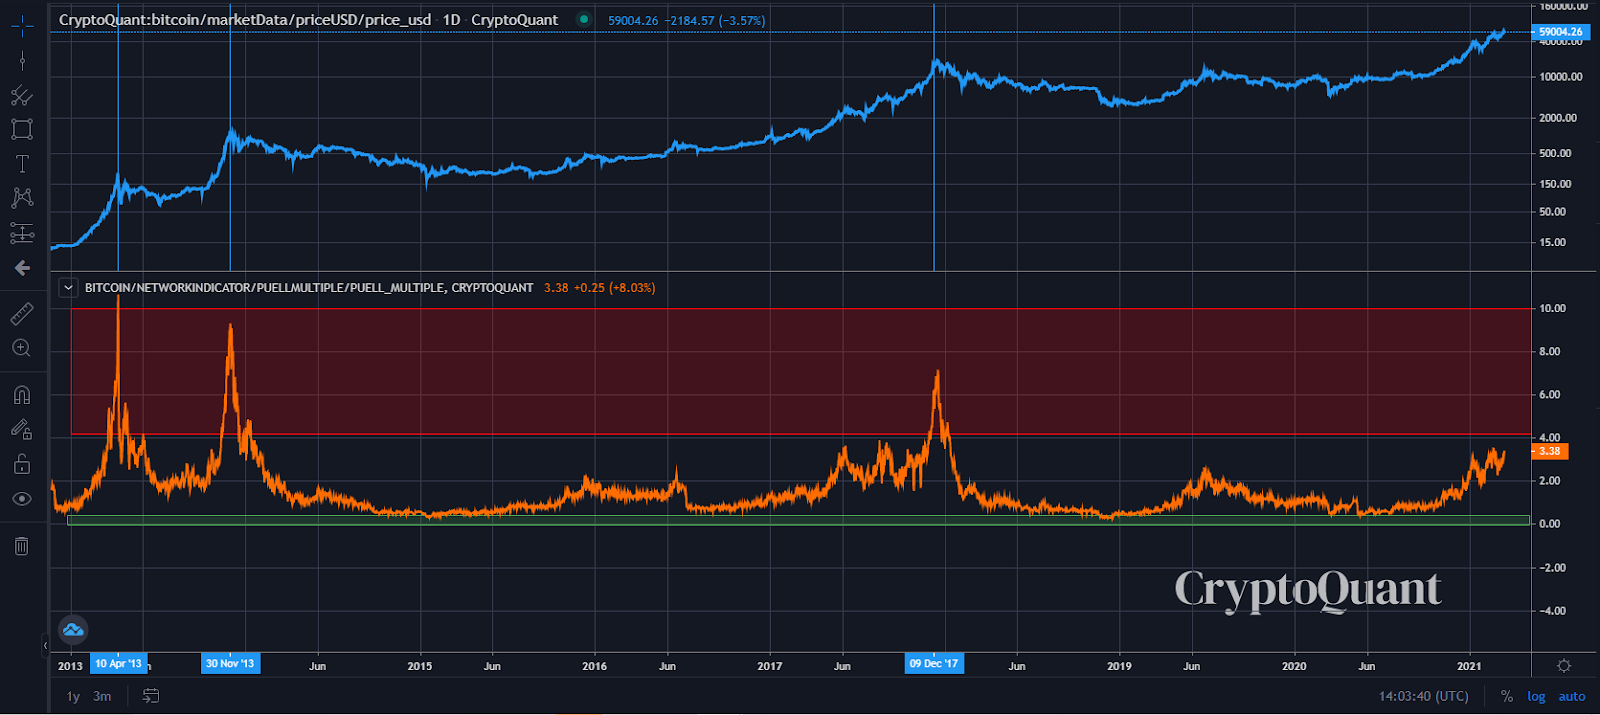
What’s interesting here is that in 2017 the PM consolidated a bit before breaking into the red box seen above. It’s likely why price did a steady increase before it went vertical in December 2017.
This is in contrast to 2013 where the PM reading didn’t consolidate much prior before going vertical.
In terms of what we’re seeing now…
It seems as if PM is consolidating a bit just below the red box. Meaning when it breaks it might be a good indicator a blowoff top is in progress.
It’s important to know that when this takes place, price is essentially free from the forces of gravity. There’s no saying how fast or far it can move.
That presents us with a double edge sword.
Price can create tons of profits for traders and also whipsaw around to liquidate traders. Which is why when this takes place its of the upmost important to stay true to your risk management practices.
This might be a trailing stop loss, a stop loss, or taking money off the table at certain price points. Whatever your policy is, it’s no time to deviate.
Likewise, it’s important to remember what Soros said in regards to bubble.
“When I see a bubble forming, I rush in to buy”.
I love this quote as it speaks to the money that can be made in such an environment. In terms of the usage of “bubble” in that quote… I don’t view bitcoin or crypto as a bubble. Nor would I call it a meltup… It’s a halving cycle with a peak and trough.
Which means I understand there is likely to be some rough months ahead.
However, for now, when this PM chart spikes into the red, I think I’ll borrow a page from Soros and make some gains.
Your Pulse on Crypto,
B
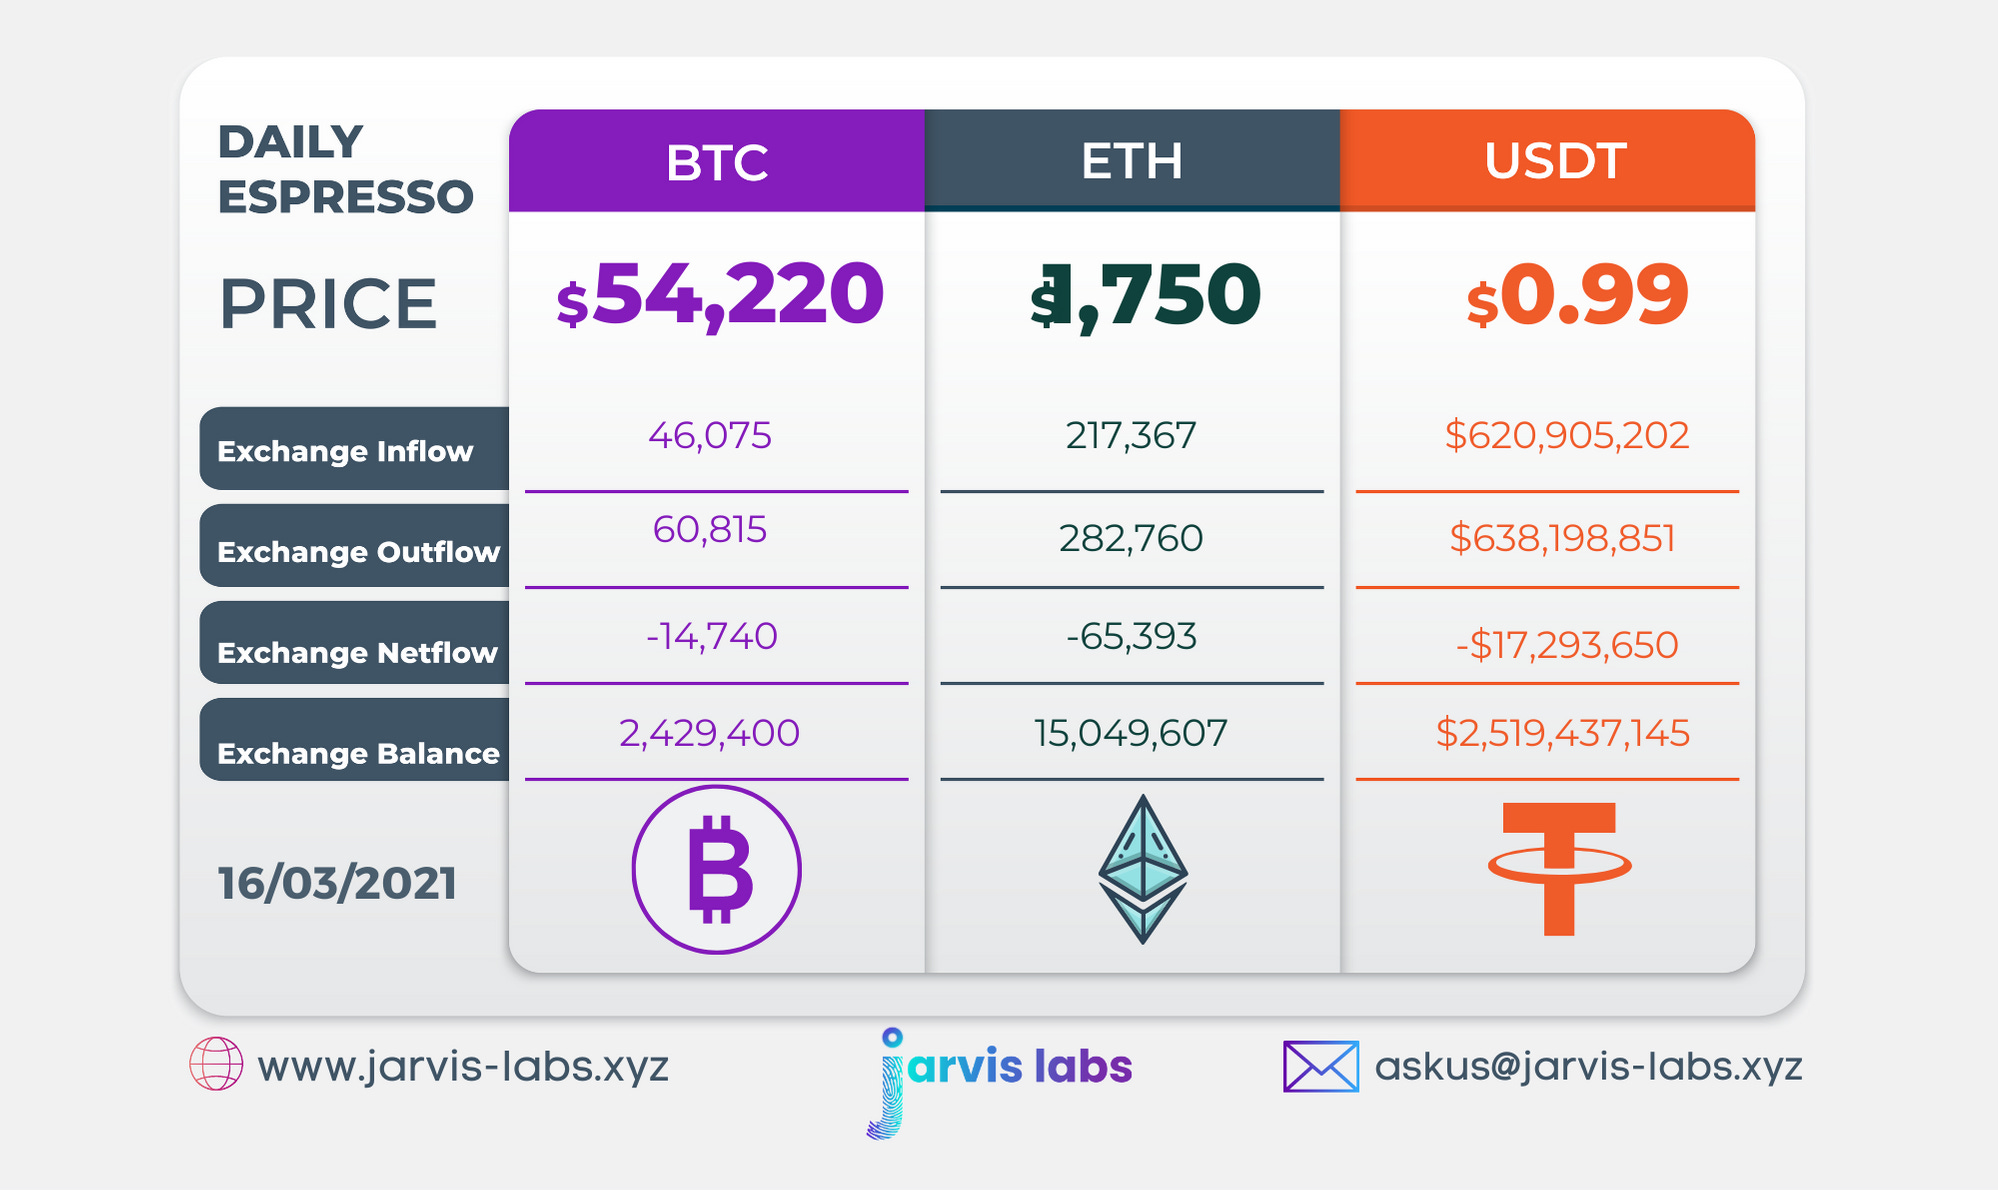
Below is our daily exchange flow data. This is a great gauge for understanding if BTC, ETH and USDT are flowing into exchange or leaving. If BTC and ETH are entering exchanges it can generally be viewed as bearish. The opposite scenario is bullish.
When USDT is flowing into exchanges it’s typically viewed as bullish. The opposite scenario is bearish.
This should only be used as a general gauge. Tagging the exact wallets these flows move into or out of helps improve the reliability of this data, which is what we do at Jarvis Labs. To date we have over 800 market mover wallets and 16 million wallets tagged all together. Consider us your on-chain trackers.