The Pi Cross
When these two lines cross it's within three days from a top


Are you bored.
Most traders are getting to that point.
We’re trading at almost the same price as of one month ago. There’s been some bronco bucking volatility along the way, but not the parabolic chads many traders are seeking.
And instead of getting too distracted by things outside of the market, you’re here, reading Espresso. This tells me you are a student of the market. While others come and go with volatility and FOMO tendencies, you’re here preparing.
Today is one of those days. Which is why we want to stack another useful chip in your corner, so you’re prepared for the moment bitcoin gets poked by a red hot branding iron.
The chip today is the Pi Cycle indicator.
This metric was created by Philip Swift two years ago. It’s a metric that’s a crossover of two moving averages. Typically traders use a 50 day moving average (MA) and a 200d MA. When these cross it’s known as a death cross or golden cross.
The Pi Cycle is similar in that it uses two moving averages and the crossing of the two. Specifically the 350d MA X2 (literally multiplied by two) and the 111d MA. And the manner in which the need to cross is the 111dMA crossed the 350d MA from the underside, and moves higher.
This lets it act like a “overheating” indicator.
Now, the as for the “why” these two multiplies… The numbers have roots in Fibonacci numbers and the number Pi. If you’re interested in learning more about it you can read Philip’s blog post here.
I will mention the involvement of Pi comes from 350 being divided by 111. It’s as close as you can get to the number Pi while using 350.
Ignoring how the sausage is made here (skipping the Fibonacci portion), let’s see how it looks on a bitcoin chart.
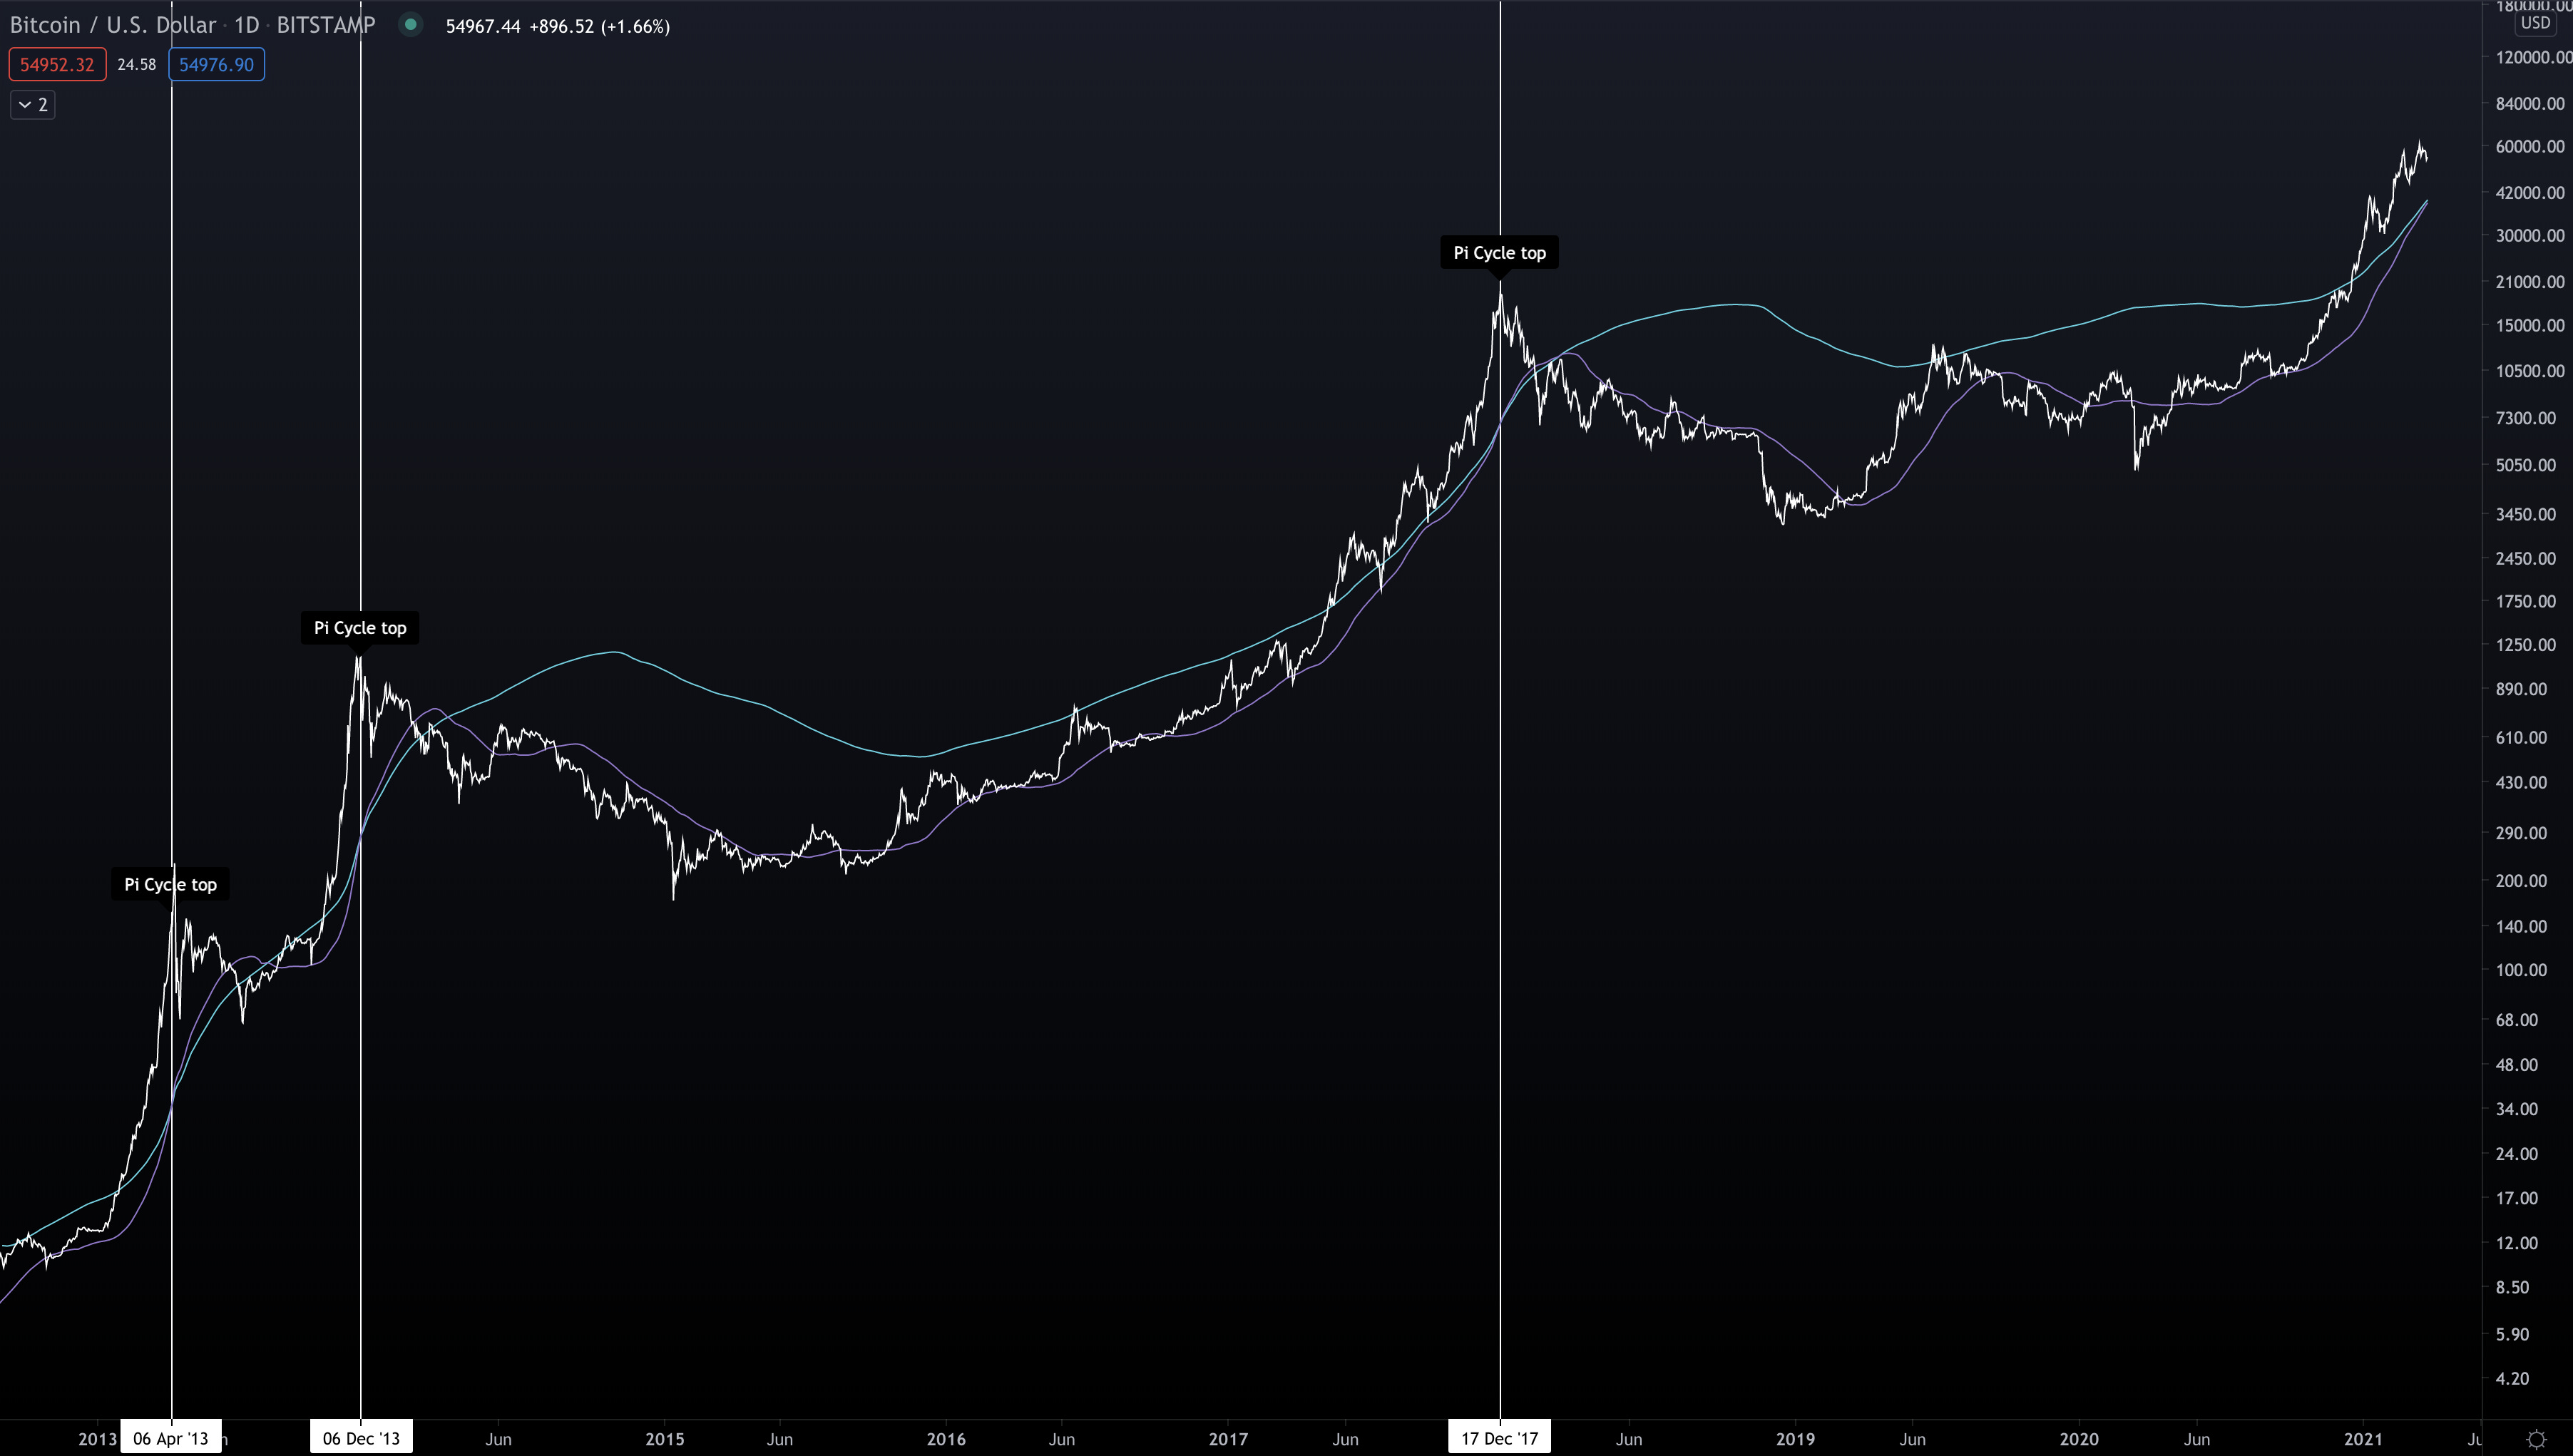
It’s pretty spot on. In the last three tops it’s been accurate within three days. So it’s not something to really write off. There’s a certain amount of weight that can be given to the Pi Cycle indicator based upon past performance.
When looking at where the Pi Cycle indicator is today, it’s pretty close to a cross over. It’s about $1,000 from crossing over.
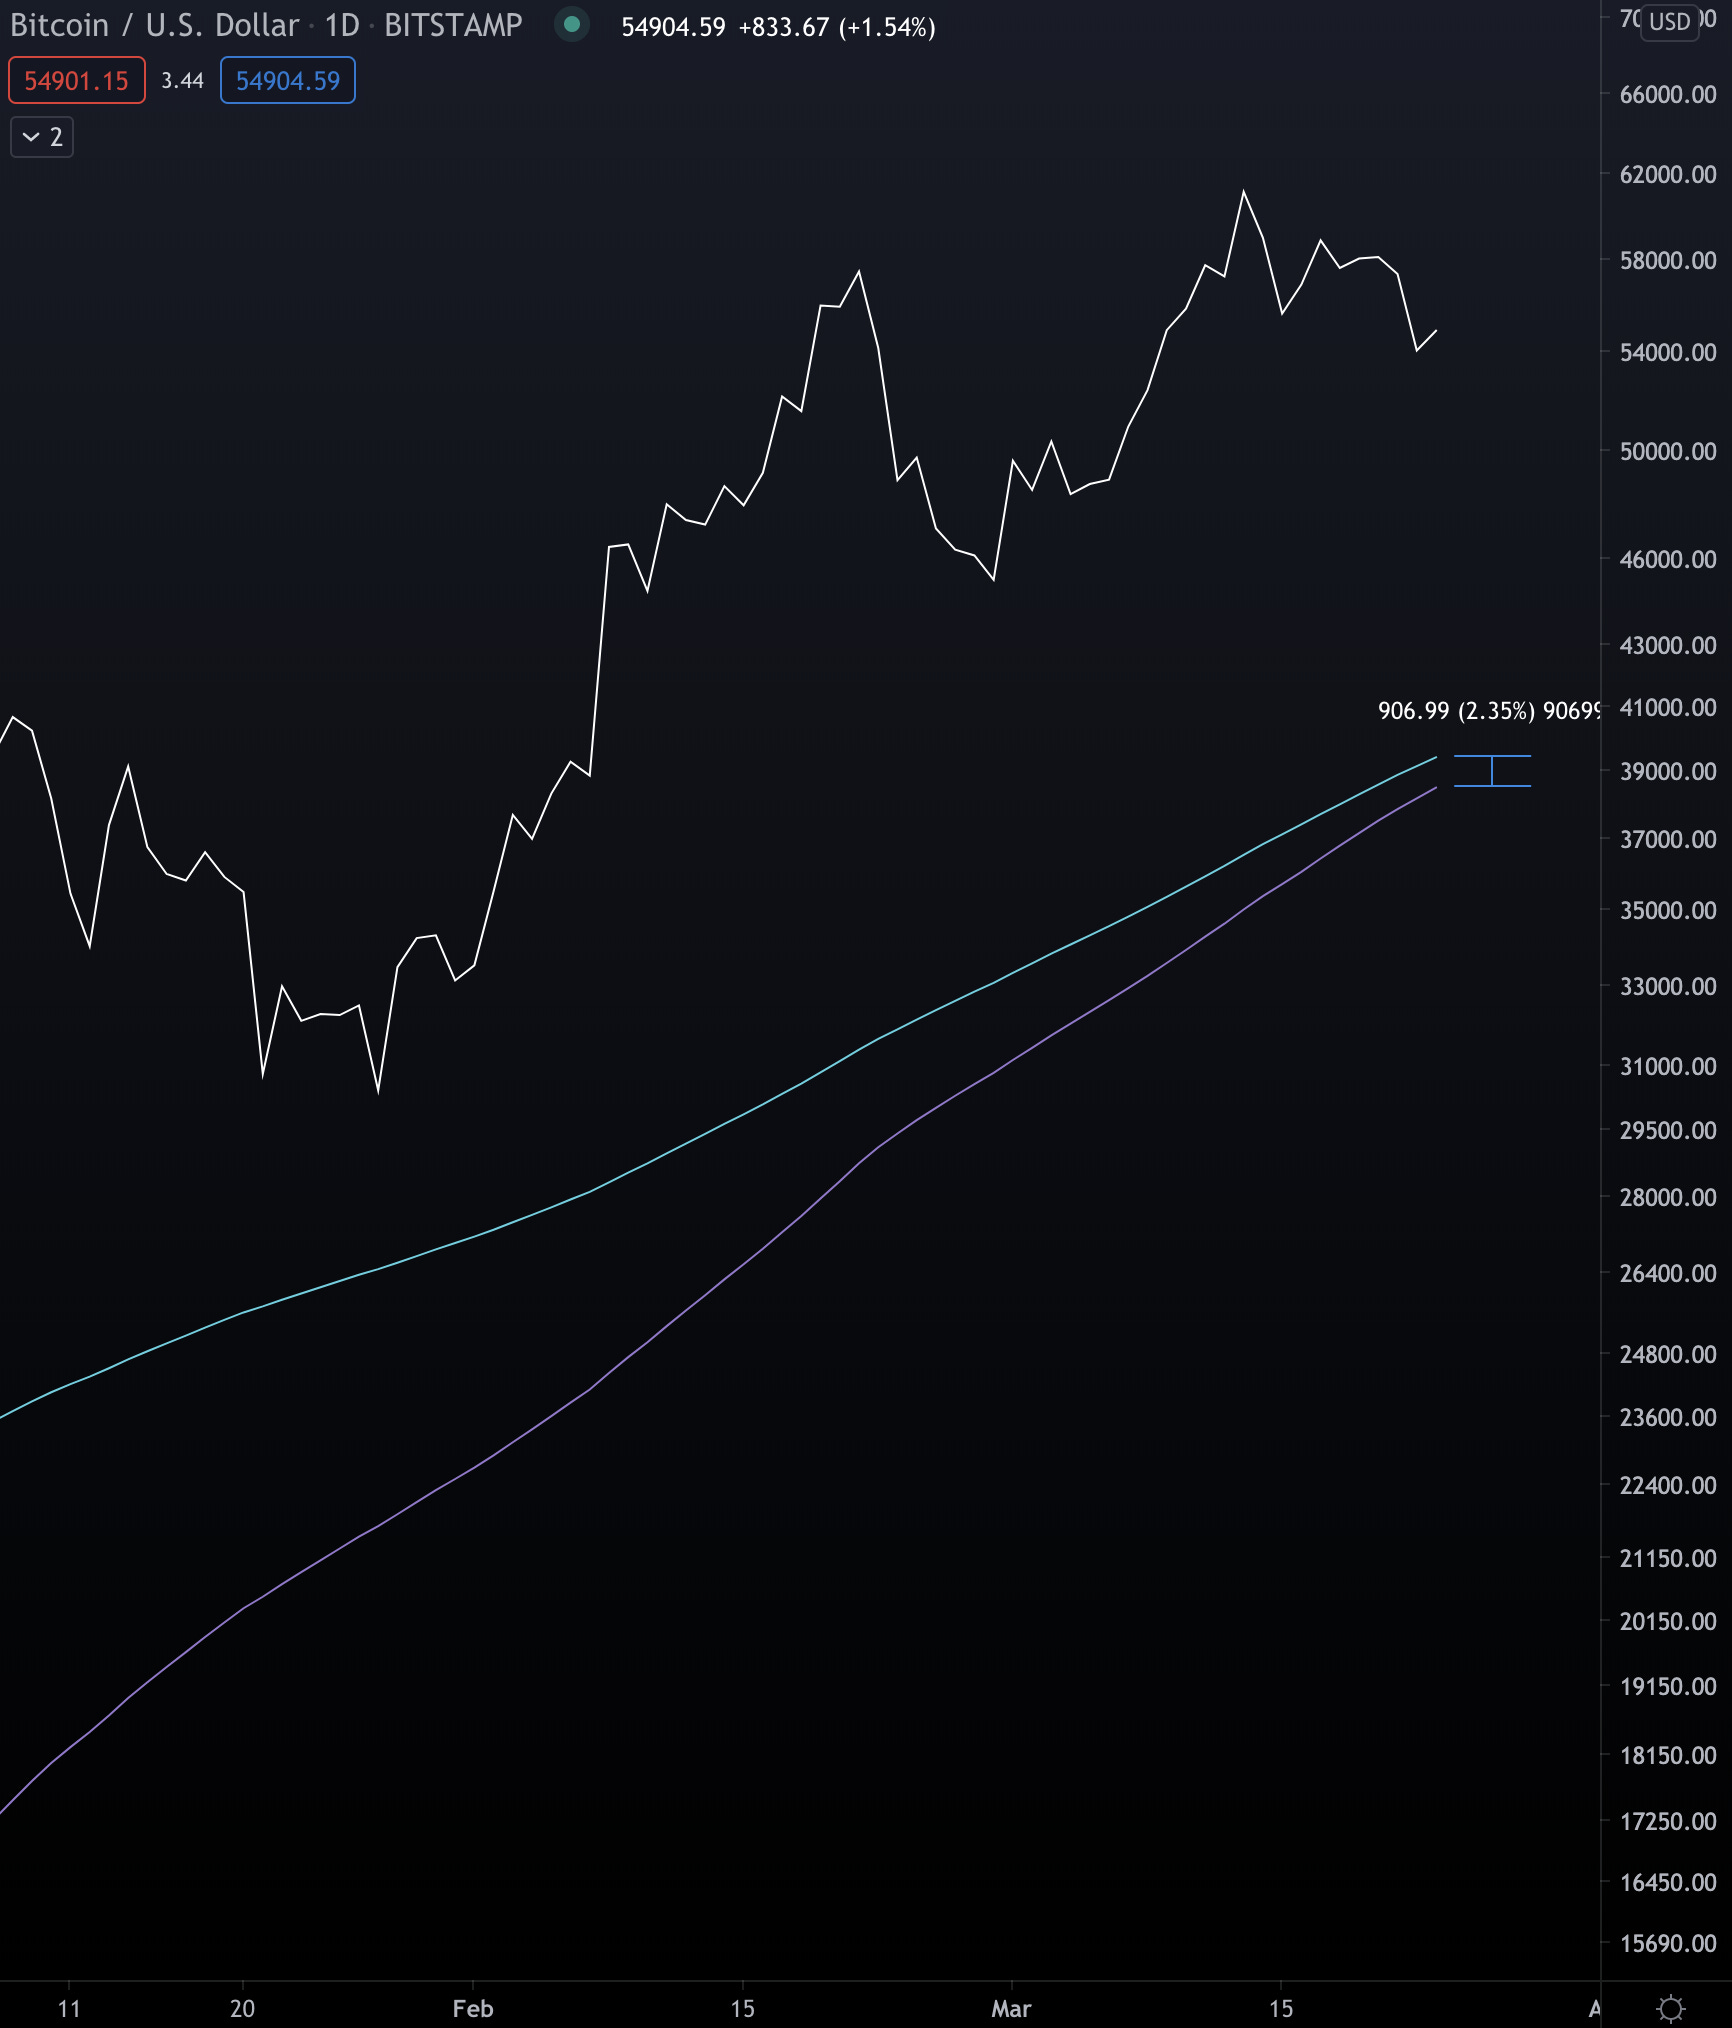
Based on how the indicator performed in the past, if we get a crossover in the next few weeks then we might be nearing a cycle top or potentially a mid-cycle top like in 2013.
And if the current trend continues then a crossover is likely to happen near the end of April or beginning of May.
This doesn’t put a $100k price point out of the cards yet, but more along the lines of… If price starts to rip higher, how quickly does it happen? And does the Pi Cycle indicator continue to act as prophesy?
We’ll take a look when we see a cross.
Your Pulse on Crypto,
B
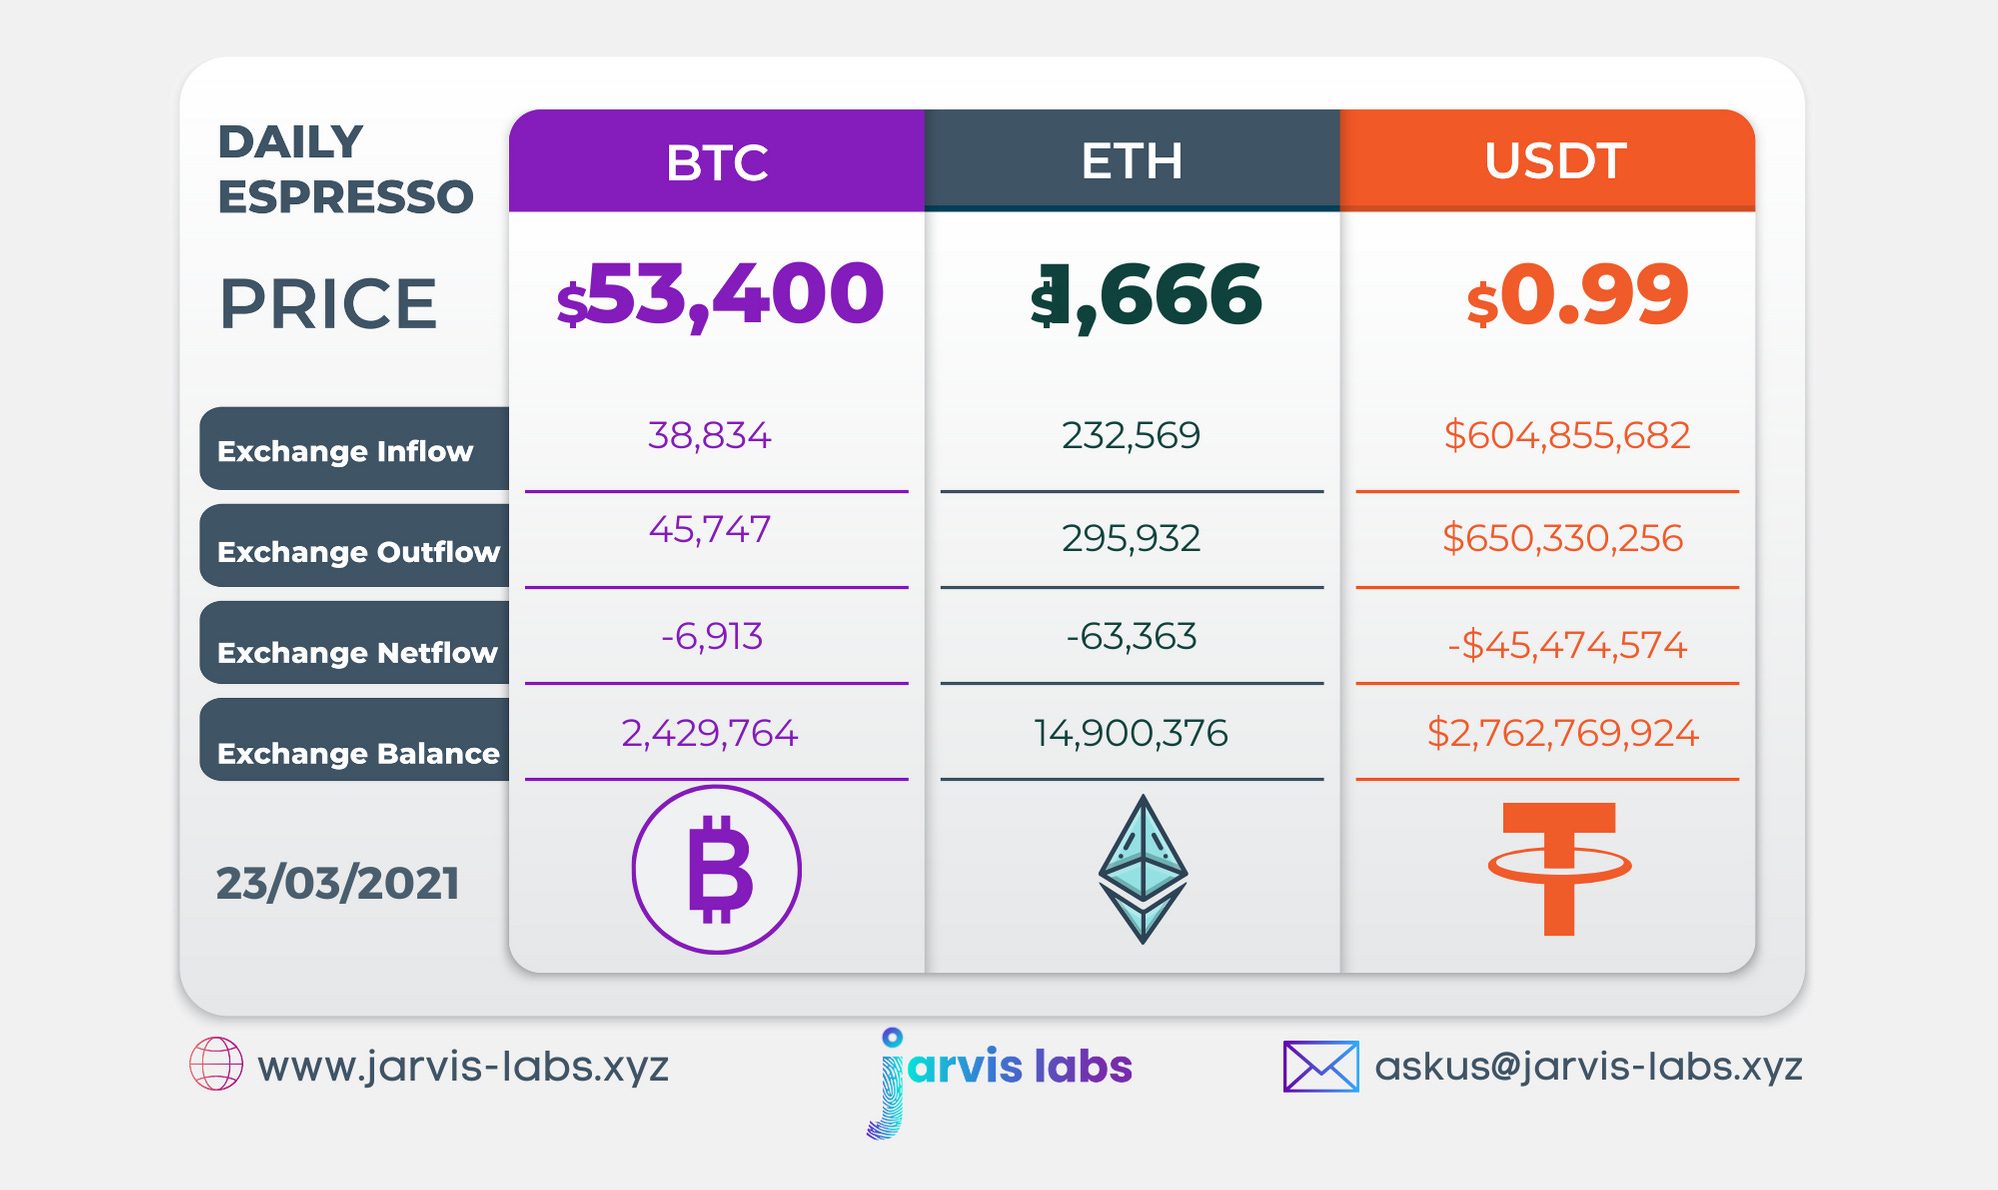
Below is our daily exchange flow data. This is a great gauge for understanding if BTC, ETH and USDt are flowing into exchange or leaving. If BTC and ETH are entering exchanges it can generally be viewed as bearish. The opposite scenario is bullish.
When USDt is flowing into exchanges it’s typically viewed as bullish. The opposite scenario is bearish.
This should only be used as a general gauge. Tagging the exact wallets these flows move into or out of helps improve the reliability of this data, which is what we do at Jarvis Labs. To date we have over 800 market mover wallets and 16 million wallets tagged all together. Consider us your on-chain trackers.