Bubbling Madness
Market Update: Eyes on where this market softness reverses

Ten feet of fire… From a turkey.
If you know what I’m talking about you will likely agree…
The risk is worth it.
For the past two decades, deep-fried turkey has become increasingly popular. Especially in The States for Thanksgiving dinner.
It is easy to see why. The deep frier leaves the skin crispy while trapping all the tender juiciness inside.
Better yet, it trims the 3.5 hours of cooking time down to under an hour. Better tasting for less effort.
But the reward does not come without risk. The deep frier is essentially a big cauldron of hot oil sitting on top of an open fire. And if the turkey is partially frozen, that bucket of bubbling madness can erupt into a fire tornado as seen here.
This is why any deep fried adventurer needs to ensure enough time has passed before the grand event takes place of dropping the turkey into the bucket.
The time component is crucial. And when it comes to the markets, it is this time component we are watching as Ethereum’s merge event draws near.
That’s because as price goes about its random walk, if ETH’s price starts to catch fire too soon, things will be as volatile as a frozen bird in 400F degree boiling seed oils.
But before we get to the fiery inferno, let’s first talk about the previous week’s price action…
Welcome to the Espresso Market Update. This is a weekly essay that brings together onchain data, offchain data, and anything else influencing markets to determine the why in market behavior… While also providing an update on what to look out for in the week to come.
The charts, data, and insights you see in this essay are a derivative of both the analysts, quants, and researchers at Jarvis Labs as well as the workings of our Jarvis AI autonomous trading system. At the heart of it all sits our onchain data infrastructure that is the most powerful in the industry and combine it with one of the largest databases of offchain data in order to navigate markets and its risks.
If you want to learn more about us, be sure to visit our homepage at www.jarvis-labs.xyz or simply subscribe to Espresso by putting your email below. This way, you will be the first to know of the latest insight coming out of The Lab.
Recap
Last week in our essay “Unknown Unknowns” we said any positive development from Ethereum’s testnet merge will send the price action to the upside. And any upside action wouldn’t translate to a long-term push into the actual merge.
If anything, what was saw was Ethereum’s Goerli testnet merge was a success and ETH2.0 is now penciled in for September 15th.
Now, the testnet merge festivities that started on August 10th helped price rise more than 20% until the 14th. Since then, price is down about 10% from those highs for Ethereum. Meaning the event itself was in fact not indicative of a longer term trend, just a mere blip amidst a much larger market trend that is unfolding.
Fast forward a few days to today, and the market is looking soft.
We first started seeing hints of this as whale buying began to slow in our update two weeks ago in “The Rising Trend”. In the essay we dove into a trend where the New York timezone was realizing almost all the gains that took place in ETH and BTC.
Sure enough, the New York timezone is still leading the charge… only this time, that trend is lower since the start of the month. You can see this in the green line below that represents the New York trading session for BTC down nearly 8%.
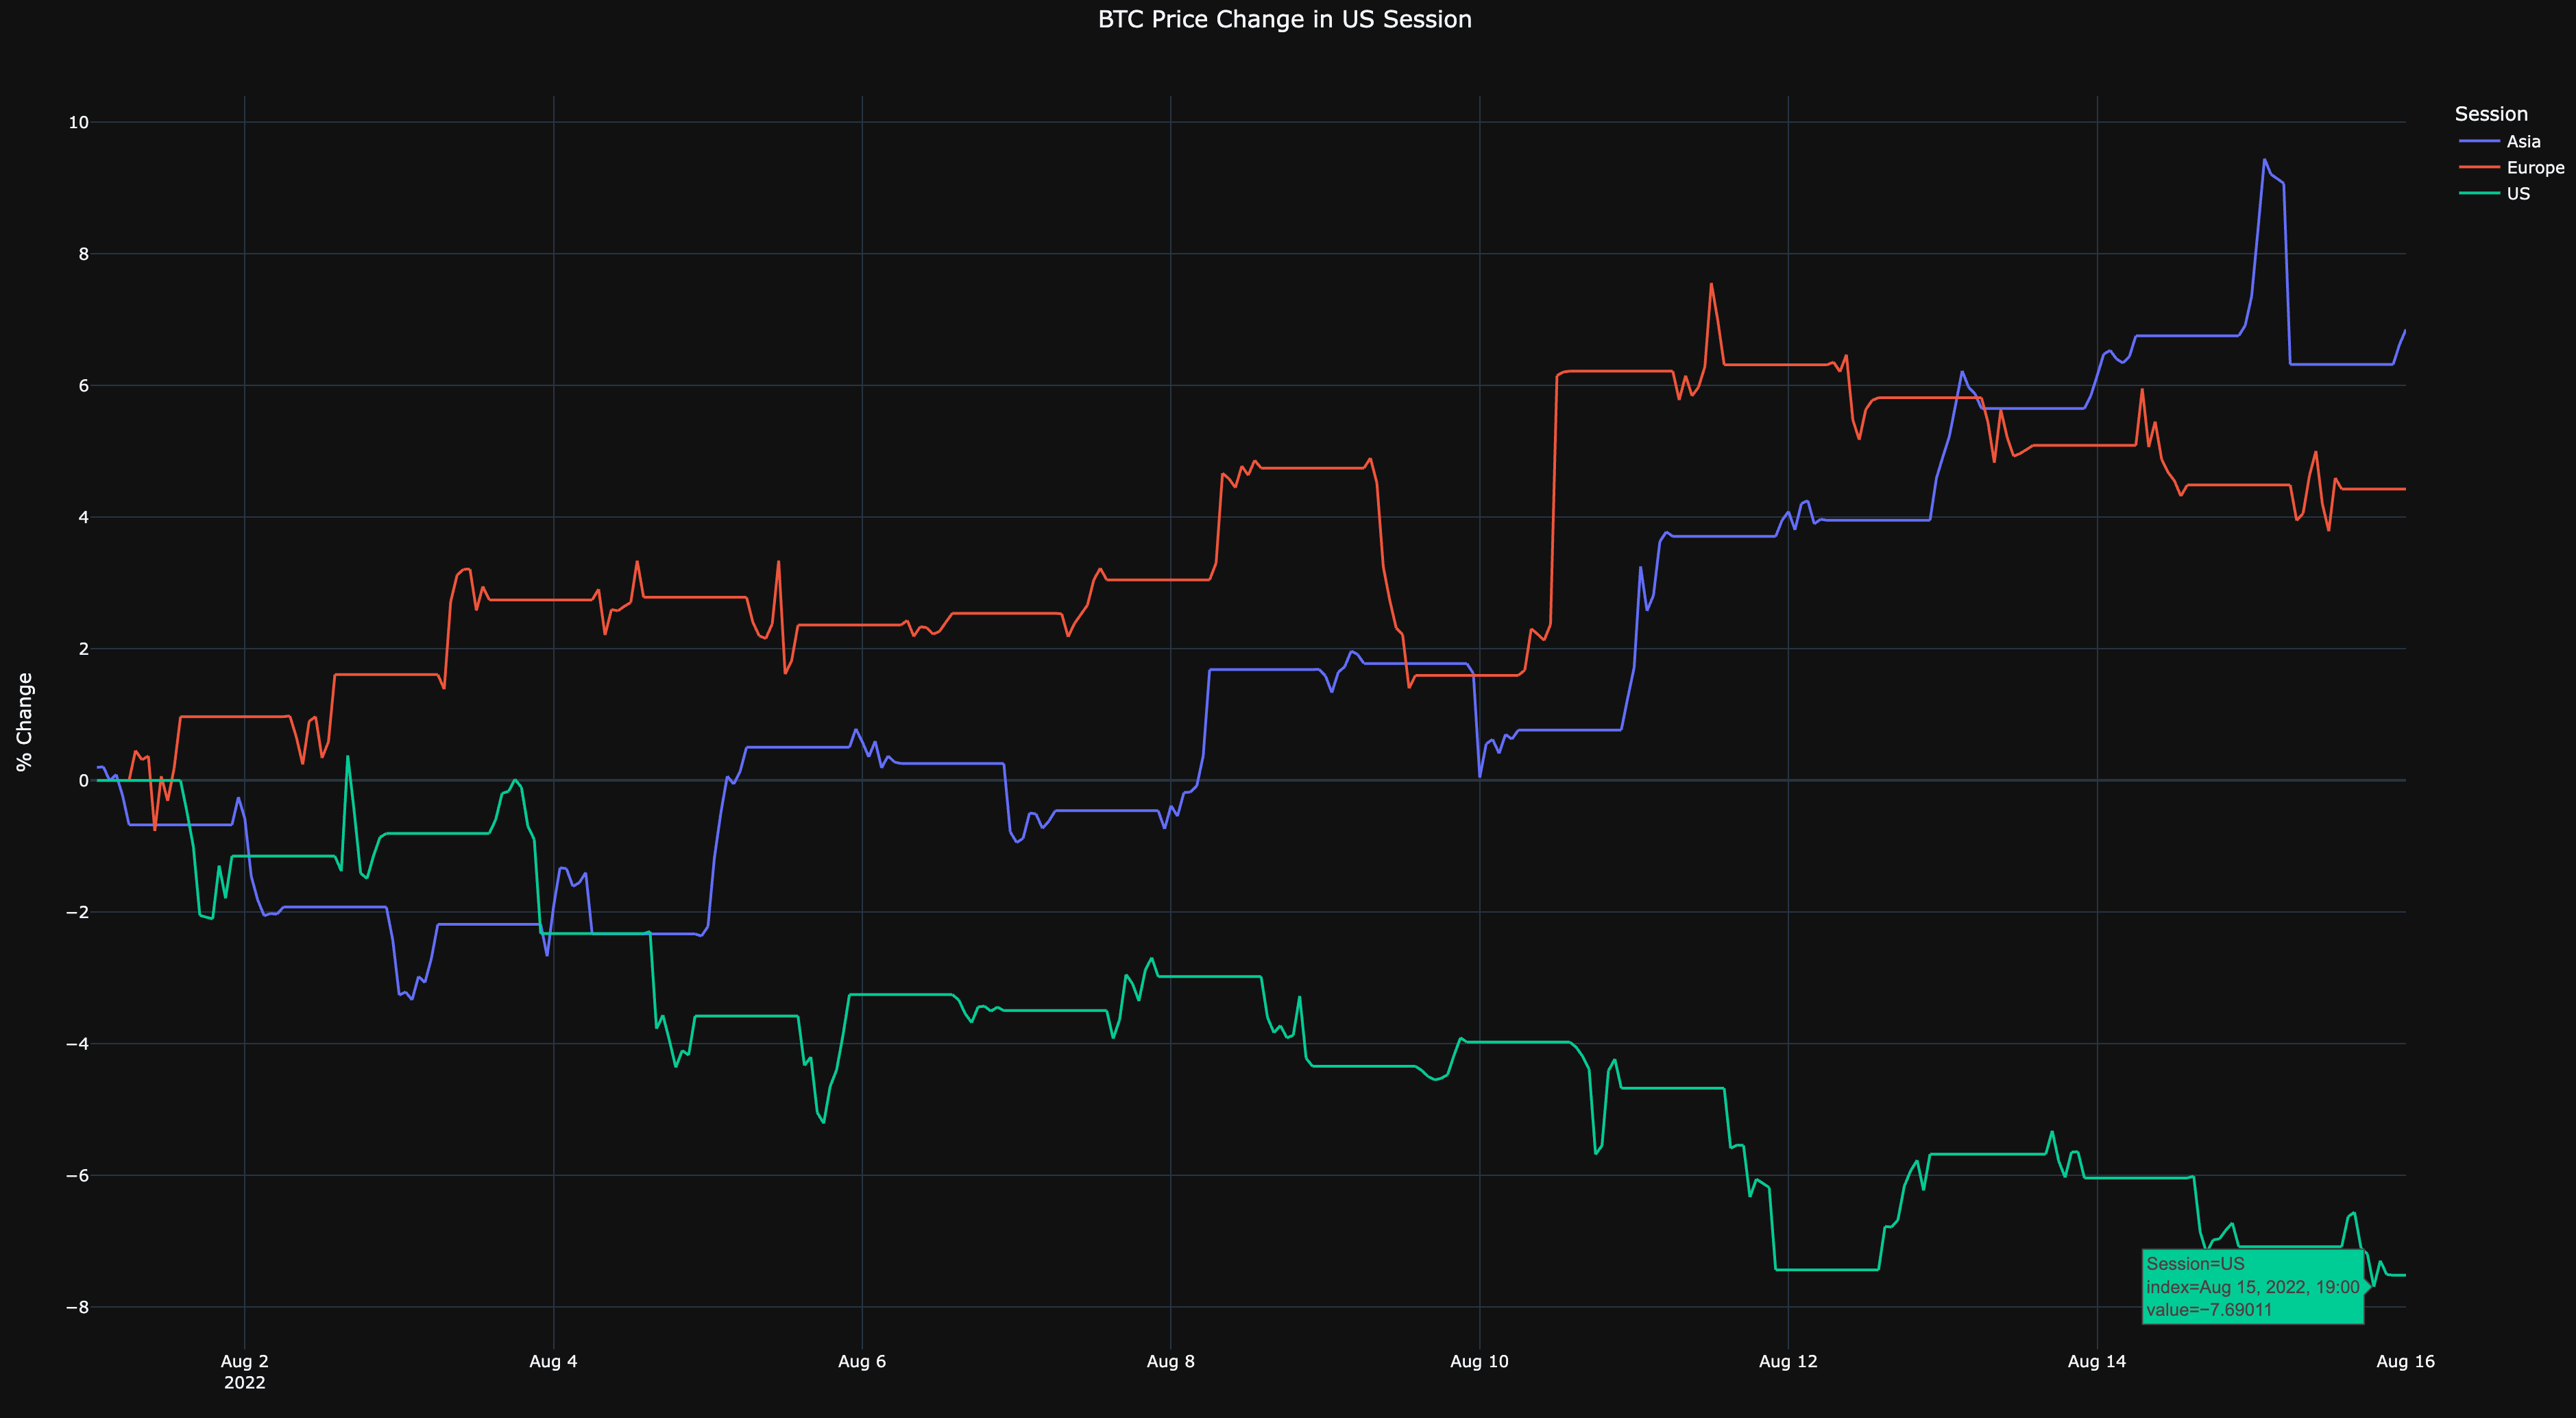
Ethereum has a similar story with ETH during NY session down 5.5%.
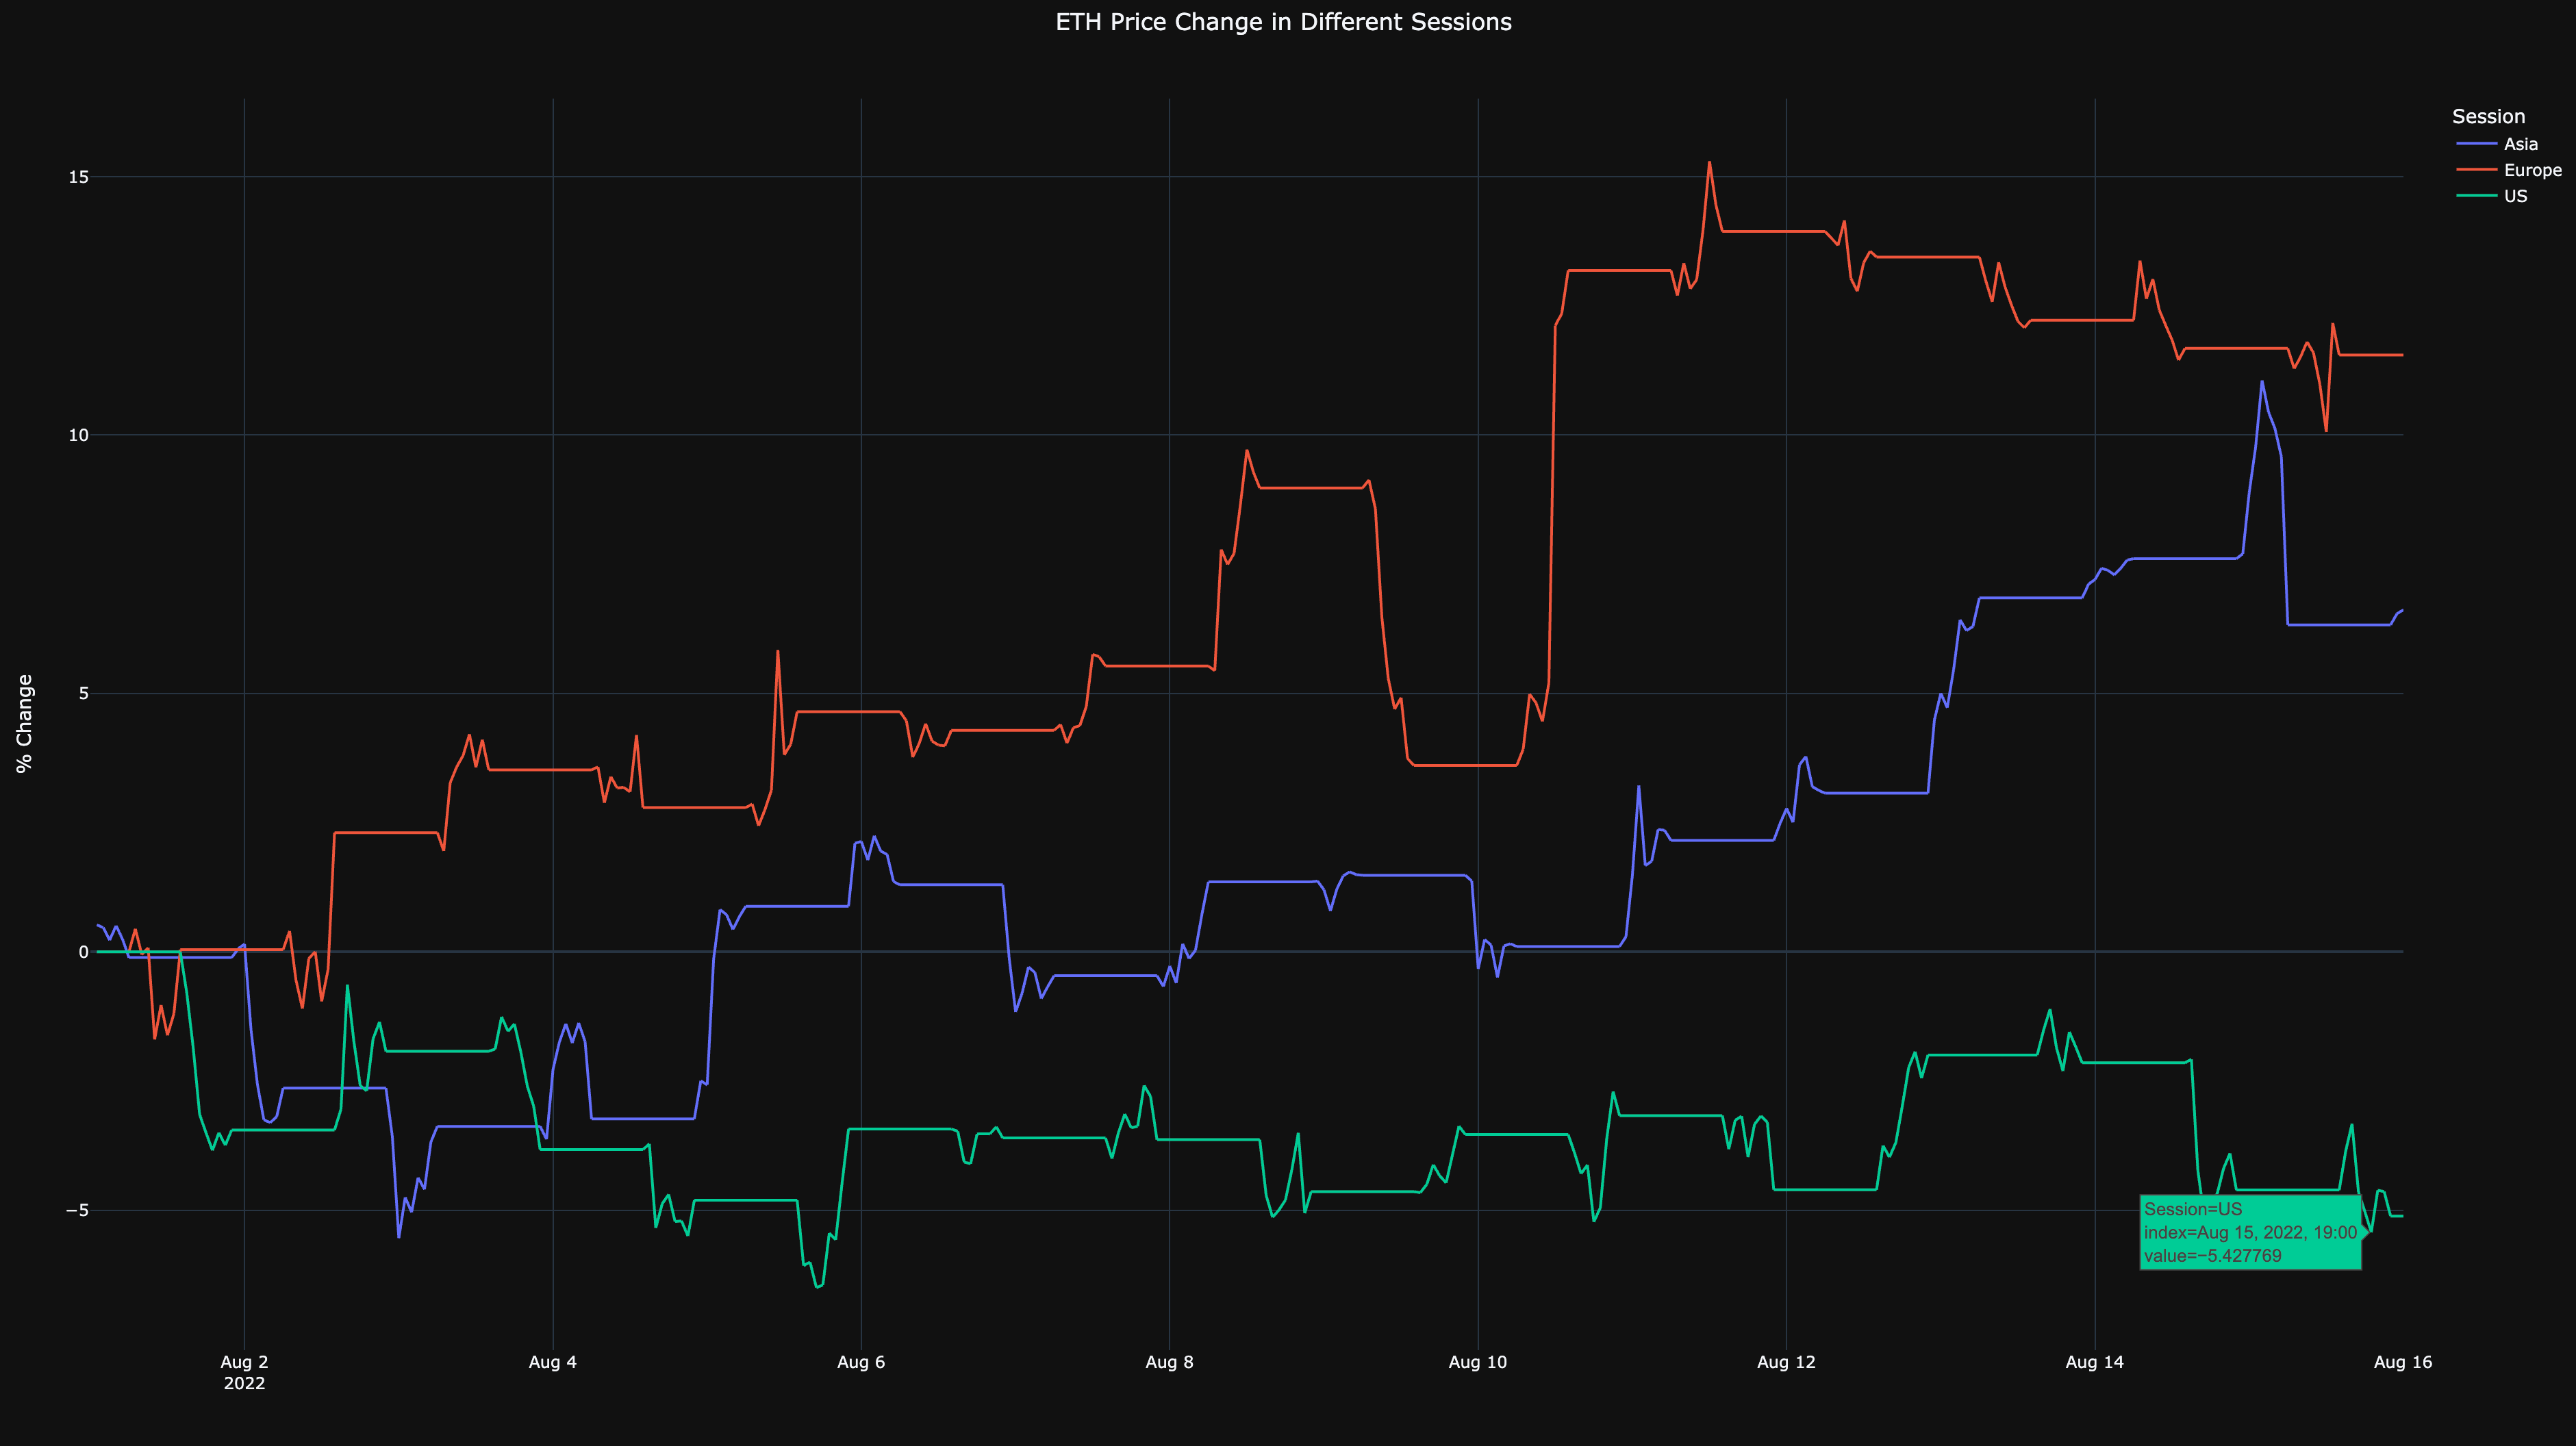
In both instances we can see Europe and Asia diverging from the New York session, but those moves are not translating to the overall current trend for BTC and ETH.
We also got some warning signs in our fair price risk score. It is a helpful tool to decide when things are starting to get a bit overextended.
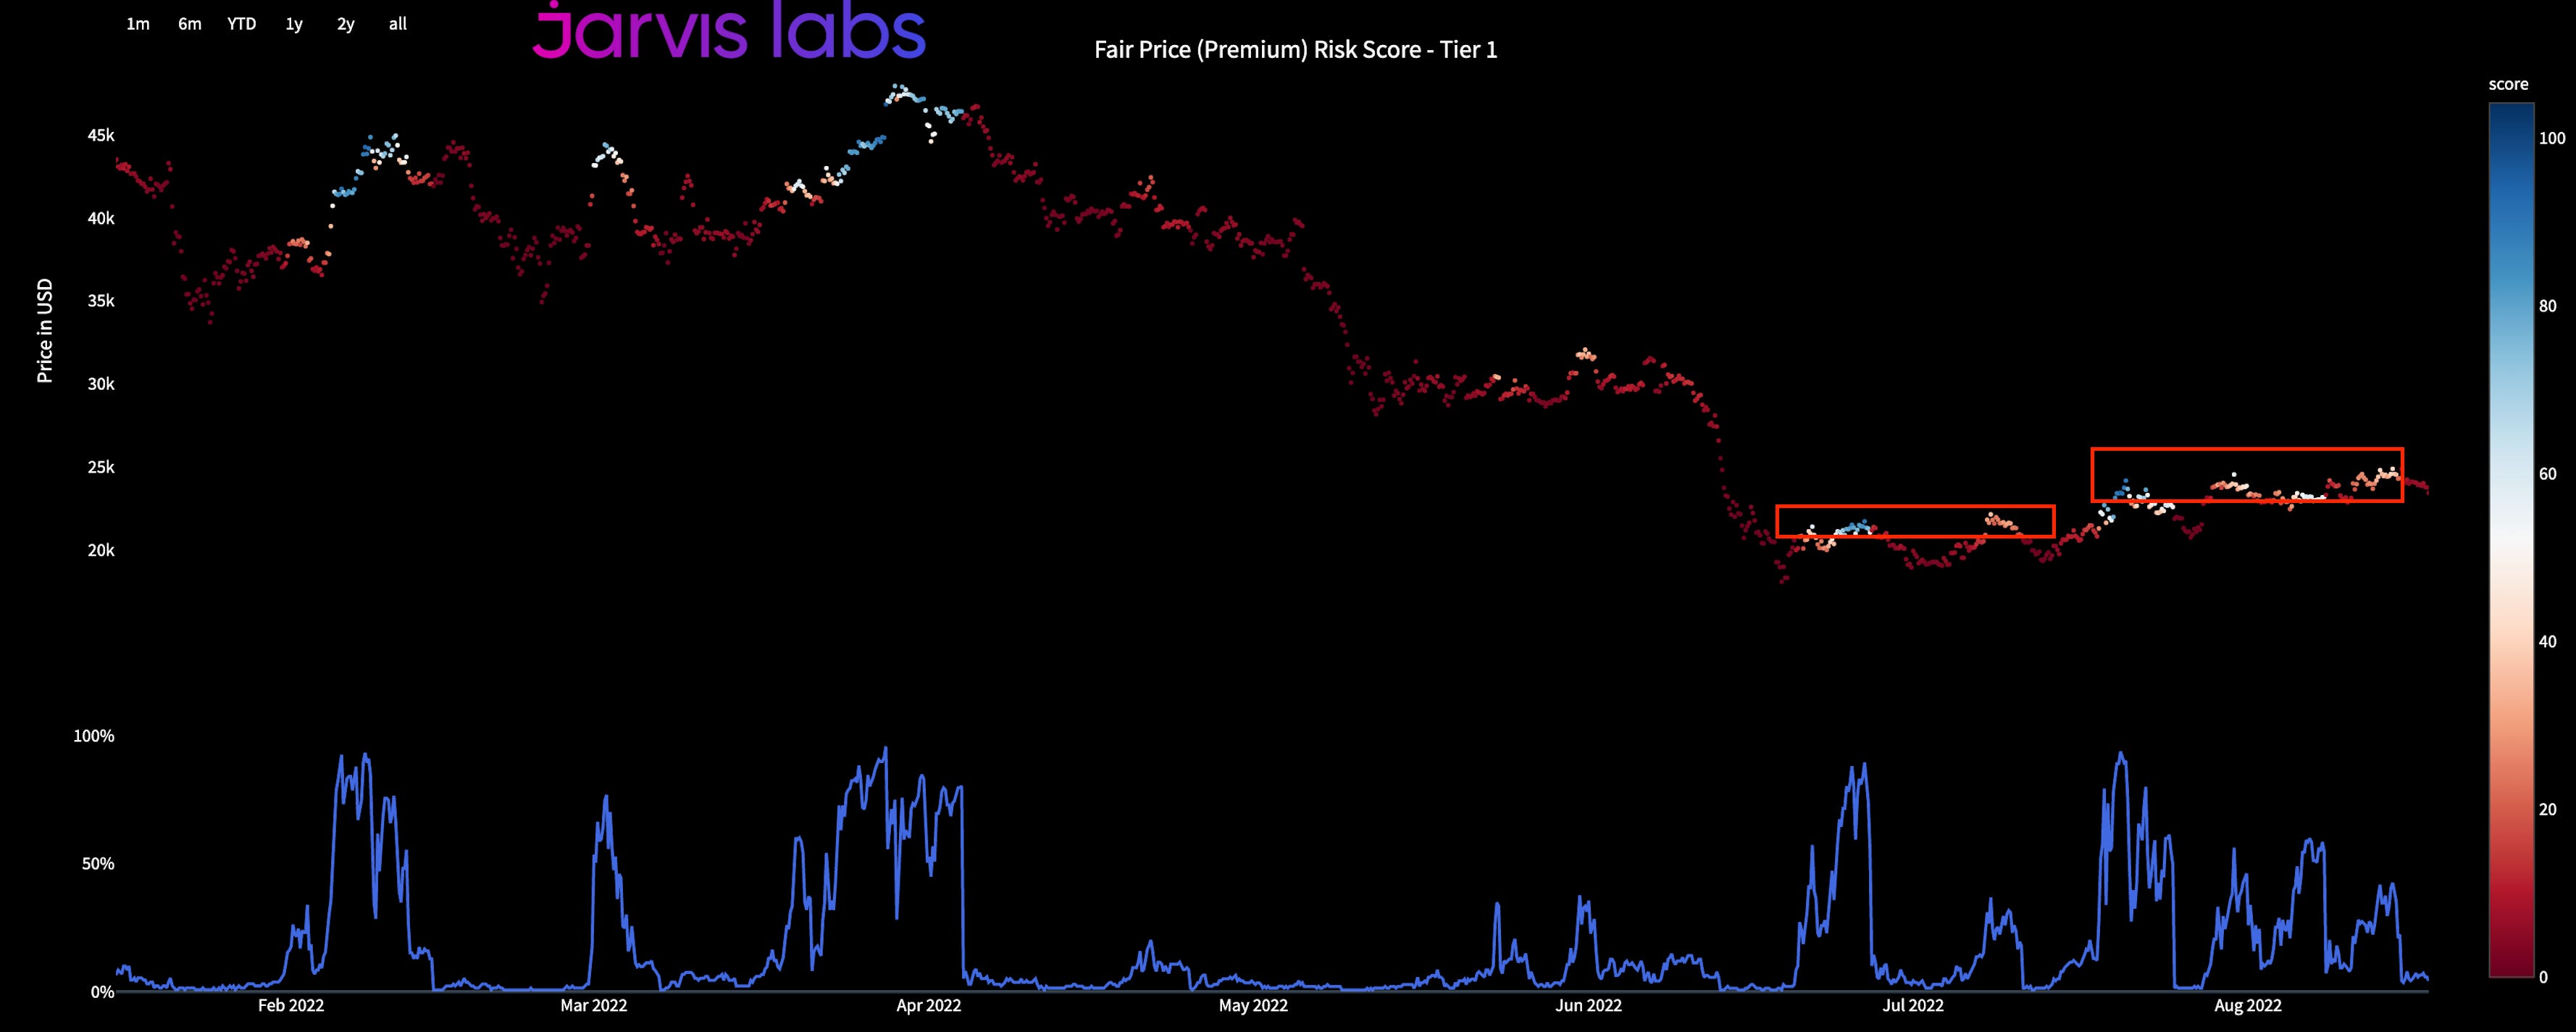
This fair price risk score when paired up with the fact whale buying had waned AND the NY session trending lower, meant the recent top is expected.
This is in part why we think the Jarvis AI autonomous trading system exited positions and went flat over the last several days. It now sits idling awaiting for a more favorable environment.
Speaking of moving forward, let’s chat about what to look for in the week to come.
The Outlook
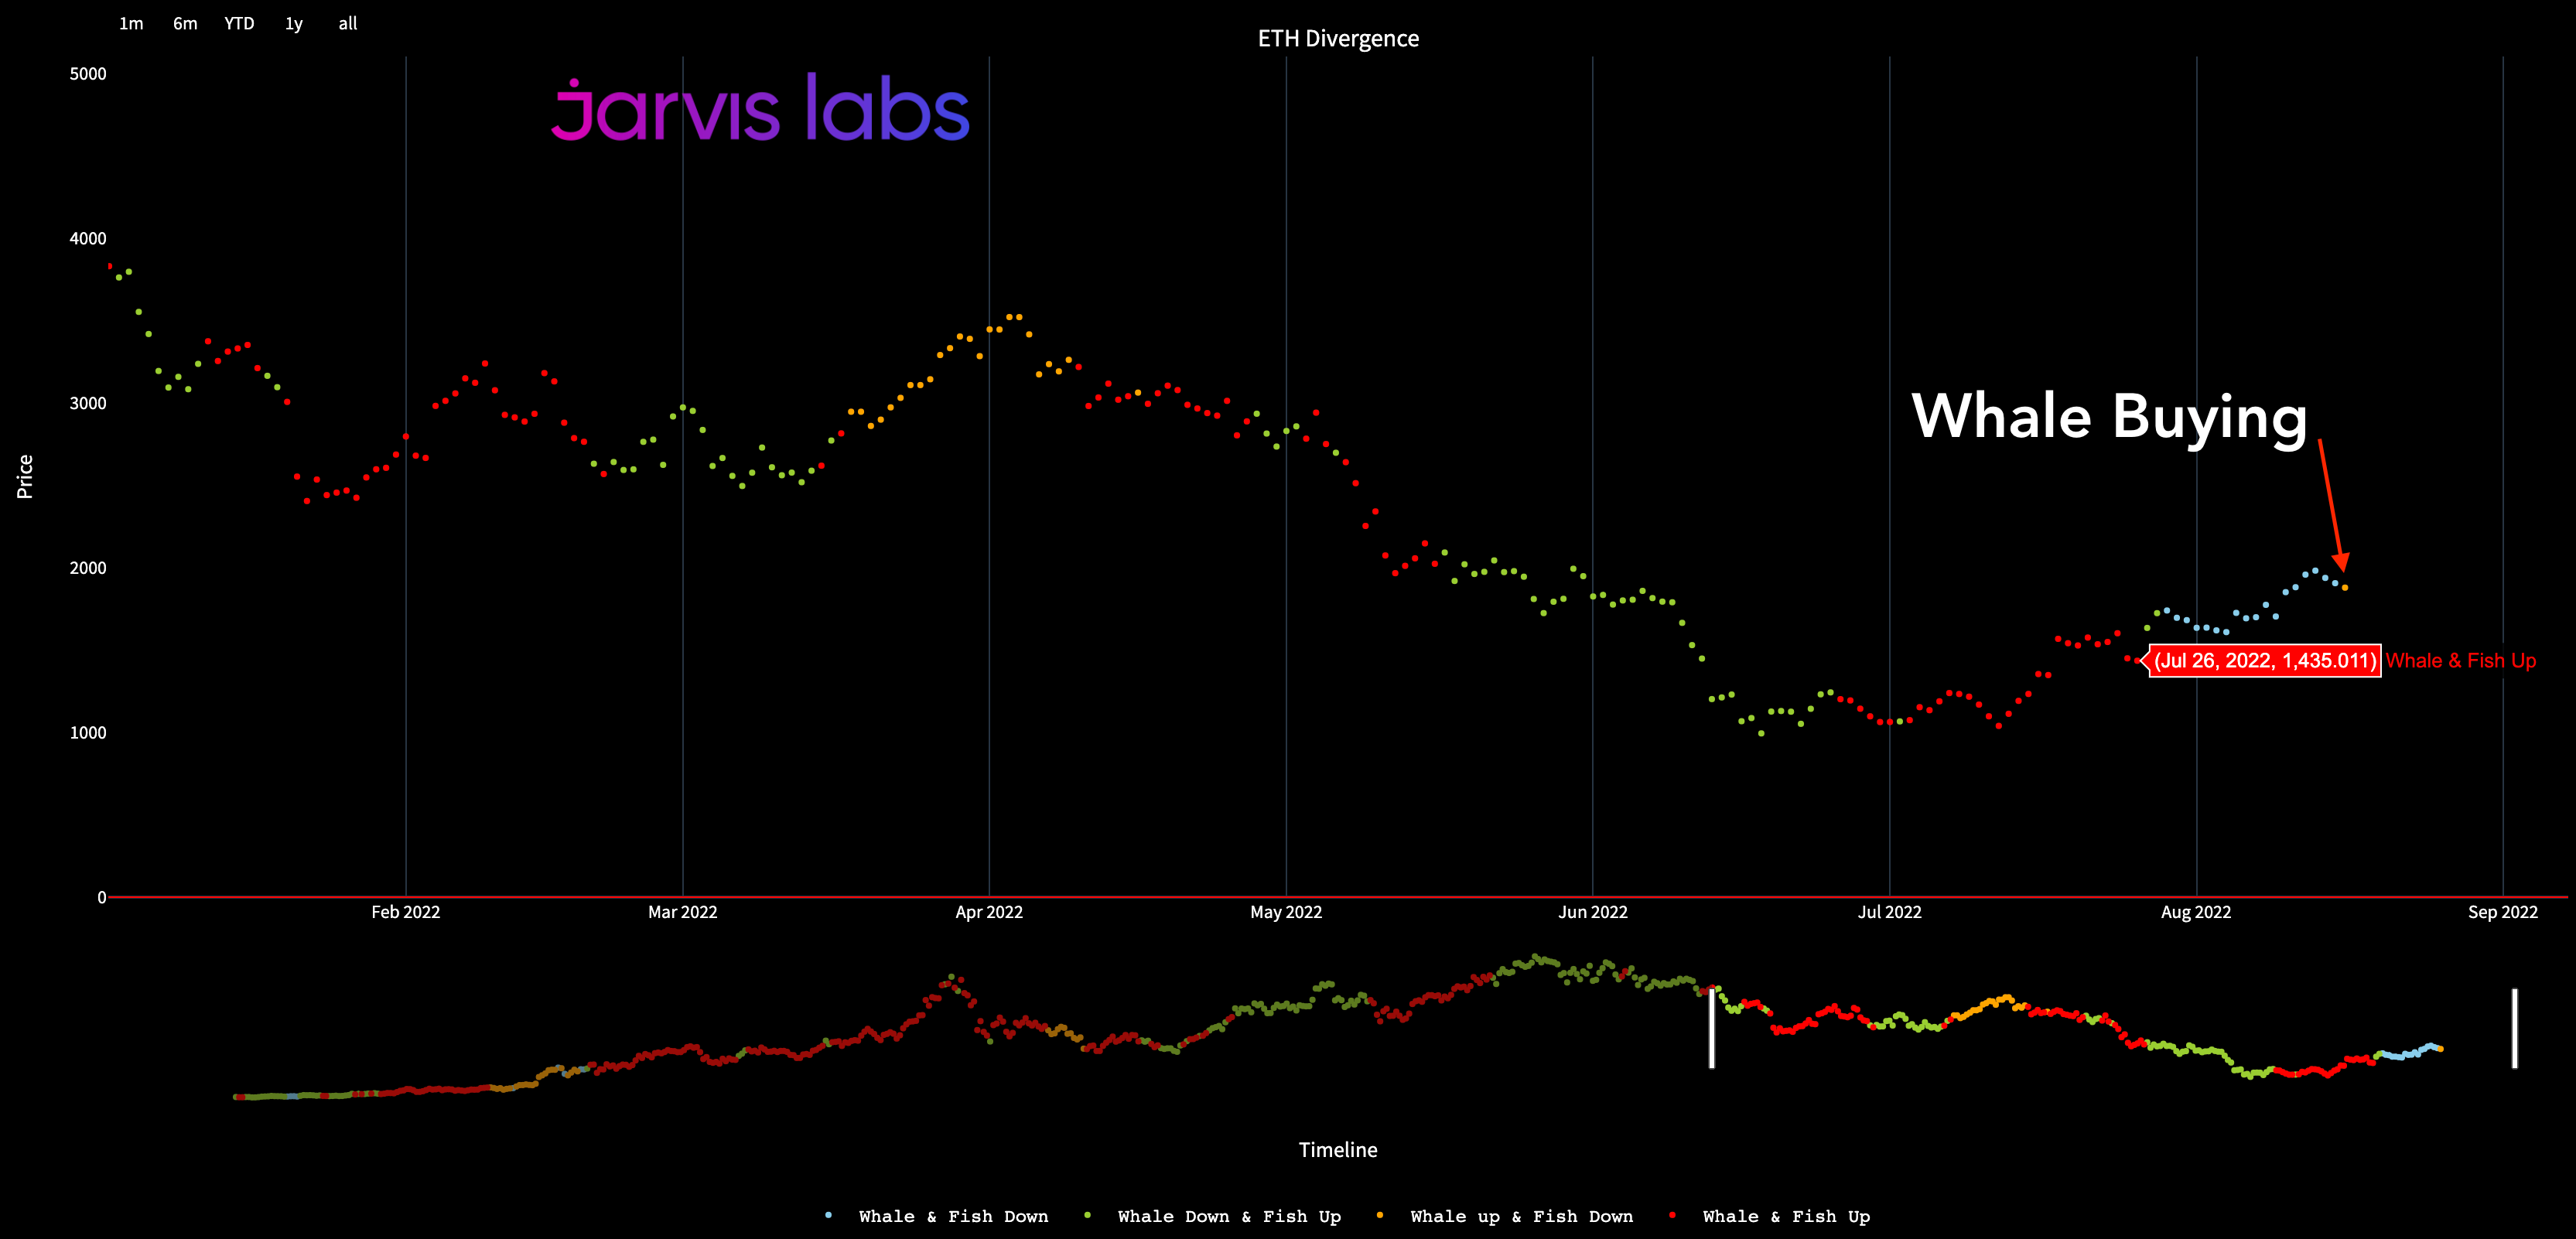
The ETH divergence chart tells us what whales and smaller wallets are doing. Red and orange dots translate to whale buying behavior, which is what we want to see.
As you see in the chart below, yesterday was the first day since July 26th that we saw whale buying in the market via an orange dot.
This is a positive development. To pile on this change, we see something similar surfacing for the change in ETH Whale Holdings. It has been trending up as of late. Which translates to whales accumulating once again.
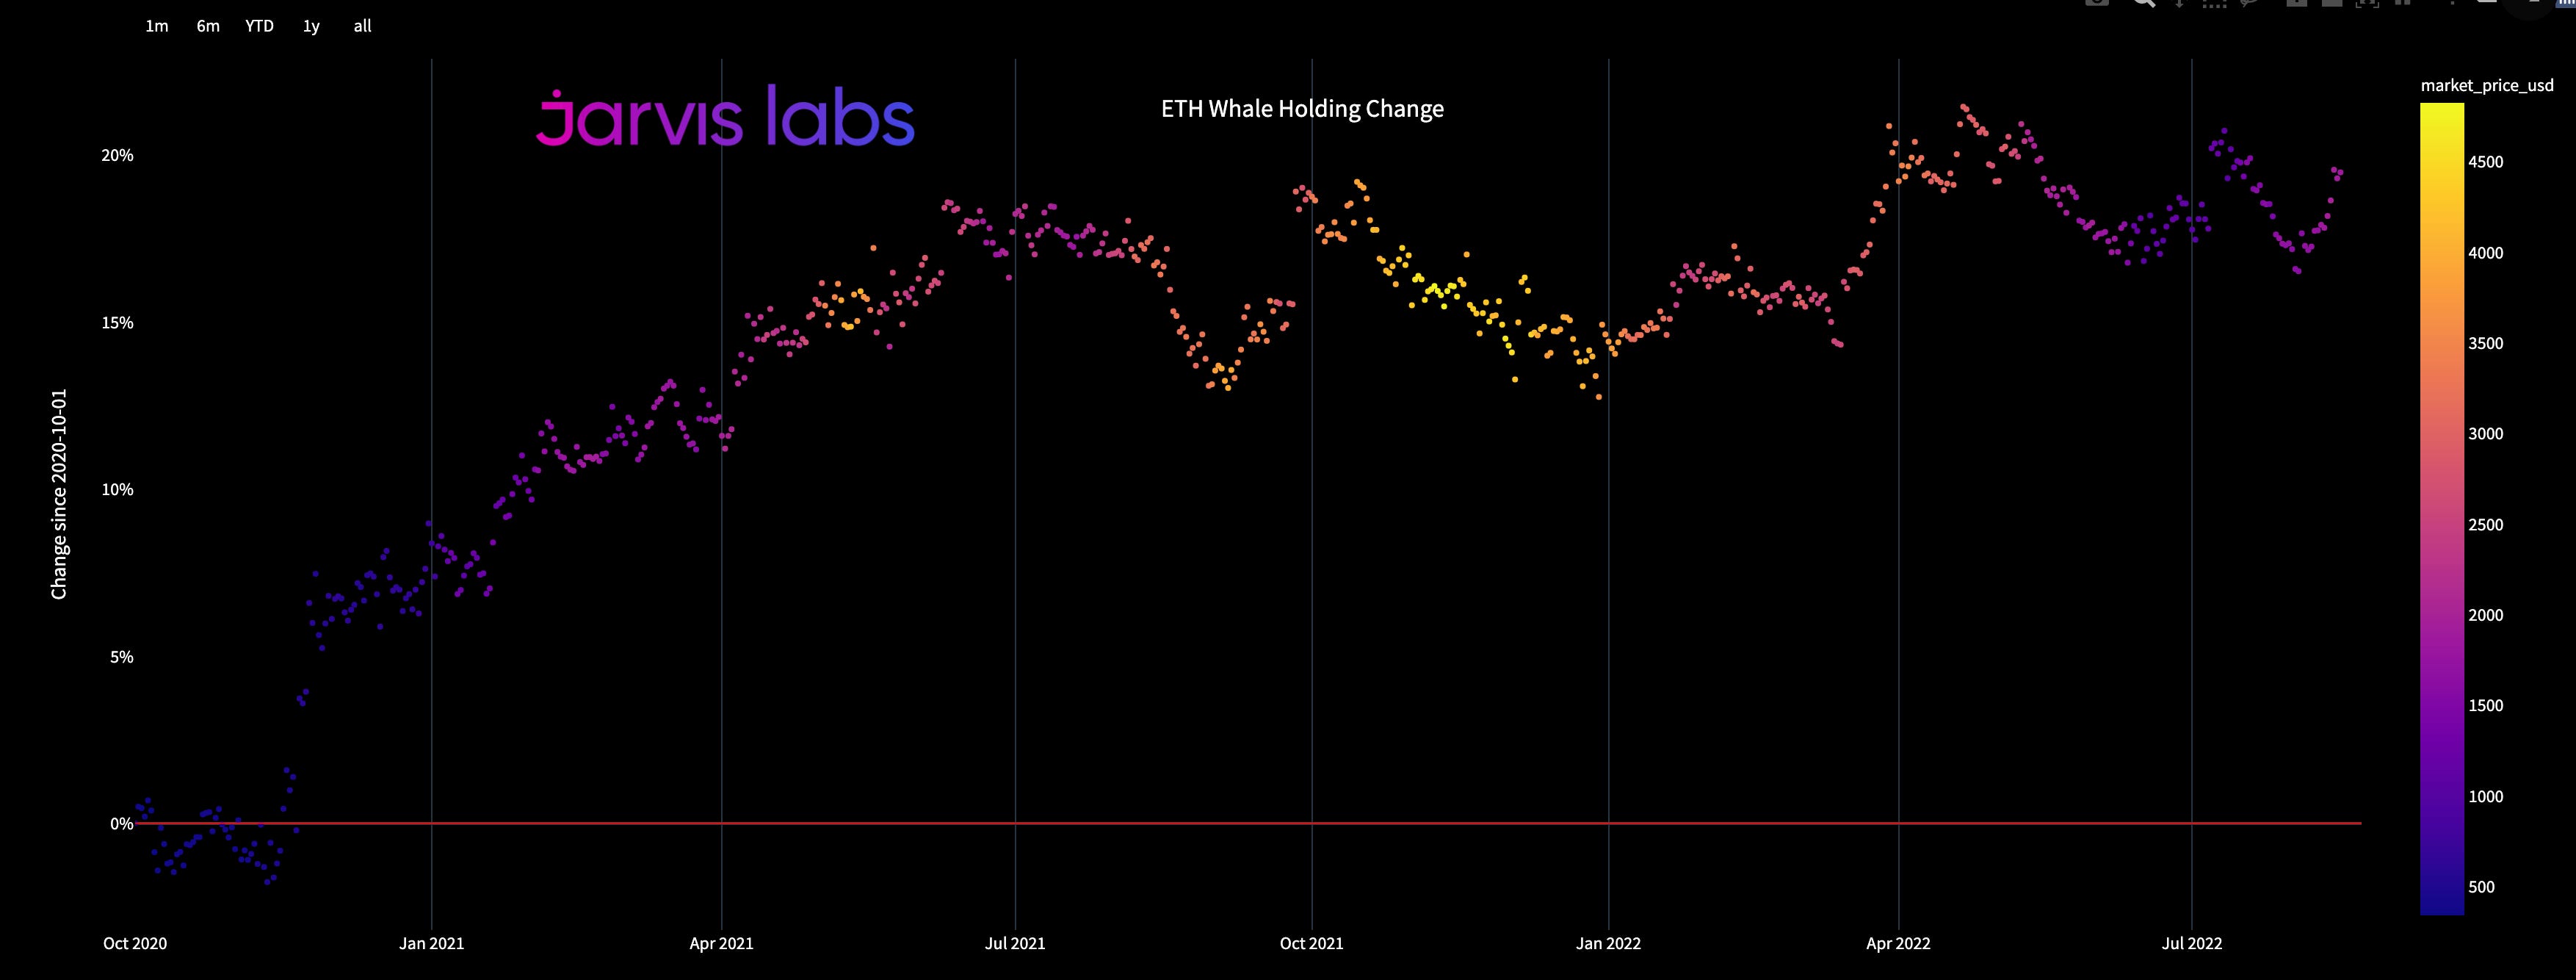
This is not a reason to get overly excited as both of these things take a bit of time to translate to price activity. If anything it suggests any strength we see on support levels in the week(s) to come will lead to continuation of the longer term upward trend.
The only piece of the puzzle we haven’t really seen surface is whale buying or accumulation trends for bitcoin. BTC is a bit lackluster. And that’s reason for some hesitation.
We believe this missing piece is likely to do with the current trend higher not being one that leads to a retest of prior highs. If anything, it can be a multi-week to month trend that moves us to $2,100 to $3,500 for ETH and $35k to $48k for BTC.
Those are both lofty levels and wide ranges, which is why we need to keep paying attention to whale behaviors, onchain activity, and the New York session for now.
Bringing the focus back to the near term, we can look to the downside to see what to pay attention during the softness we are currently witnessing.
In the chart below we have liquidity pools. These are helpful in determining where price might trend towards and ultimately reverse.
This was handy last week as price tapped the first pool of liquidity and began to reverse. Here was the tweet in case you missed it. Price respected those levels well.
Whoever is reading Unknown Unknowns right now... This might pair well with what you read as the testnet merge unfolds.
— Ben Lilly (@MrBenLilly) 2:04 AM ∙ Aug 11, 2022
In the chart below you can more easily see this tap of liquidity to the upside at $2,000 before priced began to reverse.
Now the attention moves towards the pools of liquidity to the downside, which sit near $1,620 price level.
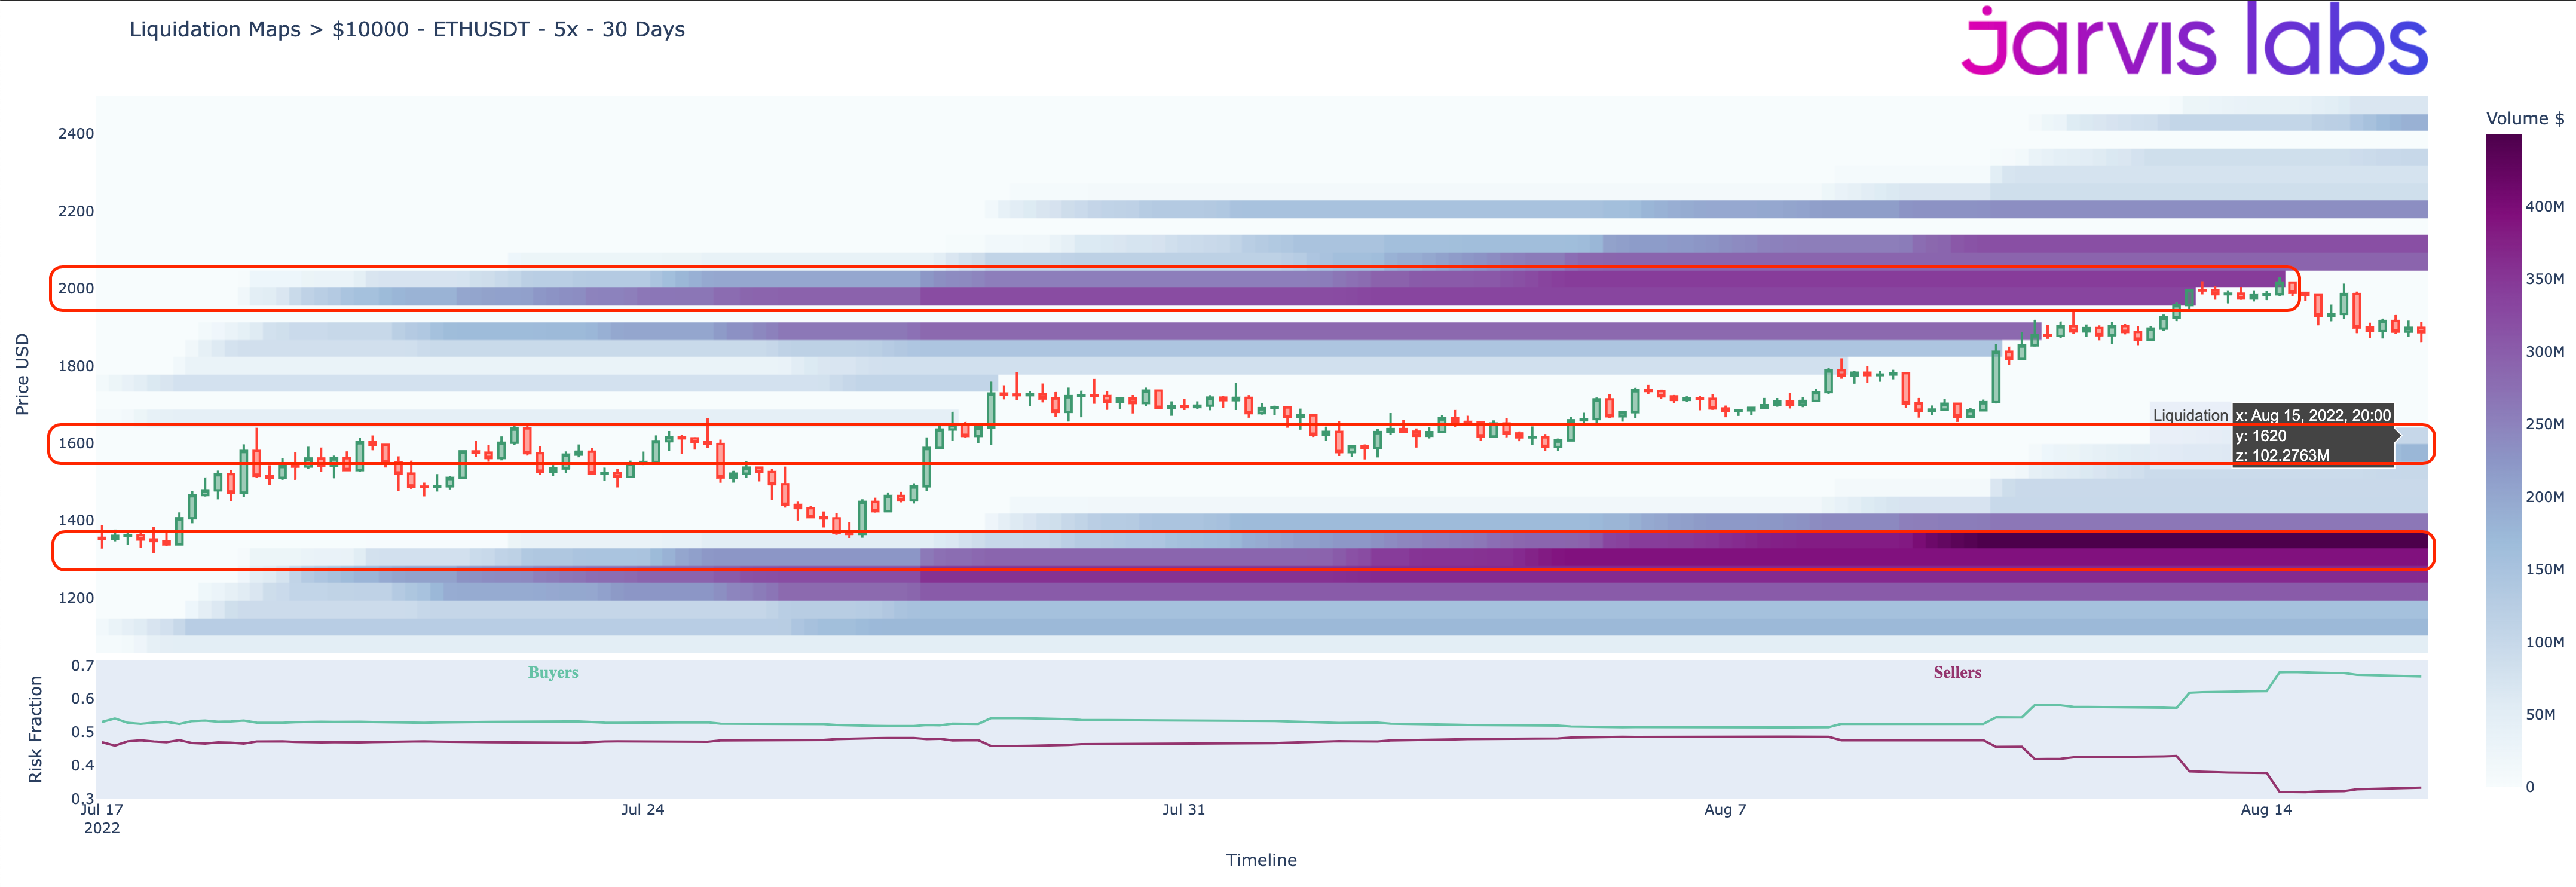
If we were to see that type of price level OR price to begin reversing before reaching these pools, that would signal strength that the longer term upward trend is still progressing well.
If we pair that up with the whale buying mentioned earlier - as long as it sustains - than any strength is likely to continue. If we dive deep into sub $1,400 levels then we would need to reassess things.
Continuing to look forward, any positive news from the major economic event that is unfolding in about a week - Jackson Hole - will likely lead to more positive New York trading sessions. And as we saw two weeks ago, New York is the trend setter.
Which is why if we get bullishness on the heels of Jackson Hole, then the upward price trend that unfolds might mean a potential firestorm is coming…
The Boil Over
The derivative markets for Ethereum is realizing outsized attention.
In the chart below we see the outsized amount of call options unfolding between $2,000 to $4,000.
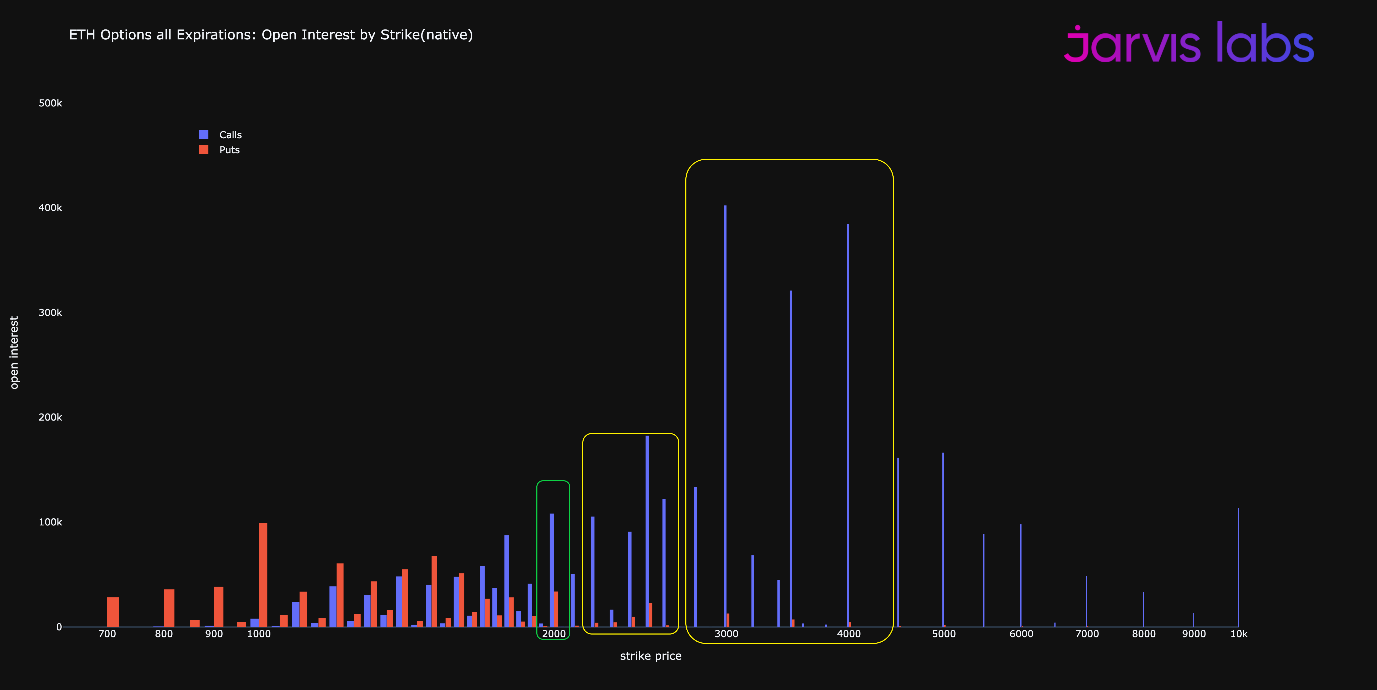
When we pair up the options market to the total open interest in futures, which has doubled from about $4bn to $8bn in the last month, we see significant leverage building.
Now, there are various amounts of what we term negative gamma involved in the image above, which is another way for talking about how markets could become highly volatile. But trying to decipher it is rather complex. That’s because retail is a bit absent of late, and so many trades of late are more sophisticated in nature.
So this makes it hard to figure out how market makers or trade desks have hedged positions over time.
One interesting tidbit I read yesterday was from Arthur Hayes, who pointed out many of the dealers are happy to get out of their long OTM call options by quoting favorable prices. This was likely a result of trade desks selling volatility, which was absorbed by market makers. And if anything, this is signaling a bit of a shift in market structure… One that needs time to unfold.
But with Jackson Hole and The Merge on the horizon, this shift might not happen fast enough. And with the options market and futures market displaying impressive open interest, the ability for market participants to be caught offsides is greater.
This is why if price does start to act like a frozen turkey being submerged in boiling water, don’t get too caught up in the fire ball. Remember… book profits.
A lot of the activity will be driven from derivative markets, and often times this is more indicative of a month-to-month trend instead of a major cyclical year long trend.
So for now, let’s remain observant and see how the current softness in the market progresses.
If you haven’t already subscribed, please take the time to drop your email in the subscribe box below. This way you will receive insights as they get sent from the team at Jarvis Labs.
Until next time…
Your Pulse on Crypto,
Ben Lilly


