Standing Alongside Giants
The Blue "buy" Dot is Near


We gain a better perspective by standing on the shoulder of giants.
From there, we see further than what we knew was possible.
But when it comes to crypto, those giants are still among us. You won’t find them written in historical texts found at a neighborhood library.
They are found spilling ink right alongside us on Twitter and Medium. Which means we are literally exploring the unknowns with modern day giants.
One of those giants is Charles Edwards. He’s an on-chain analyst and creator of a well publicized indicator called Hash Ribbons.
Today I’d like to explain what this indicator is and why you should be aware of what it’s getting ready to flash.
The Indicator
Nearly 20 months ago Charles wrote a post on his Hash Ribbons indicator. You can find it here.
In a nutshell its similar to using multiple moving averages for price and waiting for them to crossover to generate a buy or sell signal.
For price these crosses are referred to as golden and death crosses.
Charles borrowed from this approach and applied it to bitcoin’s hash rate.
Hash rate is a measurement based on the blocks miners create each day.
This tends to be dependent on bitcoin’s mining difficulty, which is a measurement for how challenging the ‘problem’ being solved by miners to mine the current block. It’s adjusted about every two weeks.
These are both unique. But what’s interesting is the difficulty tends to act as a lag on hash rate. Meaning hash rate is the measurement to follow.
This is why Charles used it to create his indicator, and it uses a simple one and two month moving average of the hash rate.
And it’s how hash rate can be used to find very profitable buying opportunities.
When these two moving averages cross it signals an opportunity that operates on the order of months to years.
Based on its track record, it would be wise to take note.
And when applied with a 10d and 20d moving average on price, we get an even more powerful indicator.
When the two crossovers are bullish, we get a “buy” reading on the indicator we’ll show you next.
Only a Week or Two Away
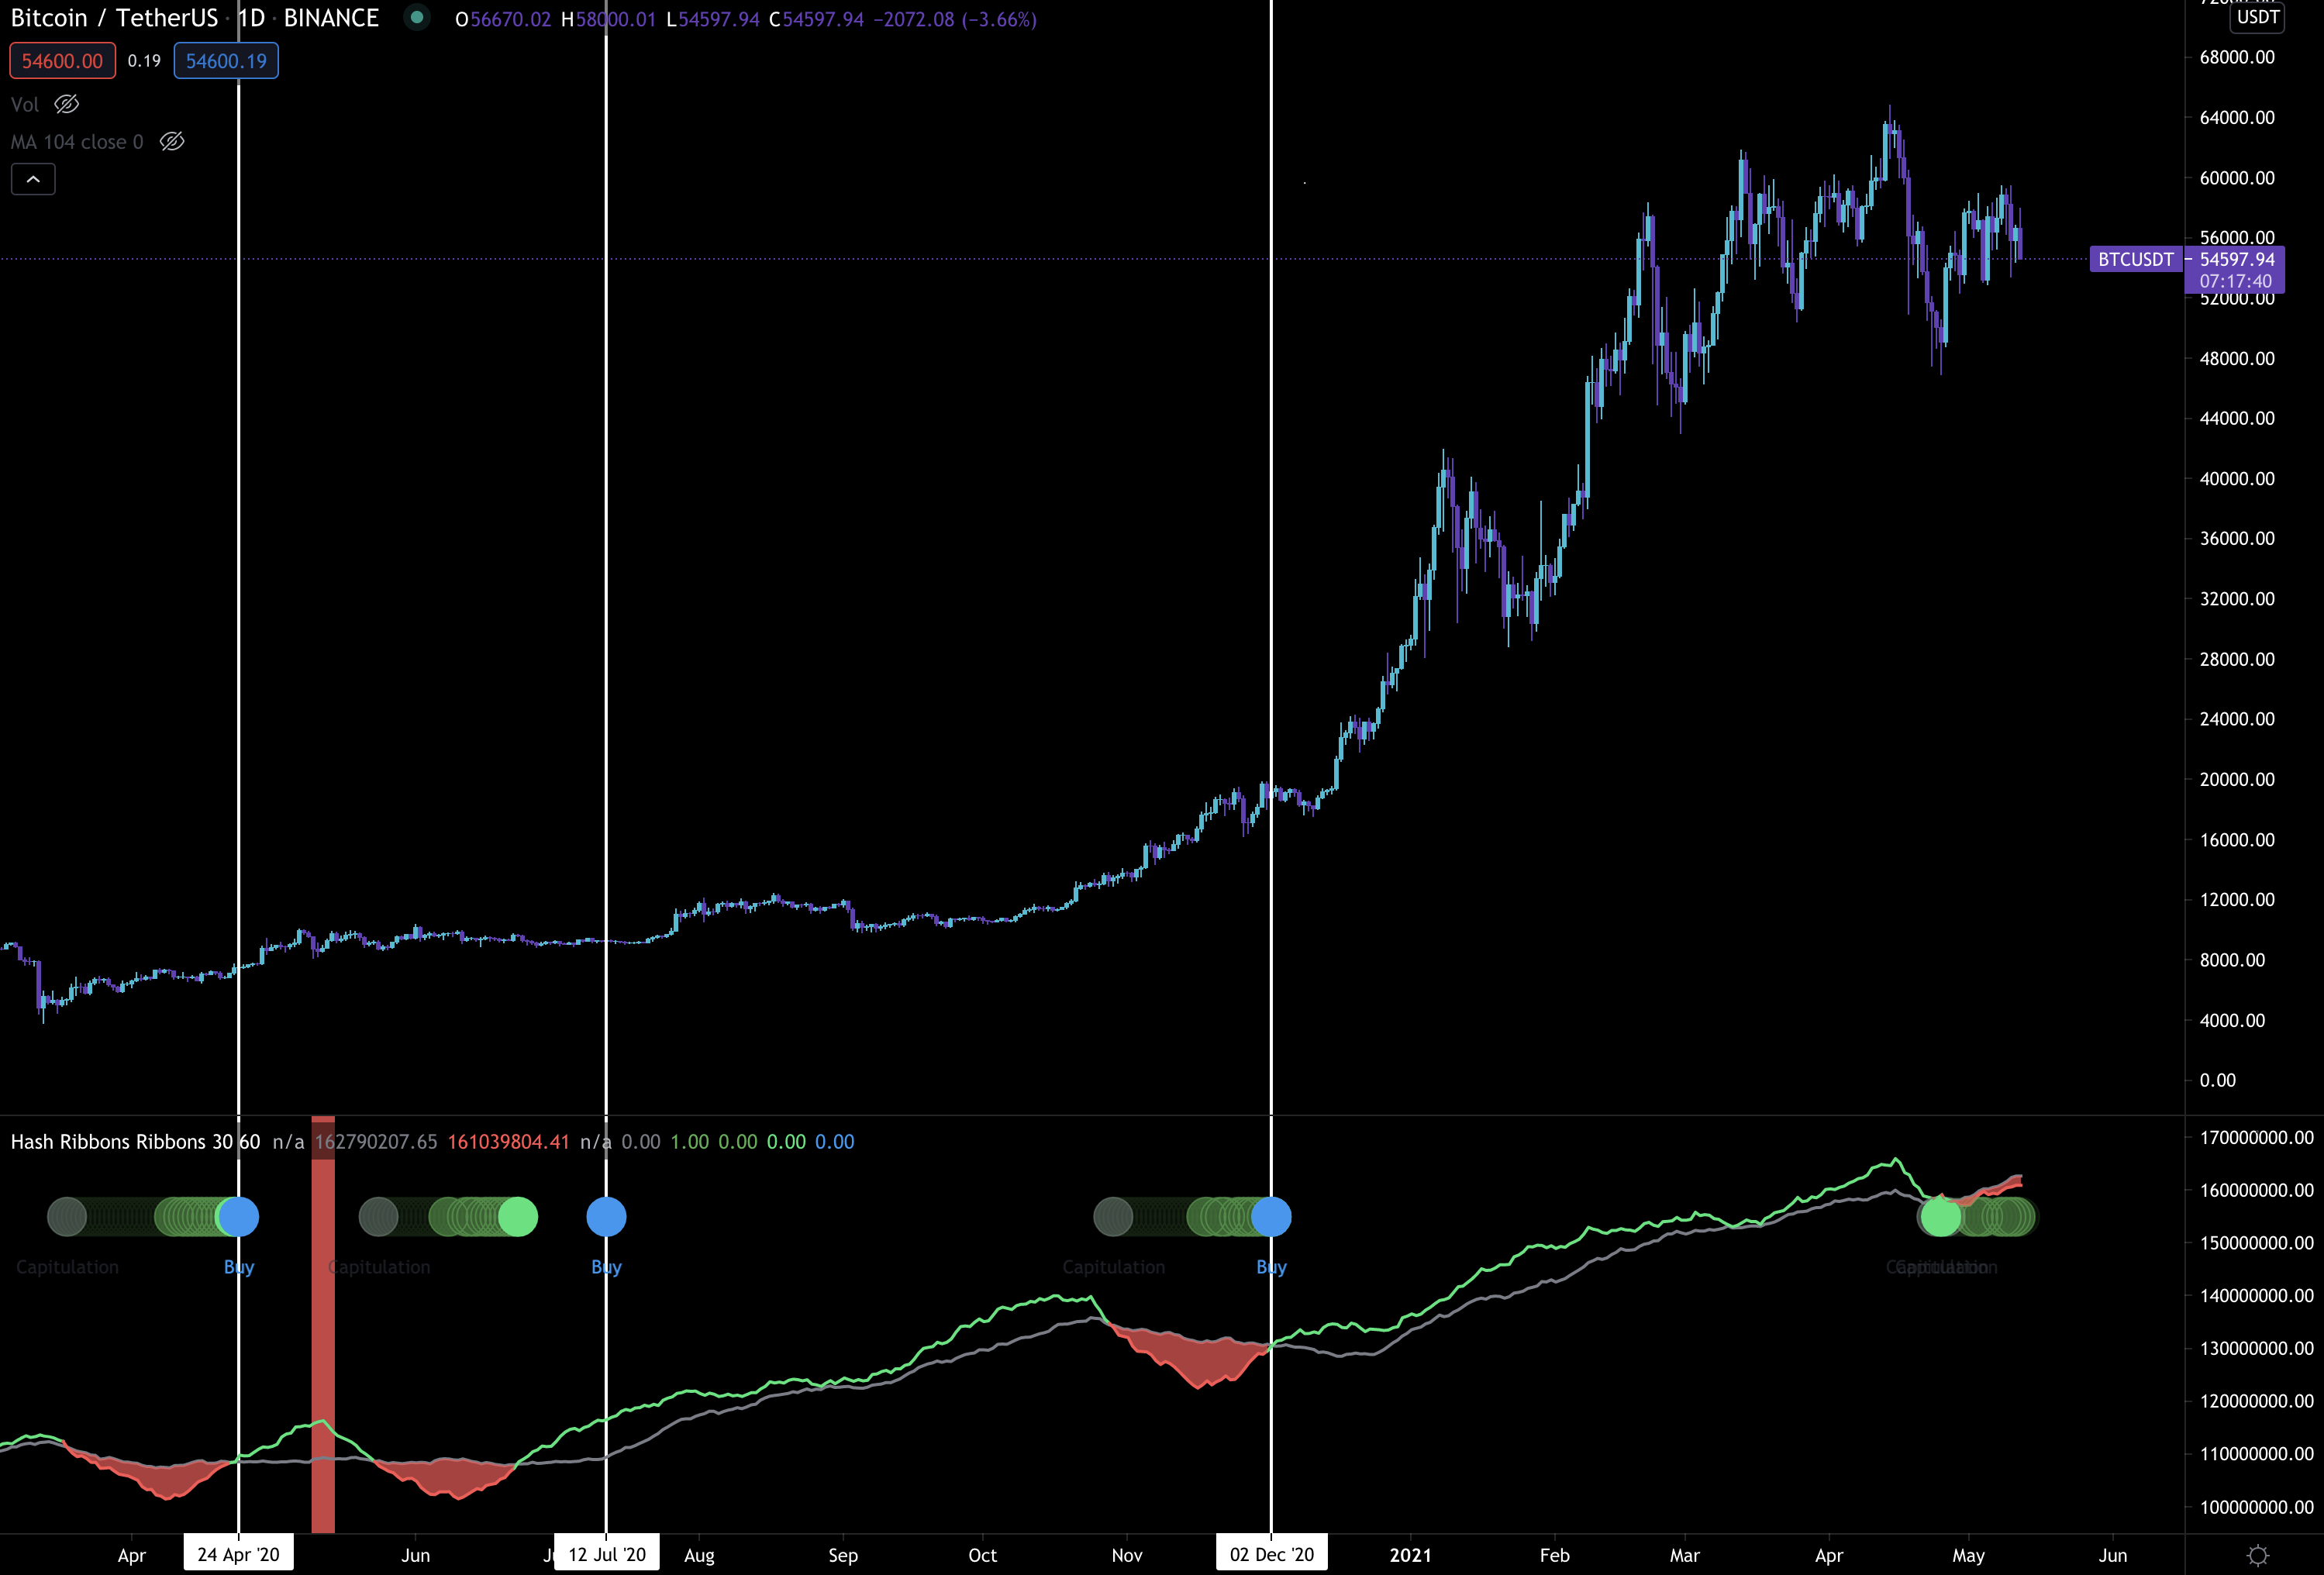
Looking at the Hash Ribbon indicator on the bottom half of the chart below we see the two moving averages tied to hash rate are about to cross.
The cross over, when paired up with the cross over in price moving average (10d and 20d), creates a buying opportunity on the indicator.
Right now the 10d moving average of price is above the 20d moving average. Meaning when the hash rate moving averages cross, the blue “buy” dot will print.
Now, we’ve been writing about how we expect this bull market to create higher prices in the coming months. When it does price will unfold with more velocity and create more euphoria than what we saw December.
The space will get nuts.
And we’ll be here to constantly keep your reality in check. For now, its all about being prepared.
Yesterday we published a list of projects that are fairly priced based upon our fair price scanner. Check it out here if you missed it.
Also, the market is still turbulent. We saw some bearish transactions take place on-chain earlier (another 2k by Pablo just after midnight on 12 May 2021 New York City time). This remains consistent with what we said yesterday… “We are still in a shit storm”.
Luckily the space has plenty of liquidity to absorb this bearishness.
What this means is focus on averaging in over time, no need to buy it all in one go.
For futures traders, it’s still not the time. There’s nothing clear cut in terms of when momentum will come… But Hash Ribbons is a good hint as miner capitulation tends to only happen once or twice a year. And its why we bring it to your attention today.
In the words of Charles, “Next time you see the Hash Ribbon buy signal, you would be wise to pay attention.”
Your Pulse on Crypto,
Ben Lilly
P.S. - You can find the indicator here.


