Prepare for an Eruption of Bitcoin Volatility
Notes From the Lab: Bitcoin Isn't Playing by Last Year's Rules Anymore


Hey guys, JJ here.
I wish that I had something clever to say to get your mind prepped for this week’s breakdown, but the honest truth is my brain is fried from actively trading and following this chaos closely over the past week.
I’m guessing you’re all as equally exhausted as I am, so without further ado – let’s just dive straight into the charts today for a change, shall we?
Crazy Game of Poker
Last time we talked, we were attempting to figure out who was bluffing – Bitcoin (BTC) or the dollar.
One was poised to win the hand and shoot higher, while the other would fold and collapse. But we weren’t sure which would win or lose.
And while we still don’t have 100% certainty as of yet – and there are still the unknowns of next week's FOMC and March’s quarterly close – there are signs beginning to emerge which are hinting at the hands each side is holding.
Let’s review:
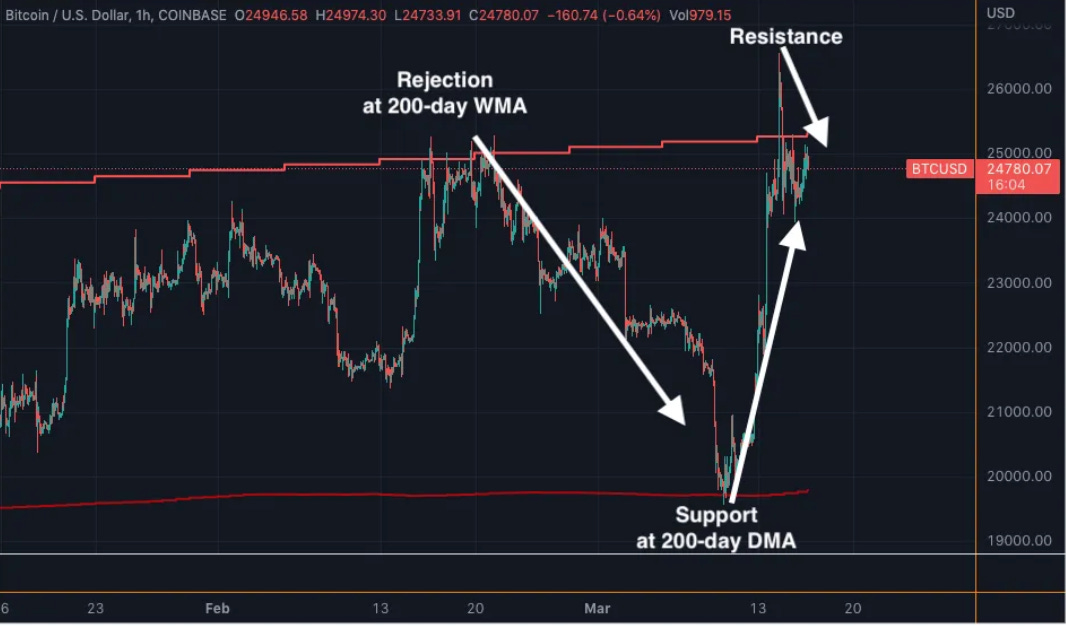
On the chart below, we see the chaos that was BTC in early March visualized, with a few crucial landmarks that will help us spot our current place on the map.
We see that when BTC had its final surge in February, it rejected directly at its 200-day weekly moving average (WMA, light red line at the top).
That rejection sent it tumbling downward into the beginning of March.
That downtrend crescendoed with last week’s crash, which sent it directly into the support at its 200-day daily moving average (DMA, dark red line at the bottom).
From there, it bounced as if it landed on Mr. Ben Lilly’s childhood trampoline, sending us directly back to the 200-day WMA in a practically straight line, where it was rejected once again.
Bitcoin ping-pong.
So far, last week’s crash appears to have been the market calling Bitcoin’s bluff on its early 2023 pump, thinking it didn’t have the cards to back it up.
The strength of support that arrived in that range, however, showed that it was holding the “nut straight” – just like Matt Damon in Rounders.
Reason being is, there were multiple factors from a technical standpoint that underscore the importance of BTC passing that retest.
The first is the obvious: The ~$19,700 range Bitcoin bottomed at last week represents its 200-day DMA, a crucial line in the sand for determining the trend.
The fact that it was tested and held might just confirm the thesis we’ve been sharing all year: This is the early stage of a new bull market rally, not the late stages of a bear market rally.
The second technical factor is that the $19,700 level also represents Bitcoin’s 2017 high. Price retesting that exact level and bouncing underscores how crucial psychologically that number is, as many sidelined participants evidently found it a perfect spot for entry.
And finally, it lined up precisely with the ideal scenario for a pull-back we outlined back in January while describing The Big Bear Squeeze:
Sooner or later, prices will reach a point where they become too elevated, and that will lead to a liquidation cascade of the long open interest which has chased the pump in recent weeks.
This could come soon while BTC is still in the $23,000 price range, or it might come later after a visit closer to $30,000.
It’s hard to say with certainty, but ideally, this future liquidation cascade will send prices crashing directly into major support levels, such as the 200-day moving average…which is currently at $19,618 and rising.
If it does, what we’d hope to see then is spot BTC buying power defend these levels, while more “ambulance chasing” shorts enter positions while price is at spot support.
That’s because at the same time the key 200-day DMA level was hit, a massive influx of ambulance-chasing shorts once again piled into derivative positions at support, while spot buyers showed up to defend the level.
Below, we see how during the pandemonium of the weekend, shorts rushed into position, sending funding rates across the board deeply negative.
#Bitcoin shorts rekt once again, this would be my summary of 2023
— James V. Straten (@jimmyvs24) 12:59 PM ∙ Mar 14, 2023
Not again, bobo.
The power of confluence among all these factors evidently enticed a lot of capital that had missed out on January-February’s rally to enter. After all, from a risk-reward standpoint, for longs it was as good of an entry point imaginable.
A fat pitch, if you will.
And swing they did. The end result was a beautifully executed BTC rip to new year-to-date highs.
All the while, the centralized world of traditional banking was having its “Emperor's Clothes” moment.
Heroic timing that could someday be written about in economic textbooks.
But short-term victories aside, Bitcoin will still need to reclaim and hold its 200-day WMA currently at ~$25,350.
When and if it does, however, there’ll be no overhead resistance for BTC for the first time since 2021.
BTC still rejecting off its weekly 200-day MA
— JJ the Janitor (@JLabsJanitor) 8:39 PM ∙ Mar 14, 2023
Be cautious until fully reclaimed, but when/if it does there'll nothing but fresh Wyoming air up above
A quarterly close above that line, and BTC might just begin the bull run of our wildest dreams.
Which brings me to my next chart.
Ride the Lightning
If you follow me on Twitter, you may have caught me posting about this chart a couple of times over the past week, as alpha tends to leak there first.
Volatility ⚠️ 🚨
— JJ the Janitor (@JLabsJanitor) 8:42 PM ∙ Mar 8, 2023
After quarterly options expire this month I would expect this index to double if not triple + by the end of spring
What it shows is Bitcoin’s historical volatility index, which measures the range of Bitcoin’s price movements over time. The higher the score, the more volatile Bitcoin is, and vice versa.
As you’ll see, since this index launched in early 2017, typically BTC stays in the 50-100 range, with occasional wicks up and down before recovering rather quickly.
Last summer, however, this changed in a drastic way.
Following the initial wave of volatility brought on by the collapse of exchanges like Celsius and BlockFi, Bitcoin’s volatility score also collapsed to all-time lows and never recovered.
On August 1, the score plummeted from 80 to 25, and along with Bitcoin’s price has remained in a tightly compressed range ever since.
Talk about a beach ball underwater.
Not even the collapse of FTX or the early 2023 pump could push it back above 25.
Turns out the secret ingredient needed was a global banking crisis.
As we see below, Bitcoin’s volatility score (blue line) is breaking out of its 7-month range and just broke above its 200-day DMA (red line) at 26.13.
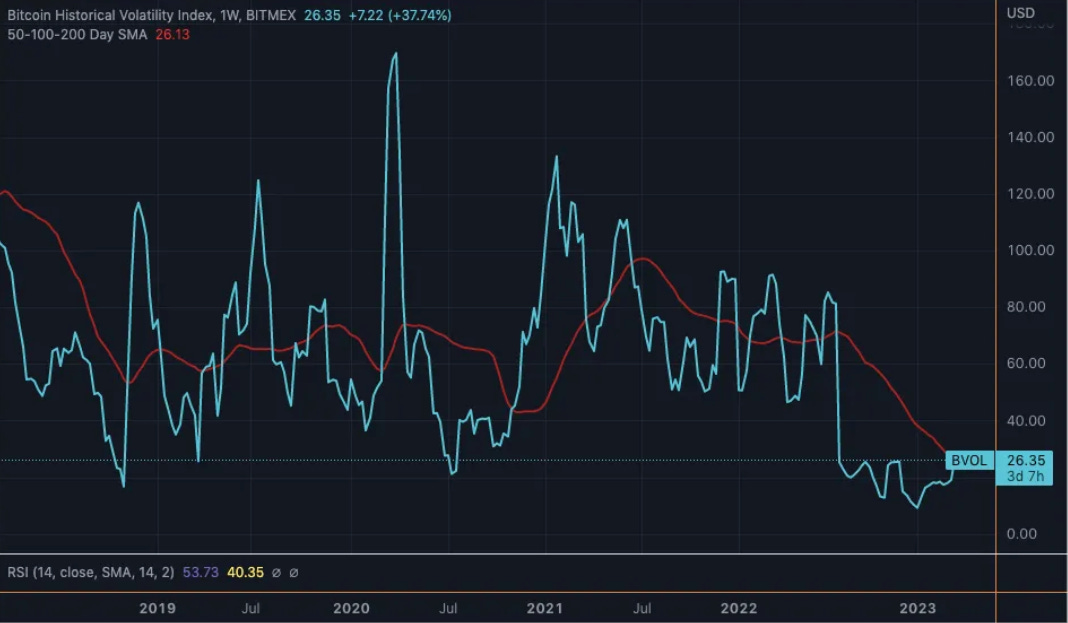
Should Bitcoin’s volatility score close the month above the 200-day daily MA, I believe it will mean-revert back to the 80-100 range rather quickly.
Equal and opposite reactions and all that jazz.
The fact is, this high-volatility breakout has been a long time coming.
The way that will translate to price is that in the very near future, we will no longer be in this $15,000-$25,000 range.
The moment of truth lies ahead. Now’s the time to place your bets and prepare to ride the lightning.
Thank you for reading Espresso. This post is public so feel free to share it.
For reference, here’s a chart showing what an expansion of compressed volatility and price (orange line) looks like from late 2020 into early 2021:
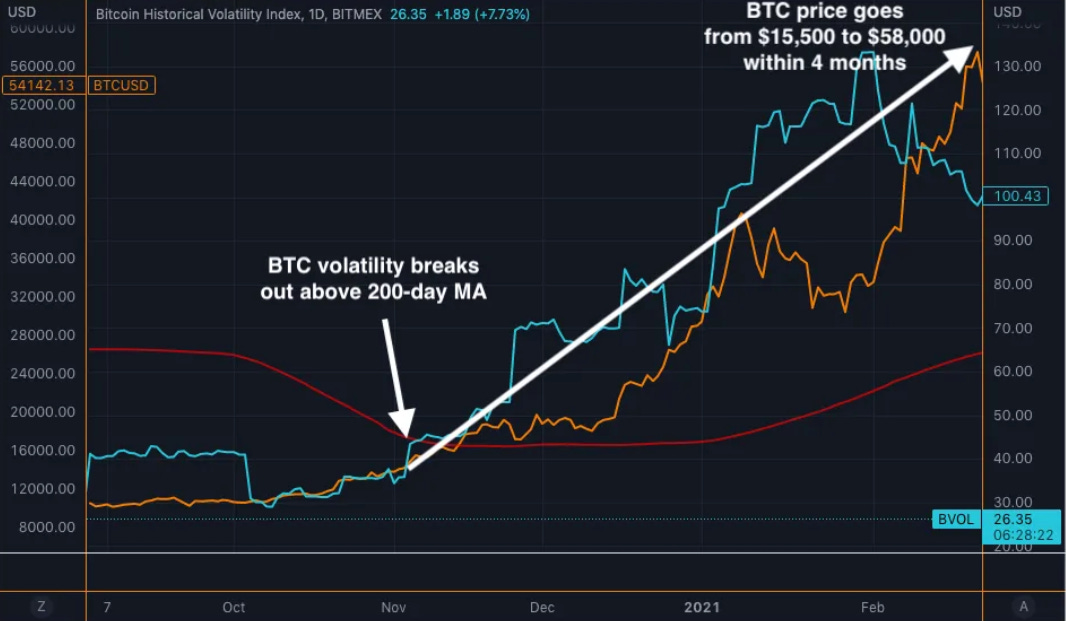
If this breaks out to the upside, we could see $40,000+ BTC by the summer.
But be aware, prices could just as easily crash to the downside if volatility picks up.
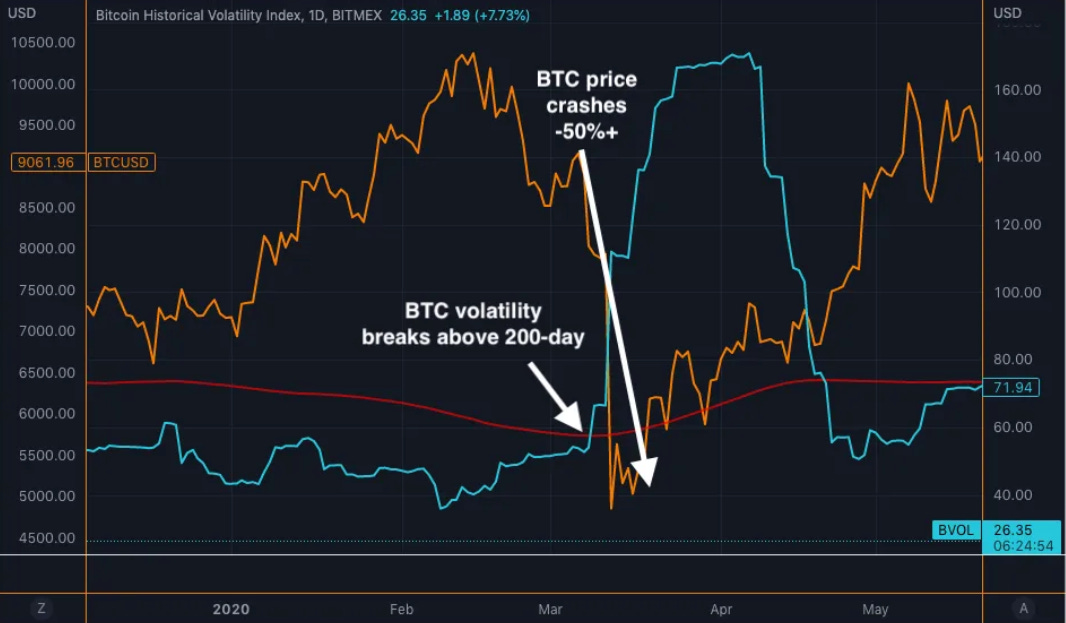
It’s not yet safe to rule out the possibility of a high-volatility black swan crash, such as the one from March 2020, which would likely result in sub-$10,000 BTC:
We could even have a wipeout crash followed by a full-throttle pump, or vice-versa, as we transition out of an abnormal regime of low volatility and back into Bitcoin’s natural state of high volatility.
Going forward, I would not expect any leveraged positions, short or long, to remain safe in the near future.
The swings will be wild and unlike anything we experienced in 2022.
That market and its accompanying narratives are dead and gone. Playing by those same rules in 2023 is a fool’s errand.
Consider the volatility we experienced in early March as a sample taste of what’s to come.
We find ourselves in a Brave New World now, one that BTC was uniquely designed for.
Your friend,


