Beach Ball Law
Notes from The Lab: An all-time high in Open Interest and Boyle's Law

It came down to me saying I’d give him $100.
This was last weekend at the pool. Me, my friend, and Orthis my pet duck were enjoying the summer heat by cooling off.
At some point in the afternoon my friend and I got into a disagreement about my beach ball. How we got to this, I’m not entirely sure anymore... But he was confident he could swim the ball down to the bottom of the deep end… Then release it so it shot out of the water.
He believed he could make the ball go at least a foot out of the water. I told him it didn’t matter because he wouldn’t be able to get the ball to the bottom in the first place.
Only reason I said this was because I knew the depth of the pool and how much air was in the ball. This is why I said he task was impossible. Either the ball doesn’t make it to the bottom, or it will simply deflate.
After some reasoning, he told me he would give me $100 if he couldn’t. But I would need to give him $100 if he could. I didn’t have $100 on me, so I didn’t really agree. But he persisted.
Sure enough, no matter how much effort he gave, the ball always shot right back up before getting to the bottom. He kept thinking if he just swam harder, he could do it.
After I rejected the money I told him about an old schoolmate from grade school named Boyle. He was allergic to lemons, which was ironic and tragic because he loved fresh squeezed lemonade… Which stuck in my brain for some reason and made the next part unforgettable.
Hundreds of years ago a scientist, Boyle (not my allergenic classmate) figured out objects carrying gas substances, like the air inside my beach ball, exert an upward force called buoyancy while underwater.
And the deeper the object went underwater, the more the pressure would decrease the volume of gas in the object. This is what causes objects to shrink, and eventually sink.
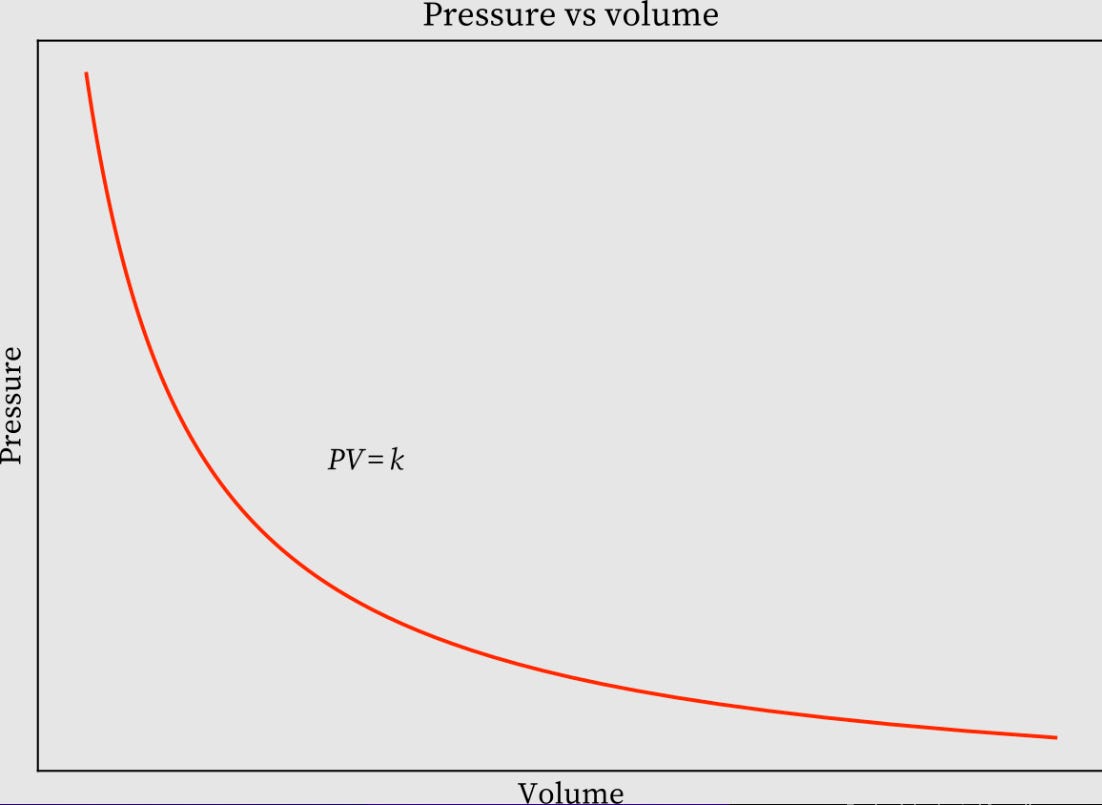
This is how I knew that eight feet was enough pressure to deflate the ball and lose buoyancy.
Now, the reason Boyle comes mind is thanks to a chart I found at The Lab this week.
Not only was Boyle’s Law a way I could prank my friend, but held the key to understanding what the chart was saying.
Ready to see it?
The Chart
The chart below was hanging up on the whiteboard after Mr. Benjamin’s morning meeting in the Quant Lab last week. I asked to make a copy so I could bring it home as nobody seemed to mind.
It shows the amount of trades open for Bitcoin’s (BTC) derivative contracts.
As I write this BTC’s market cap is currently ~$462 billion dollars (21m Bitcoins in existence x $22,000 each).
The green line on the chart represents BTC’s price while the blue line represents how much open interest there is for derivatives relative to BTC’s market cap. Right now this is roughly ~8.31 billion dollars or 0.018 (1.8%) the value of BTC’s market cap.
Note how unusual it is for the OI ratio to stay above the ~1.3% (red line) area… Each time OI ratio went above this line it would start trending down.
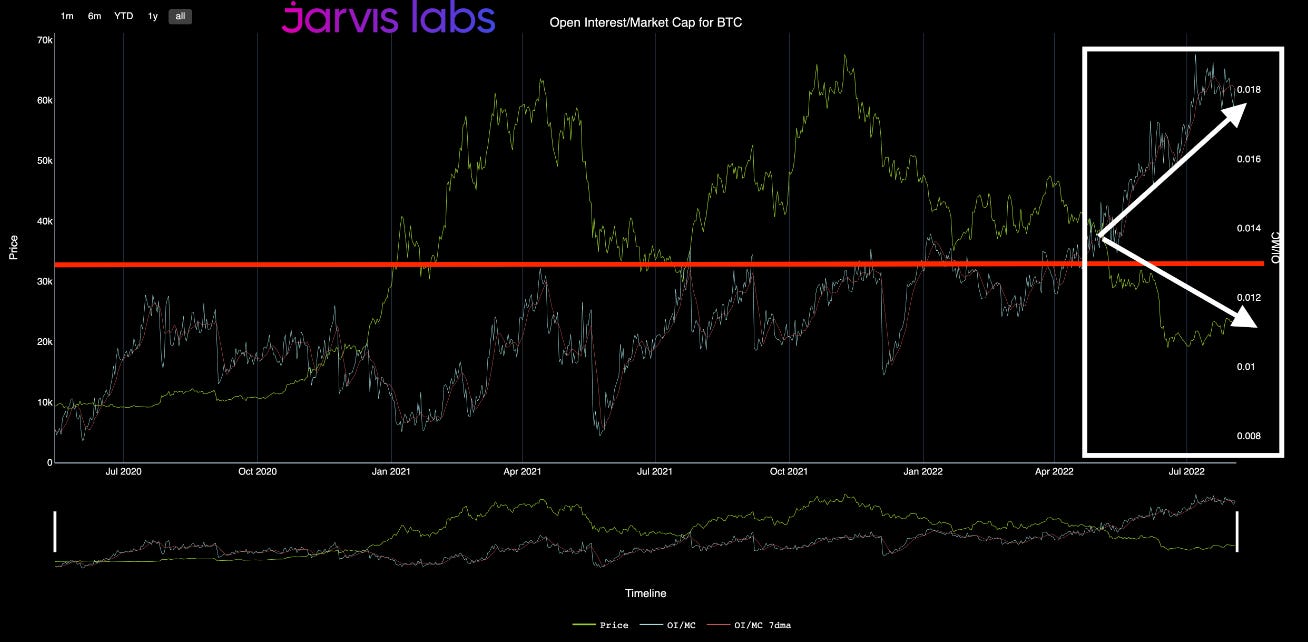
But not recently, which is what makes this chart so tricky.
The divergence in the chart below, highlighted in white, began in May of this year. This was just before the Luna / UST death spiral.
Since then there’s been a drastic shift where OI went to 1.9% while BTC’s price has dropped by over 50%.
That difference between a 1% baseline and 1.9% current value may not sound like much, but that’s a 90% increase. And remember, we’re talking about billions of dollars here!
Now, just the other night while cleaning I eavesdropped on a team meeting and heard all the analysts agree that the high OI is likely not sustainable. But it seemed there was some uncertainty regarding the why here, but couldn’t quite hear the reason why.
What I do know is high OI can lead to many traders closing their positions in quick succession. Which can create billions of dollars of buying or selling power, or major swings in price.
It’s just a matter of figuring out which direction the OI will swing.
Which is where Boyle and the beach ball comes in…
The OI is like water pressure on the ball. It can make price surge back above the surface OR cause price to collapse on itself to new lows.
To explain what is most likely to happen, I went ahead and did what Mr. Lilly likes to do, look at historical examples.
In Unison
Most often, BTC’s price and OI move together. You can see this in the chart below.
The white arrows below show that each time BTC surpassed $50k and $60k in 2021, OI jumped higher. What’s more is this signaled the rally was nearing an end.
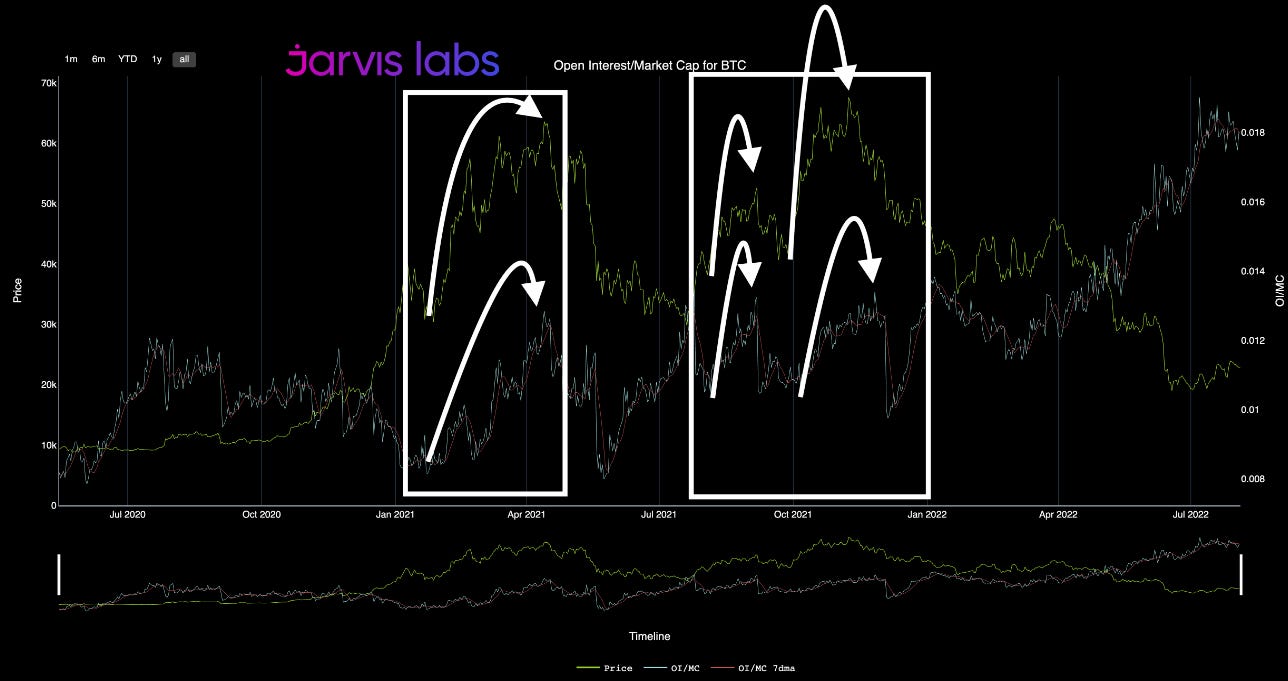
Shortly after the jump in OI, it dropped along with price. They were moving in tandem.
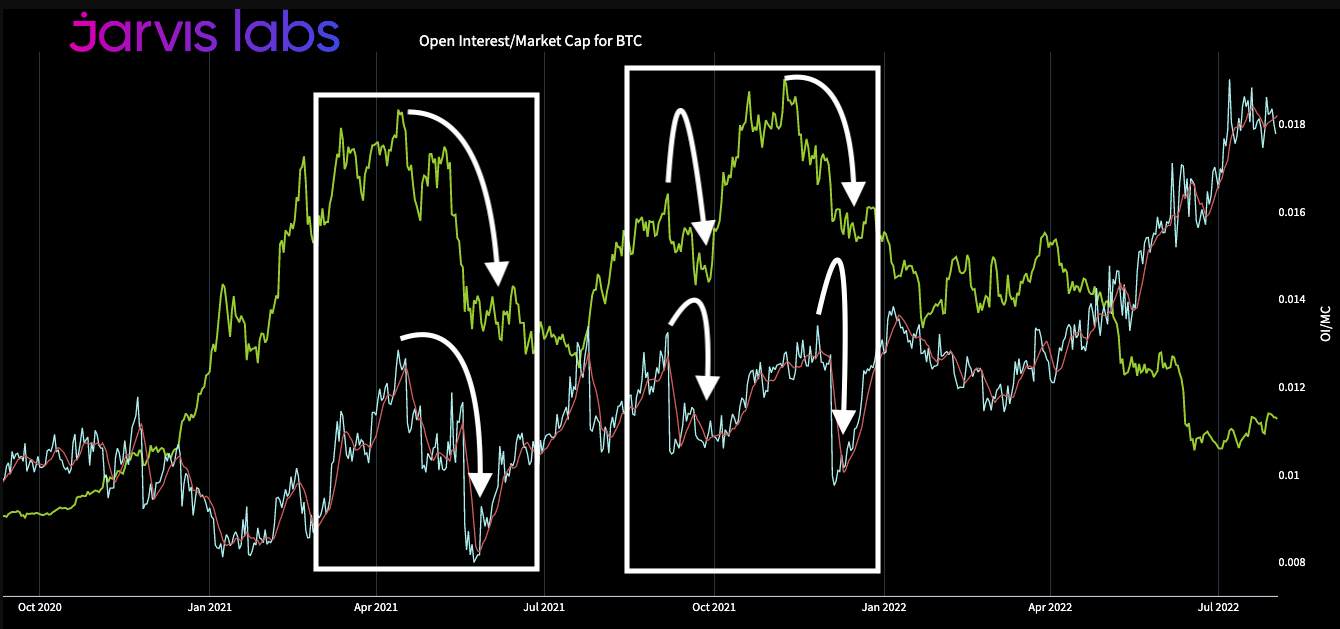
This is why the current pattern is so dang confusing. OI is rising while price has fallen.
The New Pattern is Old
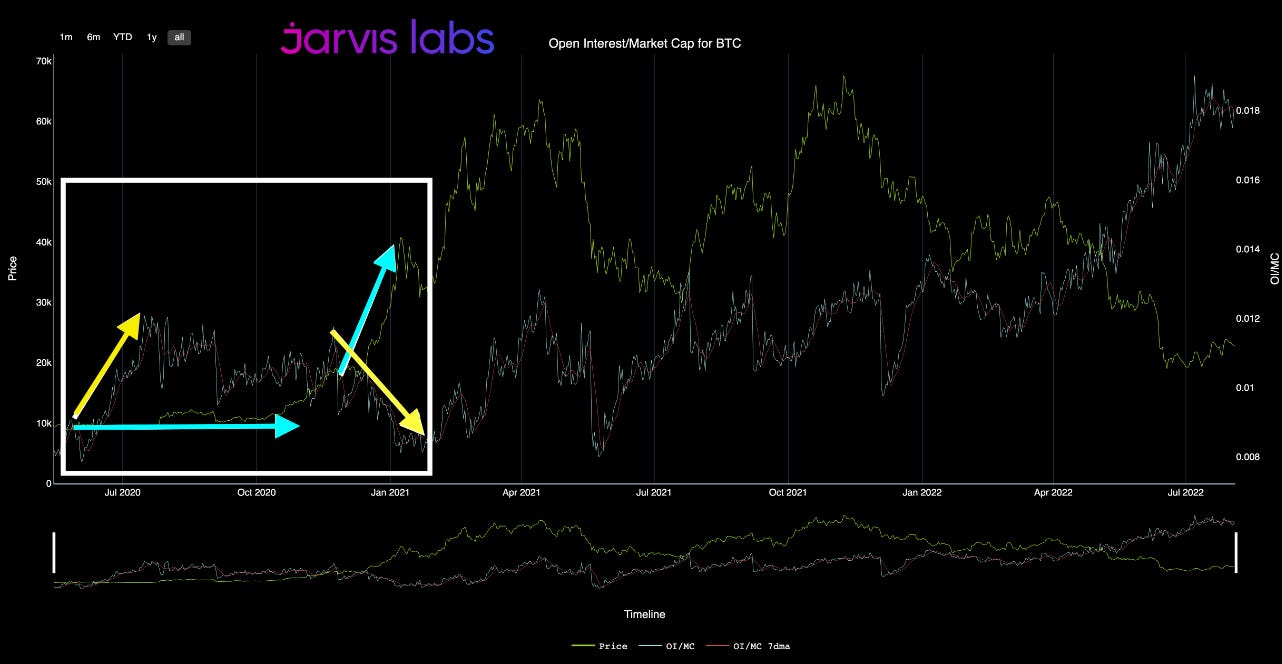
Looking further back in history I found there were other times this pattern unfolded. In the chart below is the more recent example.
It happened in the second half of 2020. Which was also the first time OI (first yellow arrow) was more than 1% of market cap. This unfolded while BTC price stagnated in the $10k range (blue arrow).
Where this got interesting is in late November 2020. The OI begin to decline as seen by the second yellow arrow. Price then went ahead and rose by over 100% in just a few weeks.
The only time this pattern unfolded was in May 2021 after BTC dropped more than 50%. OI began to rise as BTC ‘s price went sideways.
Then as the OI fell, we once again got another major 100%+ rally!
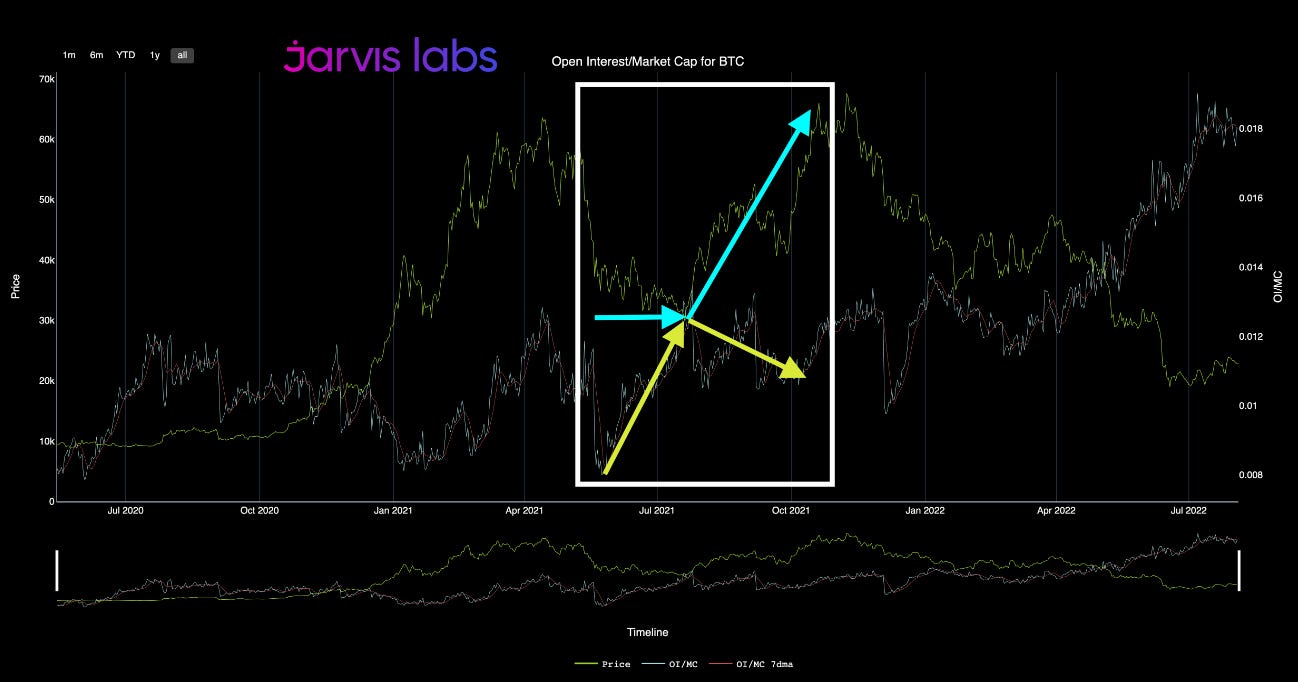
In both instances BTC’s price was a hyper buoyant beach ball rising from the deep end with speed.
Which makes me wonder if what we see now is something similar… One that could lead to a huge rally.
We see the same structure as before… Derivative OI is surging to new highs while price stagnates following a large crash.
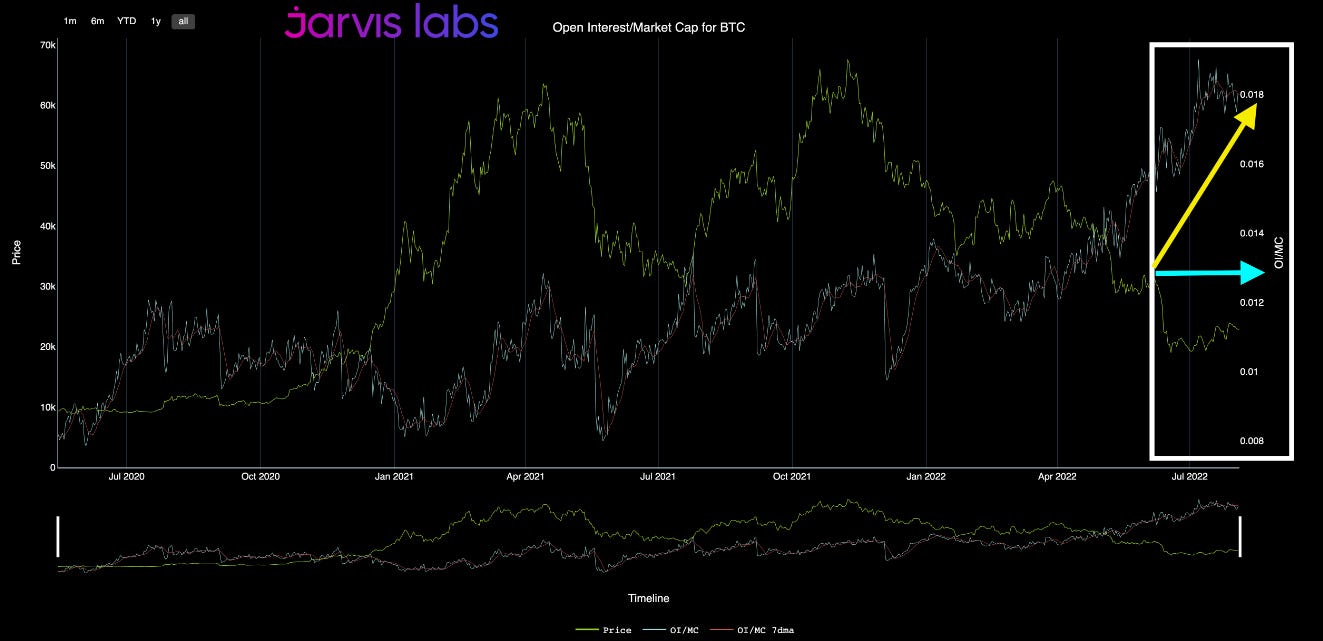
But it can’t be that straight forward, right? After all, market dynamics have changed since 2020-2021.
For all I know this divergence could just mean that the types of people trading this market are totally different than ones who traded it last year. Somebody said the market is very protected to the downside… I didn’t fully understand and hope to hear more on this soon as I’m still trying to figure this stuff out.
What I do know is if this OI does not release soon, then we might see price do the opposite here and collapse in on itself lower.
That’s as far as I was able to get with the chart. I’m sure some of you have other views. And I hope to hear them. So please comment here or use the Twitter app… I’m @JlabsJanitor.
Remember, if you guys help me reach 1,000 followers, my friend owes me a pizza!
Bye Everyone,
JJ


