Who's Bluffing, Crypto or the Dollar?
Notes From the Lab: The High-Stakes Showdown Between BTC and DXY


A steely-eyed Russian card shark glances down the table at his baby-faced opponent.
“Last card coming,” he taunts, as he flips over an ace.
Immediately, the young man’s facial expression shifts to a look of distress.
That reaction says it all. There’s blood in the water, and the Russian goes in for the kill.
“It hurts, doesn’t it?...That ace could not have helped you. I bet it all,” he says, mocking the young man while dropping his full stack of chips into the middle of the table.
“You’re right, the ace didn’t help me,” the kid says as he reveals his cards. “I flopped the nut straight.”
In poker, “nut straight” is a term used to describe the strongest possible hand one can hold in a specific game.
Meaning the Russian got duped into going all in on a bet he was destined to lose.
You might remember that scene from the cult-classic film Rounders (1998) where a young Matt Damon takes John Malkovich’s character “KGB” to the cleaners.
The reason I’m reminded of it now is because the market’s structure at present has all the tension of a high-stakes poker game just before the final flop.
On one side of the table is the U.S. Dollar Index (DXY). On the other is Bitcoin (BTC), and all other crypto risk assets by proxy.
At this time, both appear equally confident that they’re holding the winning hand. But in the end, just like in poker, there can only be one winner.
And with the moment of truth (Q1 close, end of March) just around the corner, let’s unpack the data to see if we can find any tells hinting which side of this standoff is bluffing.
Spot the Liar
The inverse correlation between DXY and BTC is something we’ve covered extensively in recent months.
The TL;DR if you missed those essays: Historically, when DXY rises, BTC falls. The opposite is also true, as BTC and risk assets have had their strongest bull runs during DXY bear markets.
For instance, in January, DXY was trading around 105.70 when it experienced the technical “death cross.”
Then, for the remainder of January, DXY (red and green line, right axis) slipped into a strong downtrend. By February 1, it was trading at new multi-month lows near 100.80.
Meanwhile, BTC (orange line, left axis) pounced on the dollar’s weakness and worked its way up over 50% from December’s lows.
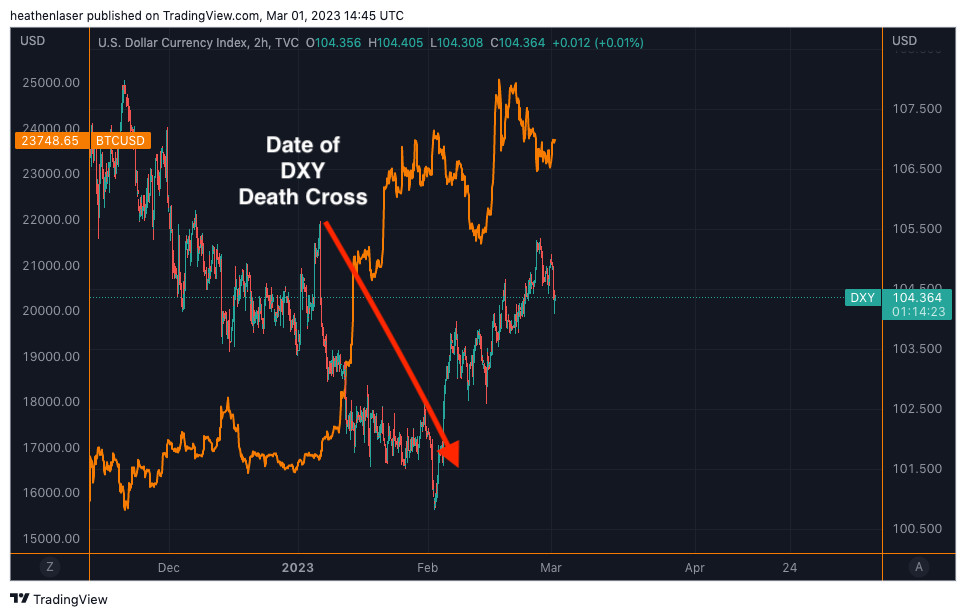
However, since February 1, the tides have shifted, and DXY put a halt to BTC’s rally.
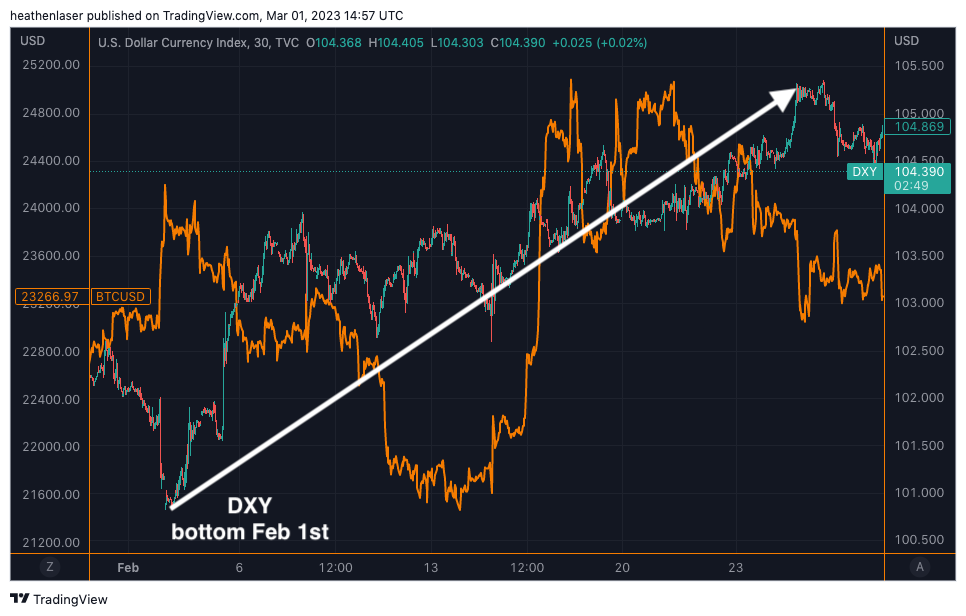
Below, we see how once DXY found a bottom at 100.80 on February 1, it began to reconquer lost ground in a hurry, rising back up to a high near 105.30.
Meanwhile, BTC has been mostly flat, chopping back and forth within this $21,500–$25,200 range.
What’s out of the ordinary here is the proportion of gains to losses for BTC versus DXY.
Between December and February, BTC shot up over 50%, while DXY declined by ~5%.
In the time since, DXY has erased almost all of its losses, yet BTC remains near its February highs.
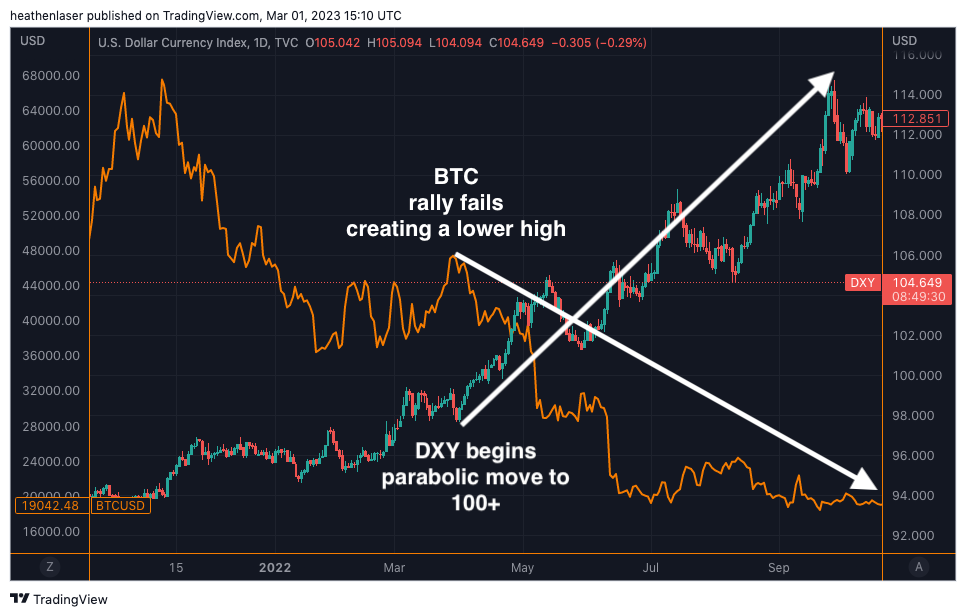
This action is unsettling, because as we see below, the last time DXY was above 104 as it is now, BTC was still trading between $16,000–$18,000.
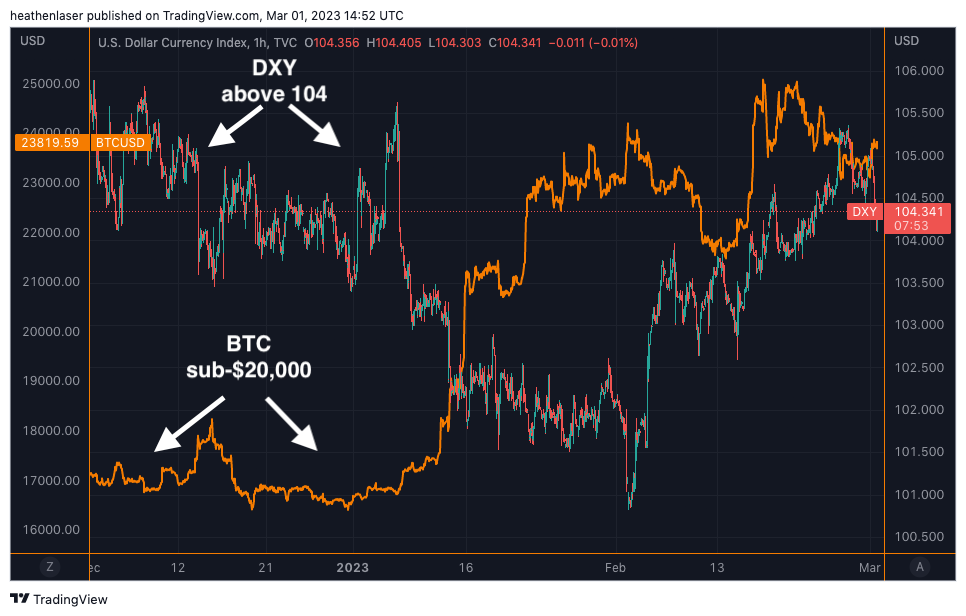
This anomaly tells us that one of these current prices is a liar.
Either DXY is bluffing and this is a dead-cat bounce into resistance, or it is BTC that’s bluffing and the past two months were nothing more than a well-disguised bull trap that’s about to reverse back to reality.
To find out which is more likely, we have to study the last hand these two played aggressively against each other.
Same, But Opposite
Do you remember March of last year? Pre-Luna, Celsius, FTX, and all other 2022 horrors?
If so, you might remember that though BTC’s music had already stopped in late 2021, people were still dancing, oblivious to the pain DXY was about to unleash on markets.
That time period was when we last saw both BTC and DXY trading at extreme highs in unison.
However, that structure was predictably short lived, as BTC wound up rejecting harshly from its 200-day moving average (MA, red line below) and plunged to new low after new low for the remainder of the year.
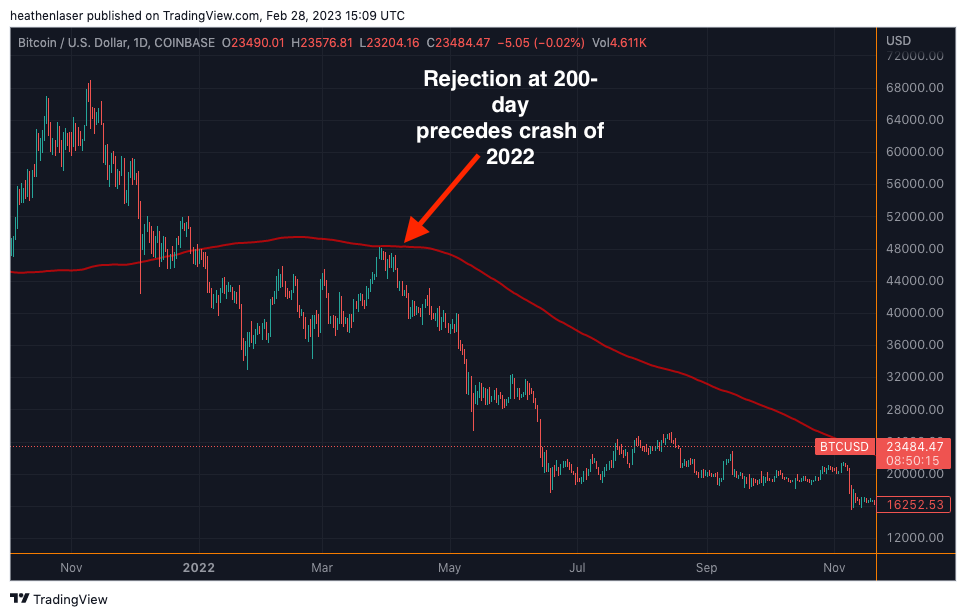
Not coincidentally, while that was happening, DXY was simultaneously making higher highs and signaling strength.
Below, we see how once DXY began to move toward the crucial psychological level of 100 early last spring, it was over for BTC, and DXY was off to the races.
Reason I mention this now is that the dollar's current technical structure is eerily similar to Bitcoin’s bluff of last March.
Then, it was BTC making a series of lower highs into a failed retest of its 200-day MA. Now, we see the same, but opposite.
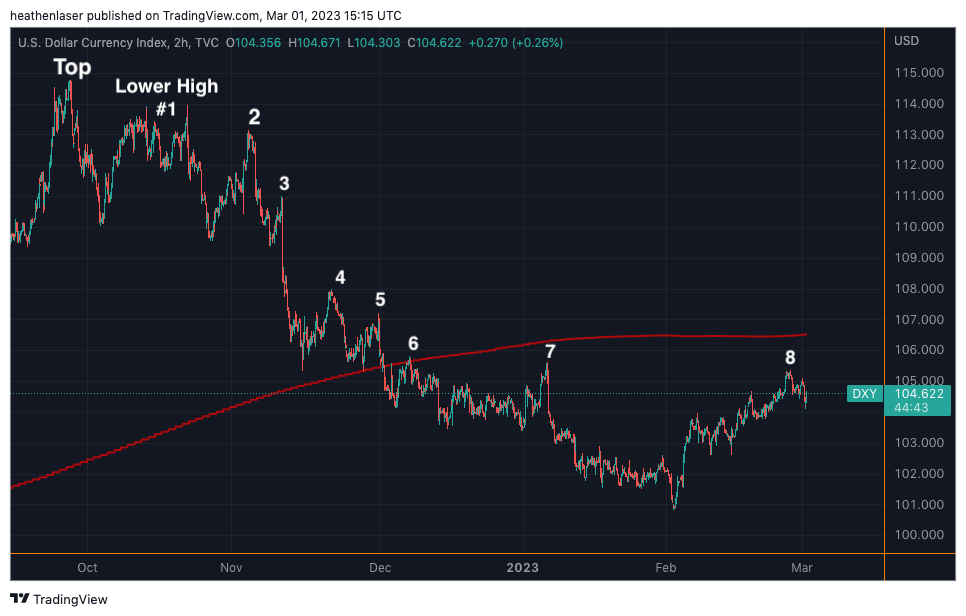
When DXY topped out last Friday, it did so just under the crucial line of resistance at 105.65 we discussed last week.
This formed a “lower high.” It was the 8th lower high (white numbers on the chart below) for DXY since reaching a pico top of 114.85 last September.
As we can see here, each previous lower high was followed by a lower low. That implies that if this overhead resistance continues to hold into the end of Q1, it will be safe to expect new year-to-date, sub-100 lows for DXY by the spring.
Perhaps even new lows that catch the majority of the market off guard again, just as they did last year.
After all, there weren’t many predicting sub-$16,000 BTC in 2022, yet that’s exactly the hand we were dealt.
If DXY’s 100 level is to flip from support to resistance, there is no telling how far it might fall.
I see it as being of similar technical importance as BTC’s $40,000 level was last spring, and we know all too well what happened after that levee broke.
Should that scenario come to pass and result in sub-100 DXY by March or April, I imagine $30,000+ BTC and $2,000+ ETH will be soon to follow.
But as every gambler worth his salt knows, you never count your money while you’re sitting at the table.
So with that cautious optimism in mind, let’s also analyze what could happen if BTC ends up on the wrong side of the final flop.
Thank you for reading Espresso. This post is public so feel free to share it.
DXY’s Ace-in-the-Hole
The primary driver of DXY’s bullishness in February was the rise of implied terminal rates, which represents the market’s expectations of how high the Fed will raise its federal funds rate in 2023.
In January, the implied rate was below 5%. However, since February 1, it has surged to new highs near 5.4%.
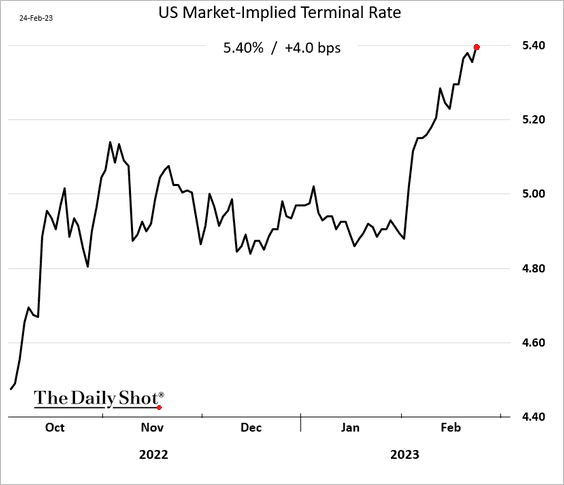
This is now the highest these implied rates have been since 2007 – just prior to the Global Financial Crisis.
Rising rates allow USD holders to earn more “risk-free” interest on their excess cash, which can attract capital out of risk markets like BTC and into DXY – as we saw in 2022 and again in February.
Should this trend of rising terminal rates continue after March 22’s FOMC meeting, DXY will almost certainly reconquer its 200-day MA.
Consider that combination an invalidation of the technical analysis we outlined above, as it would spell doom for BTC and all other crypto assets due to DXY absorbing further liquidity.
In that scenario, all bets are off, and we could expect to see BTC back in the sub-$20,000 range. 2022’s lows could even be threatened.
High risk. High reward.
The only thing I feel highly certain of at present is that whichever way BTC and DXY diverge from here into March’s Q1 close, that action will decisively set the tone for the remainder of 2023.
No different than we saw in 2022.
While we await that moment of truth, the safest bet seems to be hedging yourself with exposure to both asset classes to protect against tail-risks.
Then, after the final flop, you can increase your bet size accordingly.
Until that time comes, trade safely and keep an eye out for bluffs from both sides.
Your friend,


