Headwinds
Mid-Week ChainPulse Update


I’m honestly a bit surprised how the last week played out.
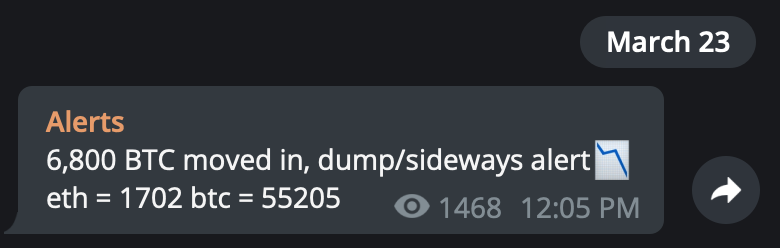
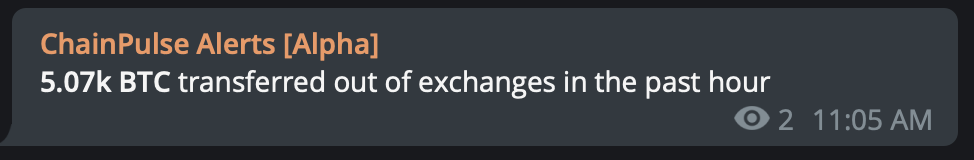
We had our notorious Pablo show up and move 6,800 BTC in total to the exchange. Seeing that transaction come across your monitor is the type of thing where you drop what you’re doing and stand ready at the helm.
Sure enough, prices followed suit and dropped nearly $5,000 since the alert came through.
This coincided with the last leg down as well as the massive options expiry date. We reflected the likely outcome in this chart, which was published the morning we alerted you “Pablo is Back”.
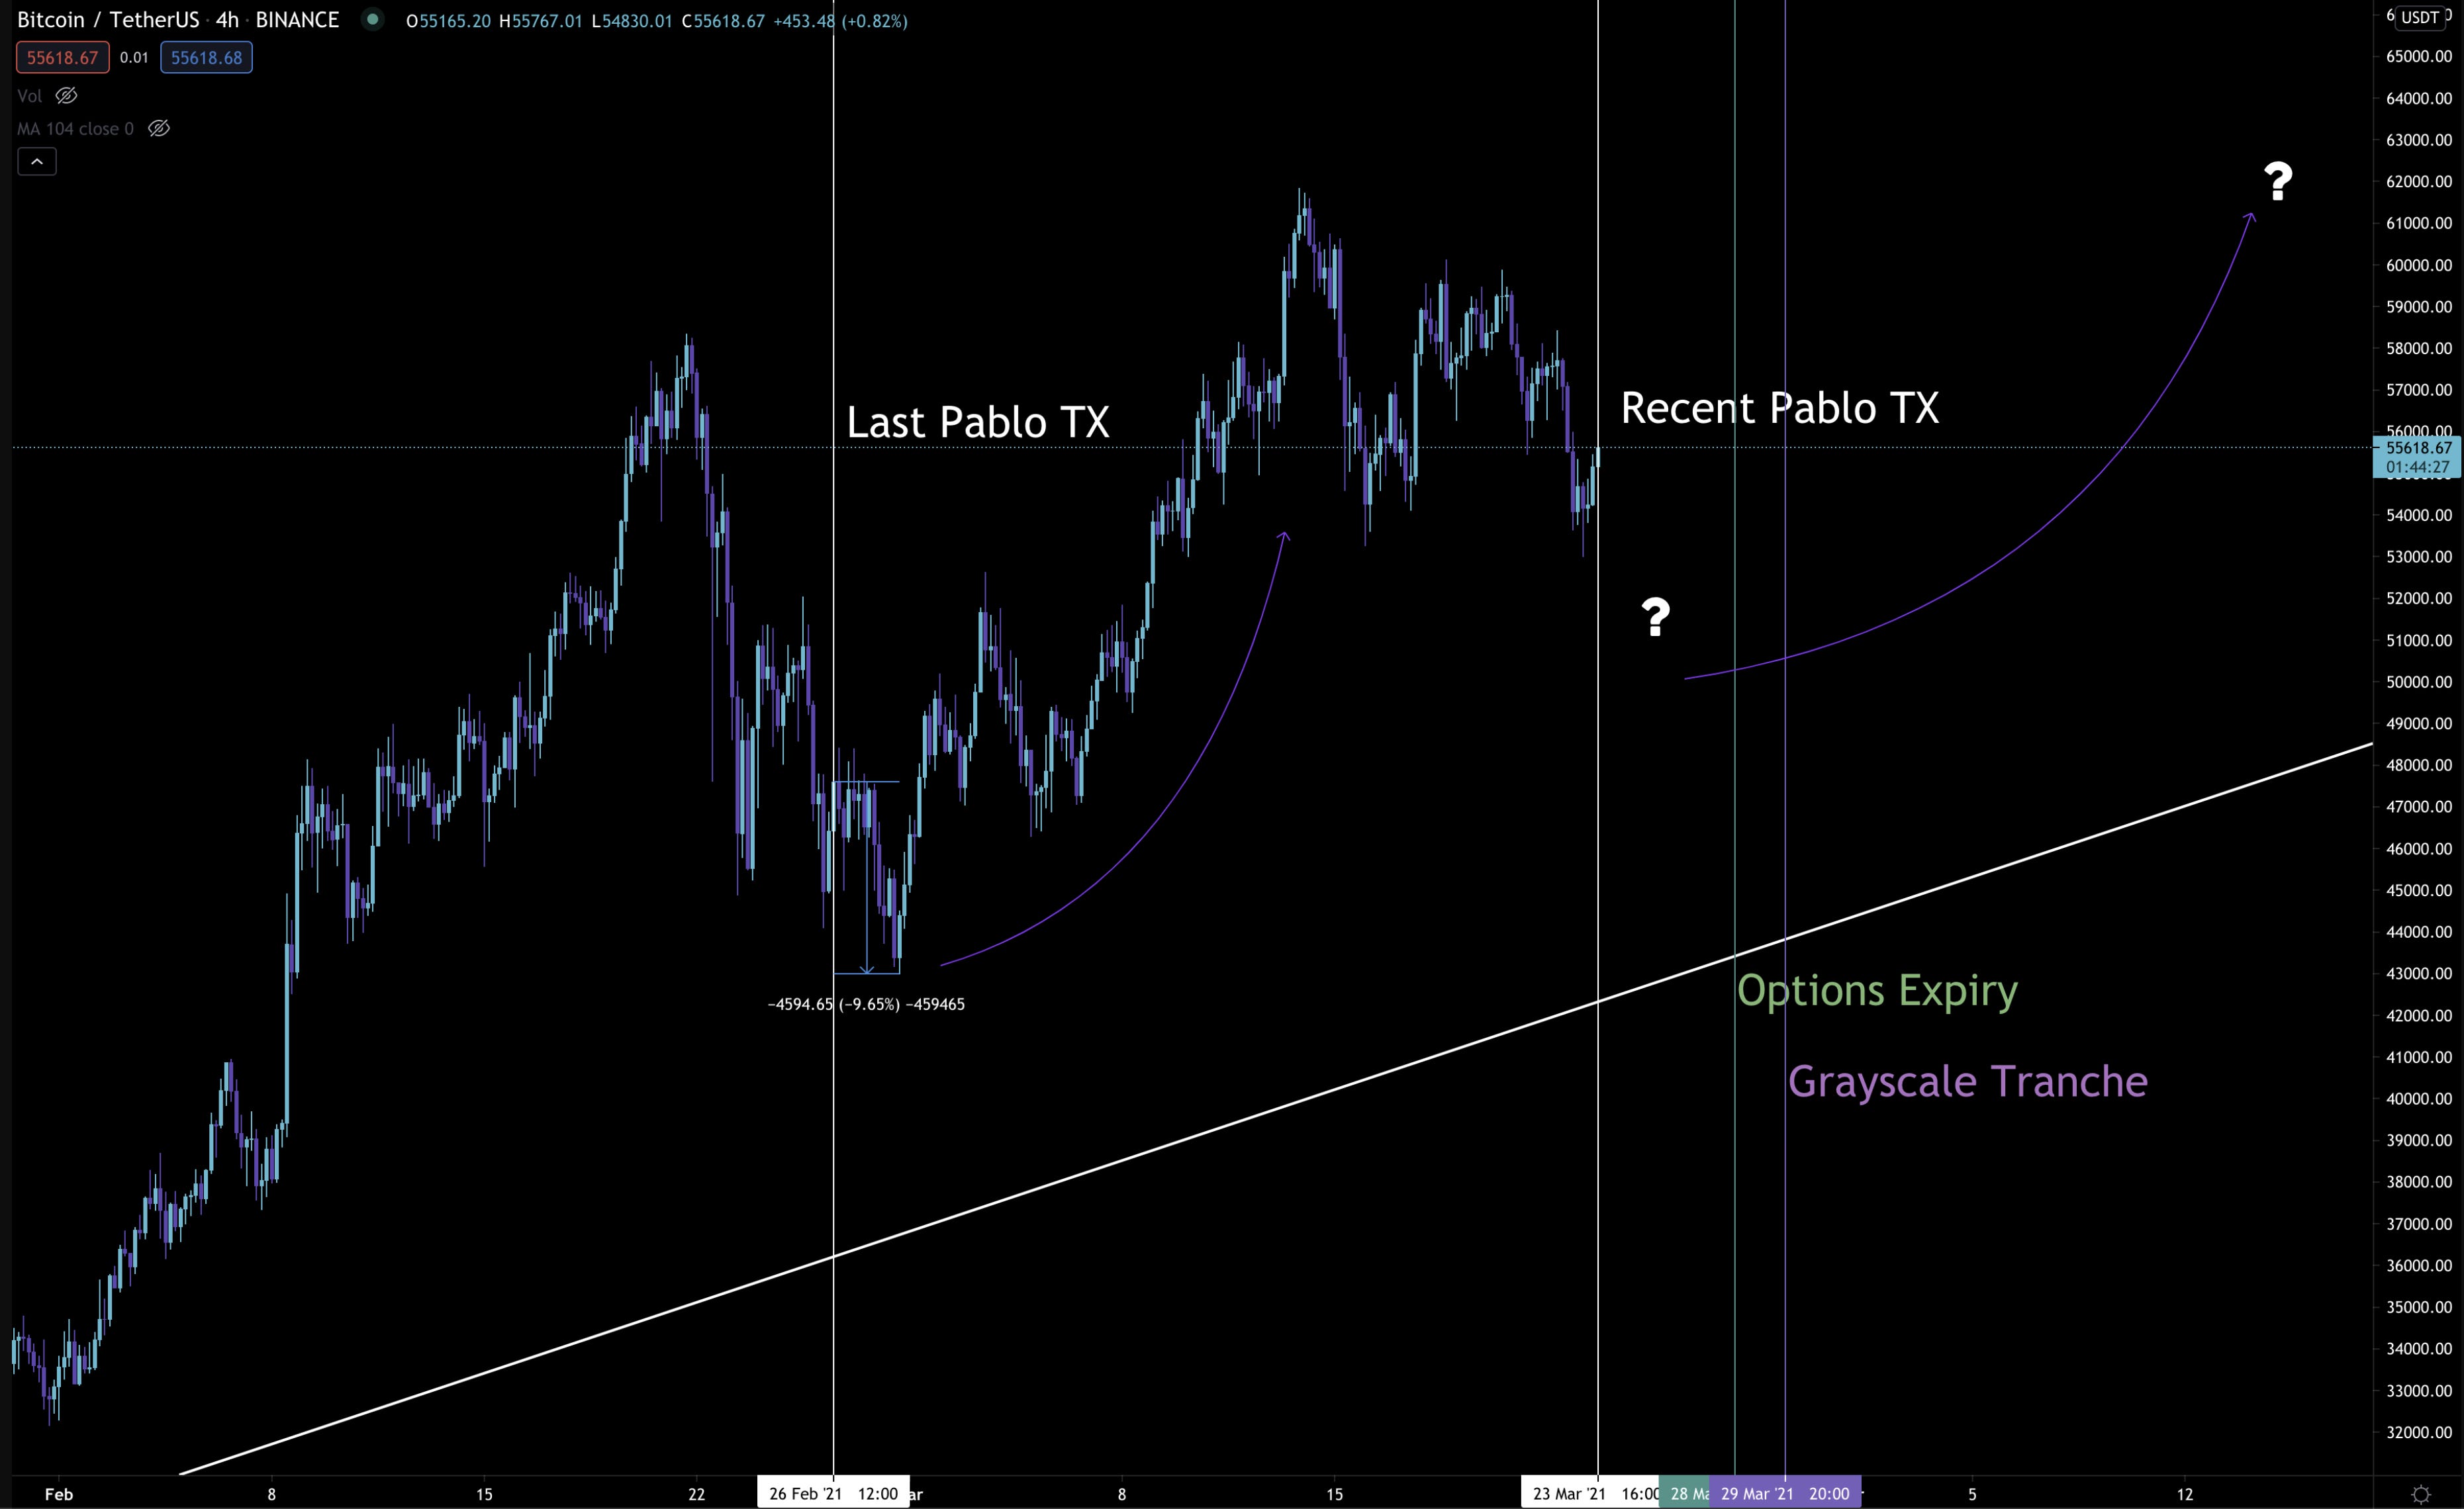
Here’s what that chart looks like today. The only difference between the two charts are Grayscale Tranches. These are upcoming unlocking events to keep an eye on as they near. They help paint the upcoming bullish picture… Yes, that question market in the upper right hand corner is at six-figures.
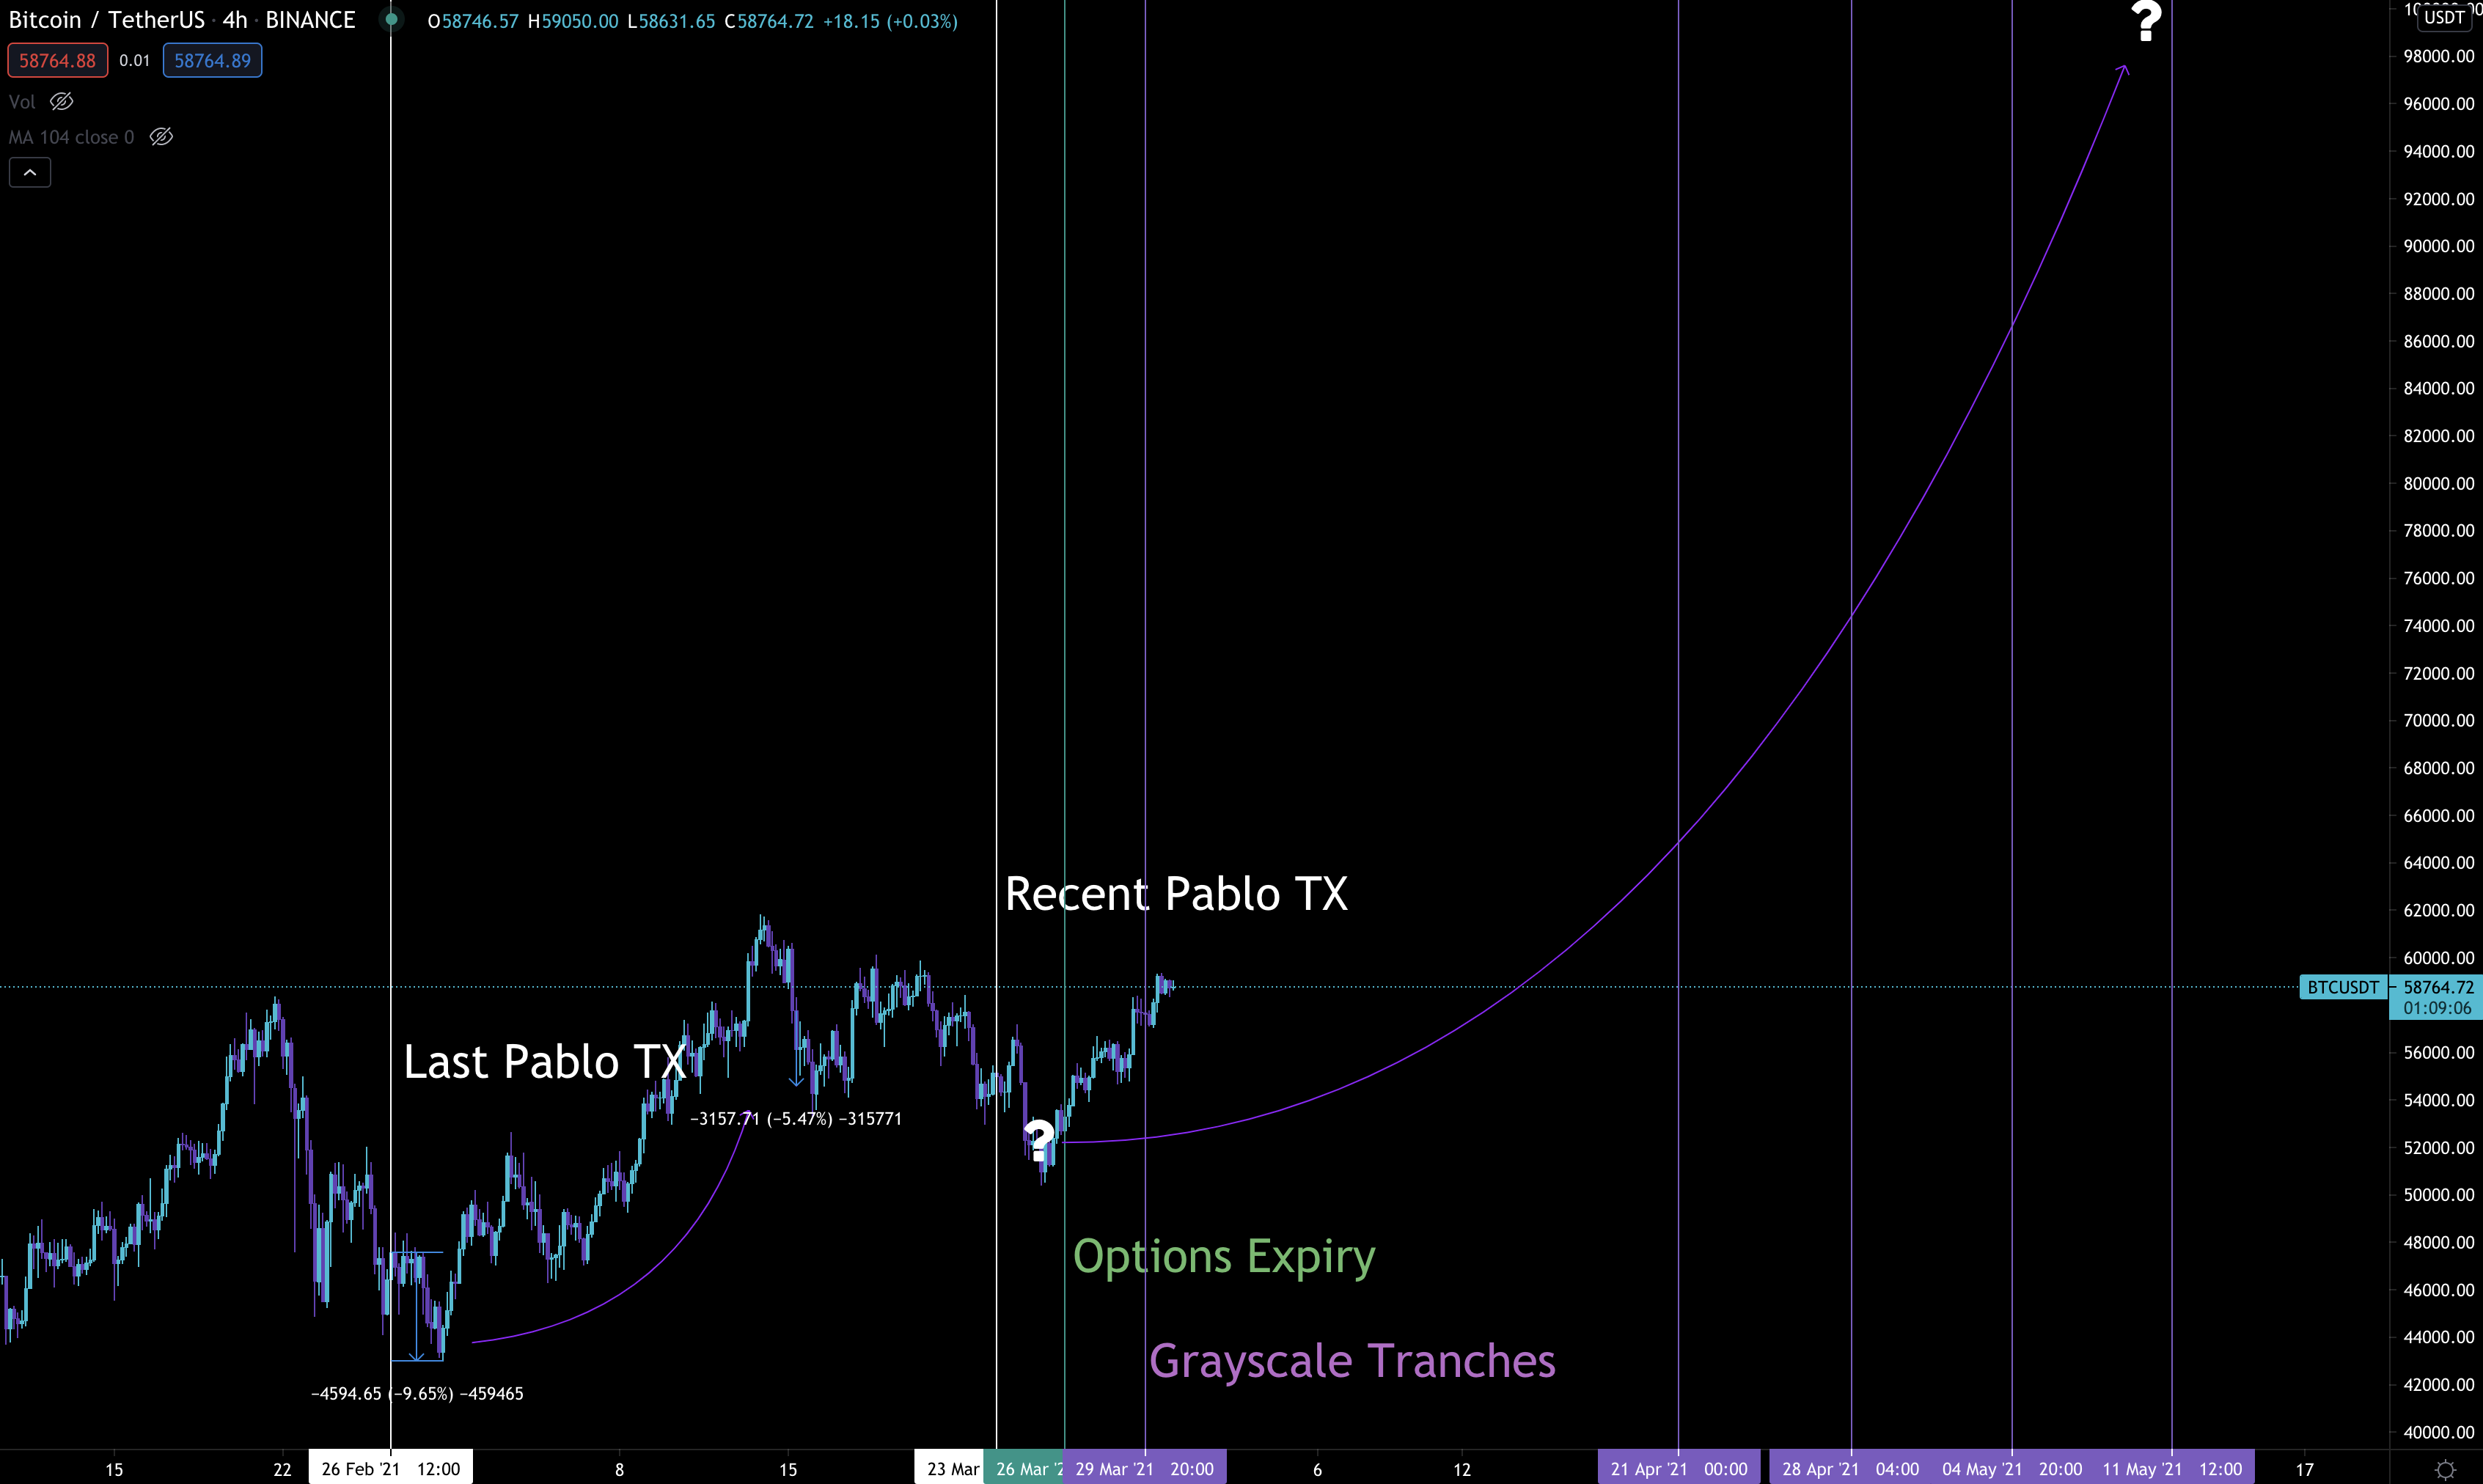
But before we get there we need to not only build some momentum, and just like clockwork it’s happening.
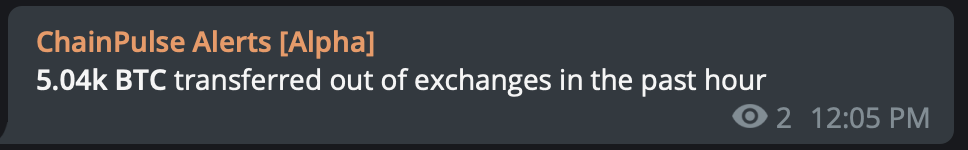
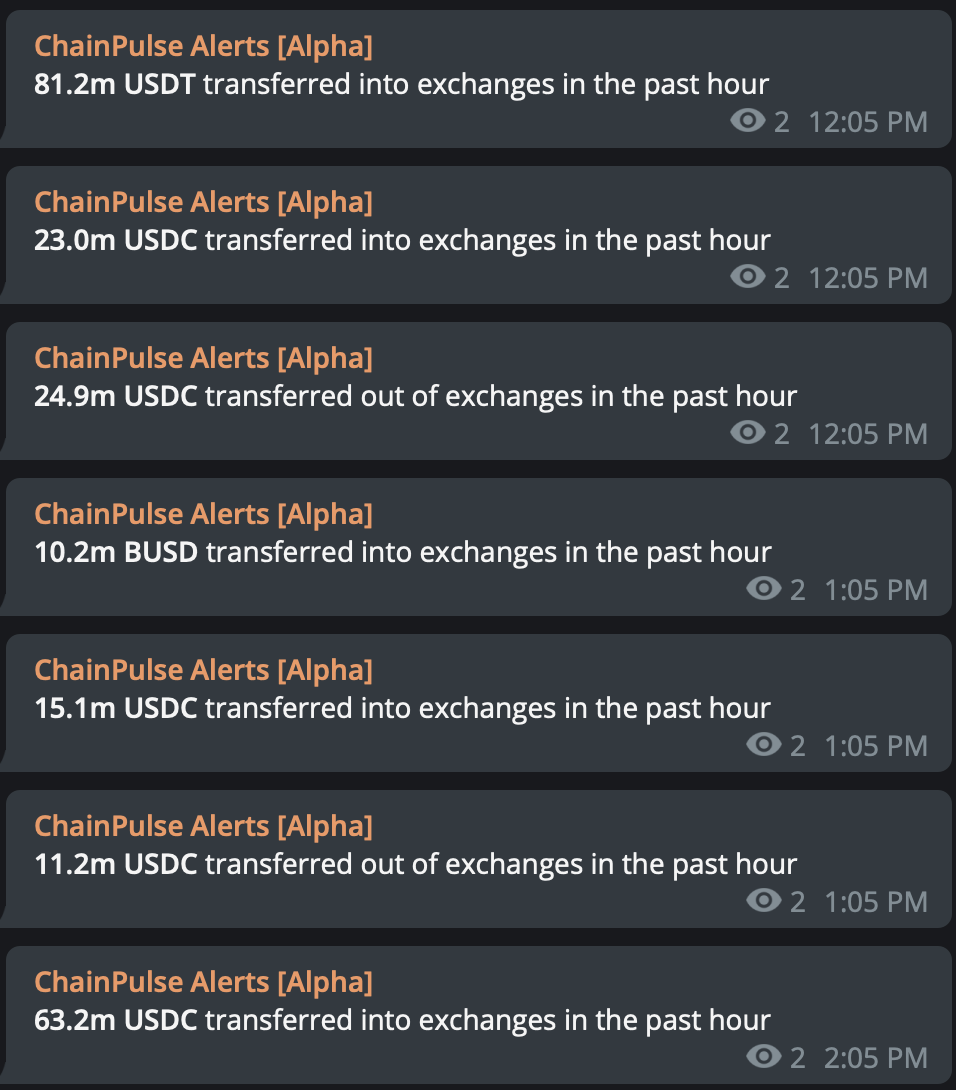
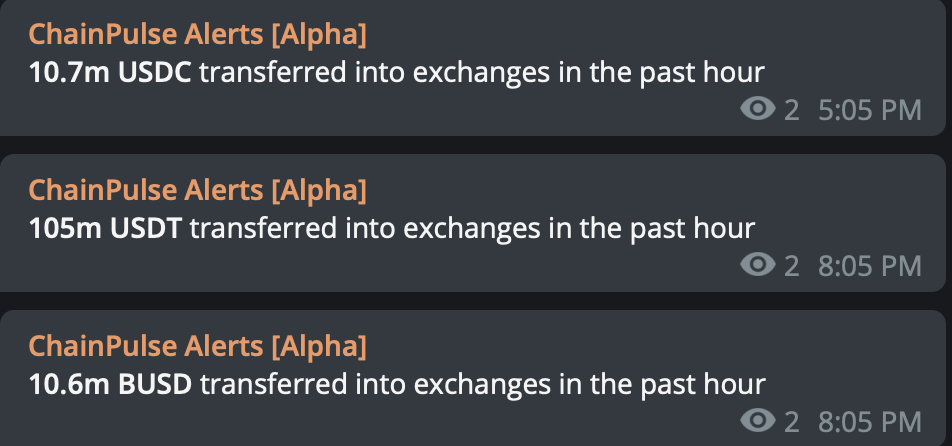
In fact, transactions on-chain that we tag as correlated to price began to ring through our ChainPulse feed in unison with price as it climbed higher.
Here were some of our alerts since Monday…
March 29
March 30
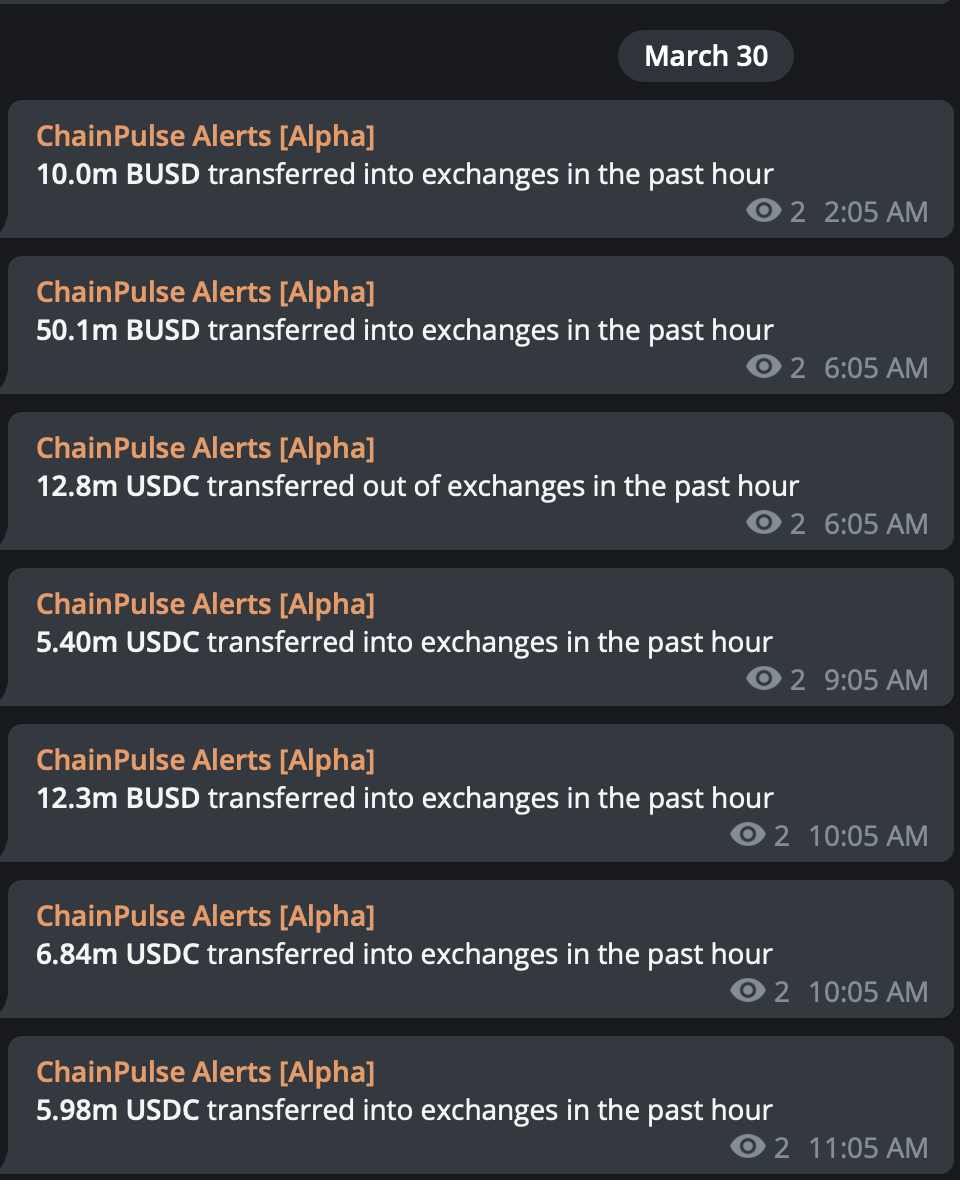
These alerts were waves of bullishness coming in through the blockchain. That’s on top of the high levels of dry powder already in the market, which we mentioned on Monday.
Unfortunately, as price began to approach $60k, the alerts fell silent.
As I write this just before 3:00 UTC, price is starting to move sideways. I don’t find it alarming, but more as an opportunity. If the bullishness on-chain is to take a breather then I’ll be looking for an entry. And a very slight cool off does seem warranted giving the funding rates we’ll show you in just a bit.
But before getting to that… Based on the strong push from $50k and from the passing expiry, bullish on-chain activity, and the end of Q1 resulting in a stack of futures rolling off the books, the long-term bullishness remains intact.
These are all very strong indicators for $60k to be breached. However, all is not so easy. Over the last 24 hours some slight headwinds started to emerge that we need to follow...
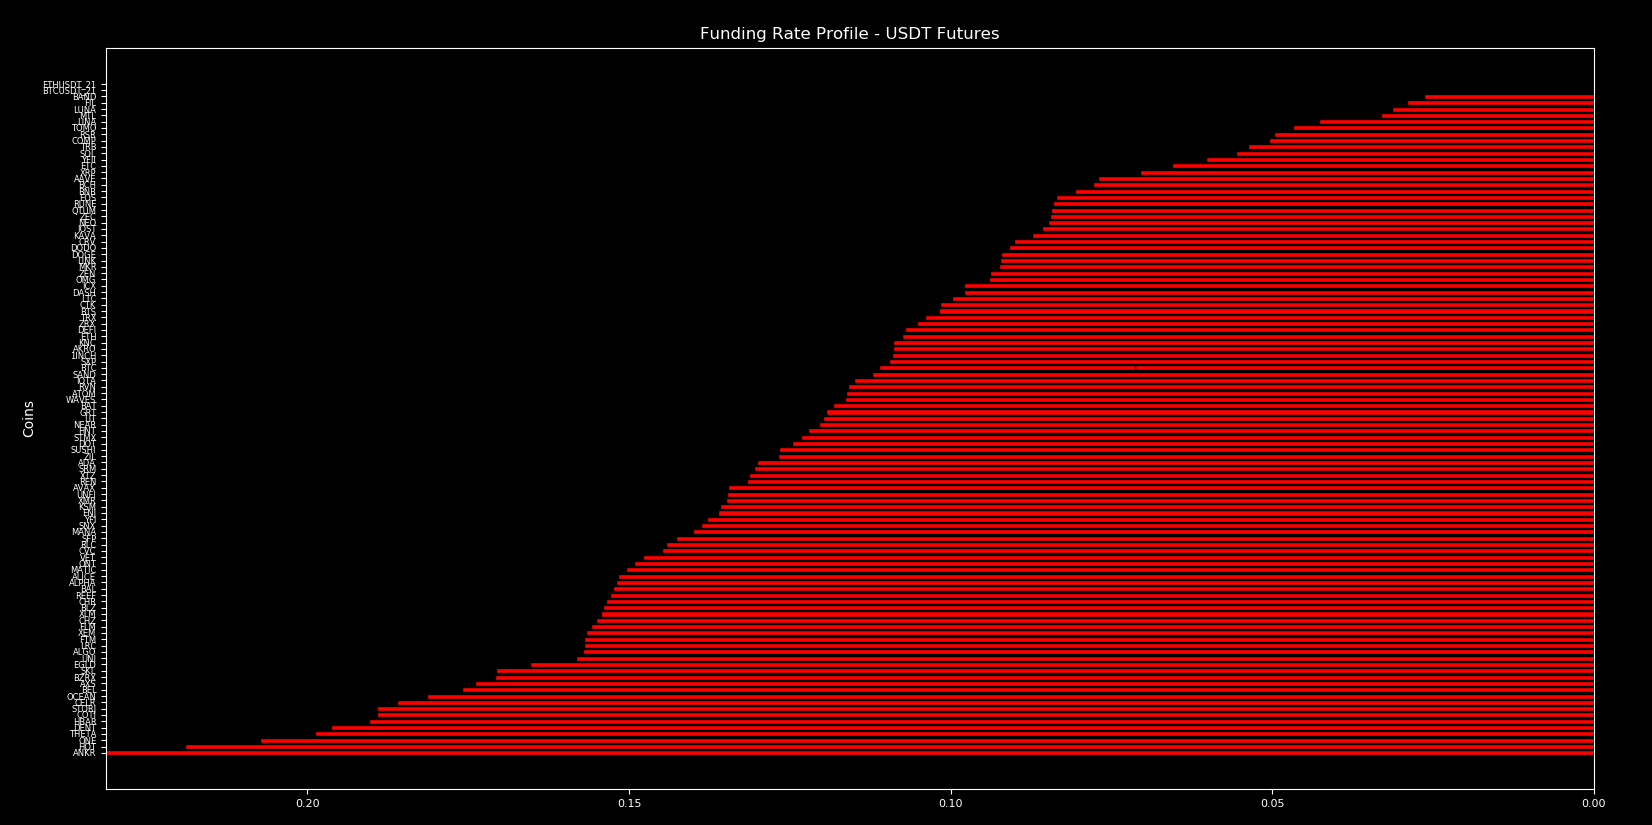
One of these headwinds was funding rates. They began to spike as we approached $60k. Ideally this happens after a major resistance is broken, not before. When it takes place before such barriers it can sometimes create a slight drag since these positions are nice pools of liquidity for a whale.
This means a quick retrace can be easy money for market movers before price takes an impulsive leap higher through resistance.
Remember, funding rates can act as an indicator that lets us know if markets are getting irrational. If red bars approach north of 0.4 then leveraged longs are paying 438% interest to keep their position open. While anything green is where short positions pay.
Additionally, US dollar index (DXY) and 30yr yields are trying to get some media attention.
Here’s our DXY chart that we’ve been following…
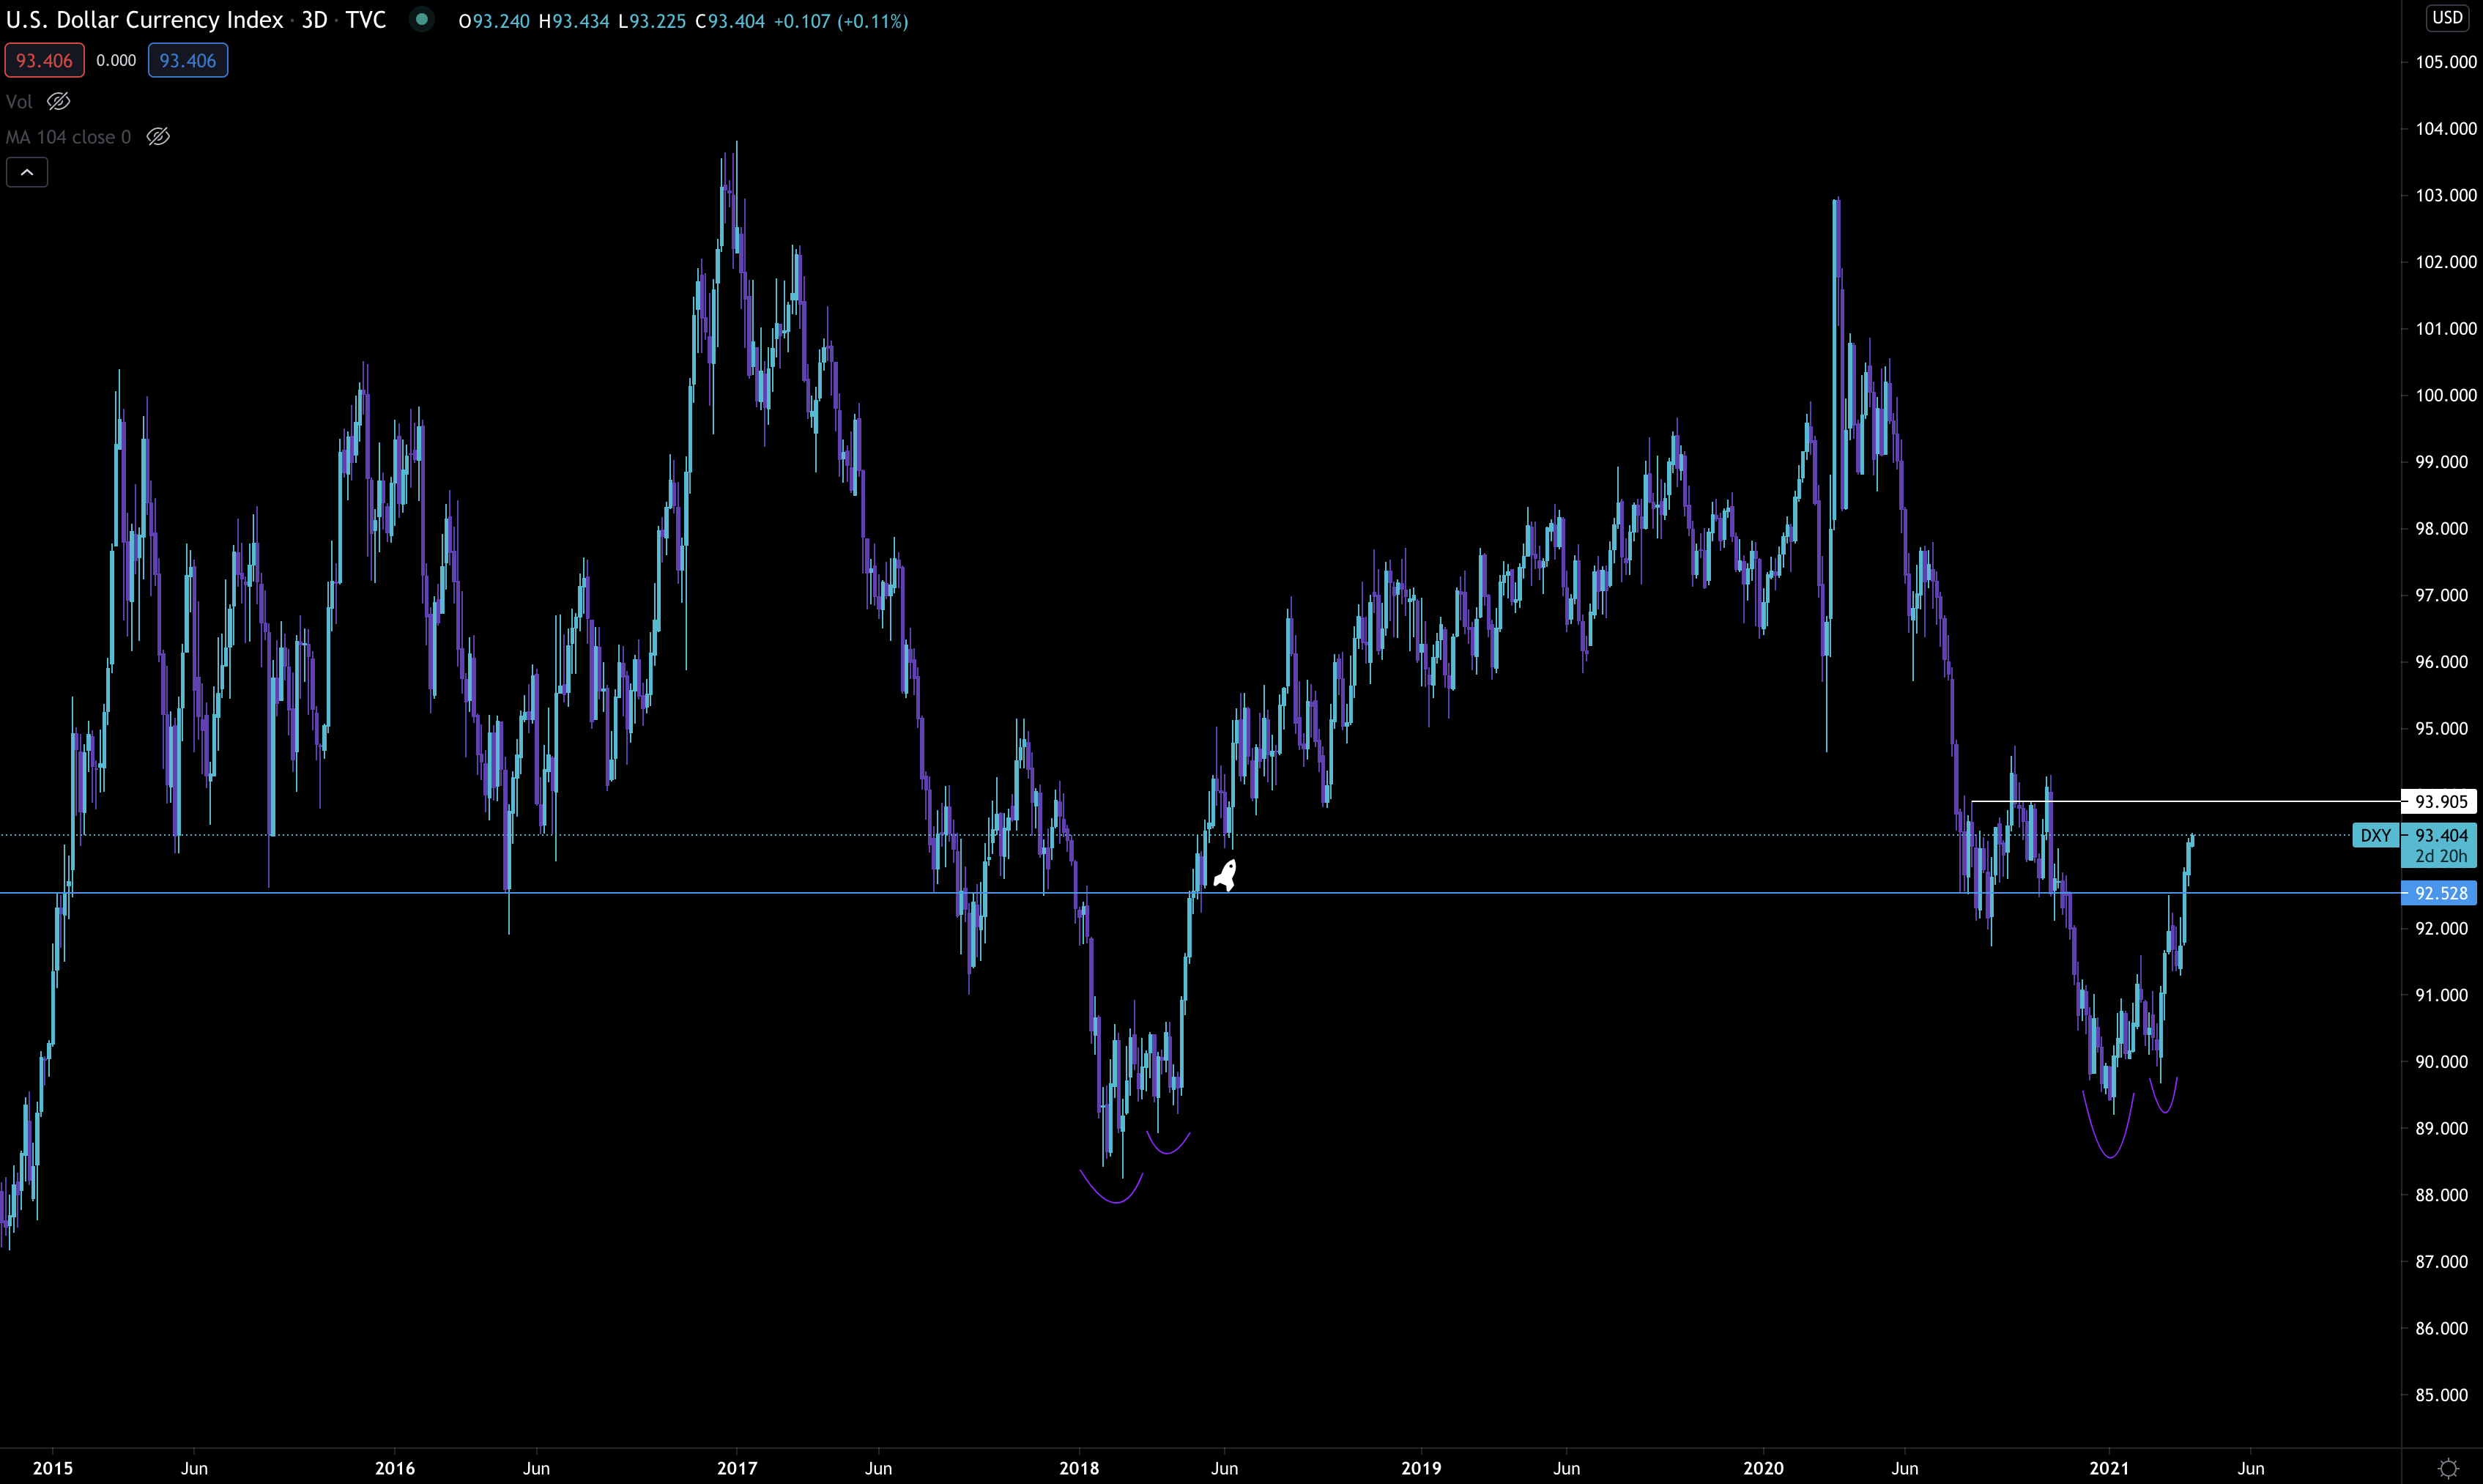
That horizontal blue line acts as a bit of a divider in trading ranges. Right now we’re above it. The price action is reminiscent of early 2018.
While this type of trend is interpreted as being bearish for bitcoin, we didn’t see any signs of it in the last couple of days. For now that’s encouraging… But if we break above 94 on the index (white horizontal line) than it might signal fast price action higher.
Fast price action is the type of thing that tends to create correlations felt in other markets. It’s one of the main reasons we track DXY.
And it’s what brings us to our last chart for the day. It’s the 5yr U.S. government bond yields chart. It’s starting to make a move into the liquidity gap seen below.
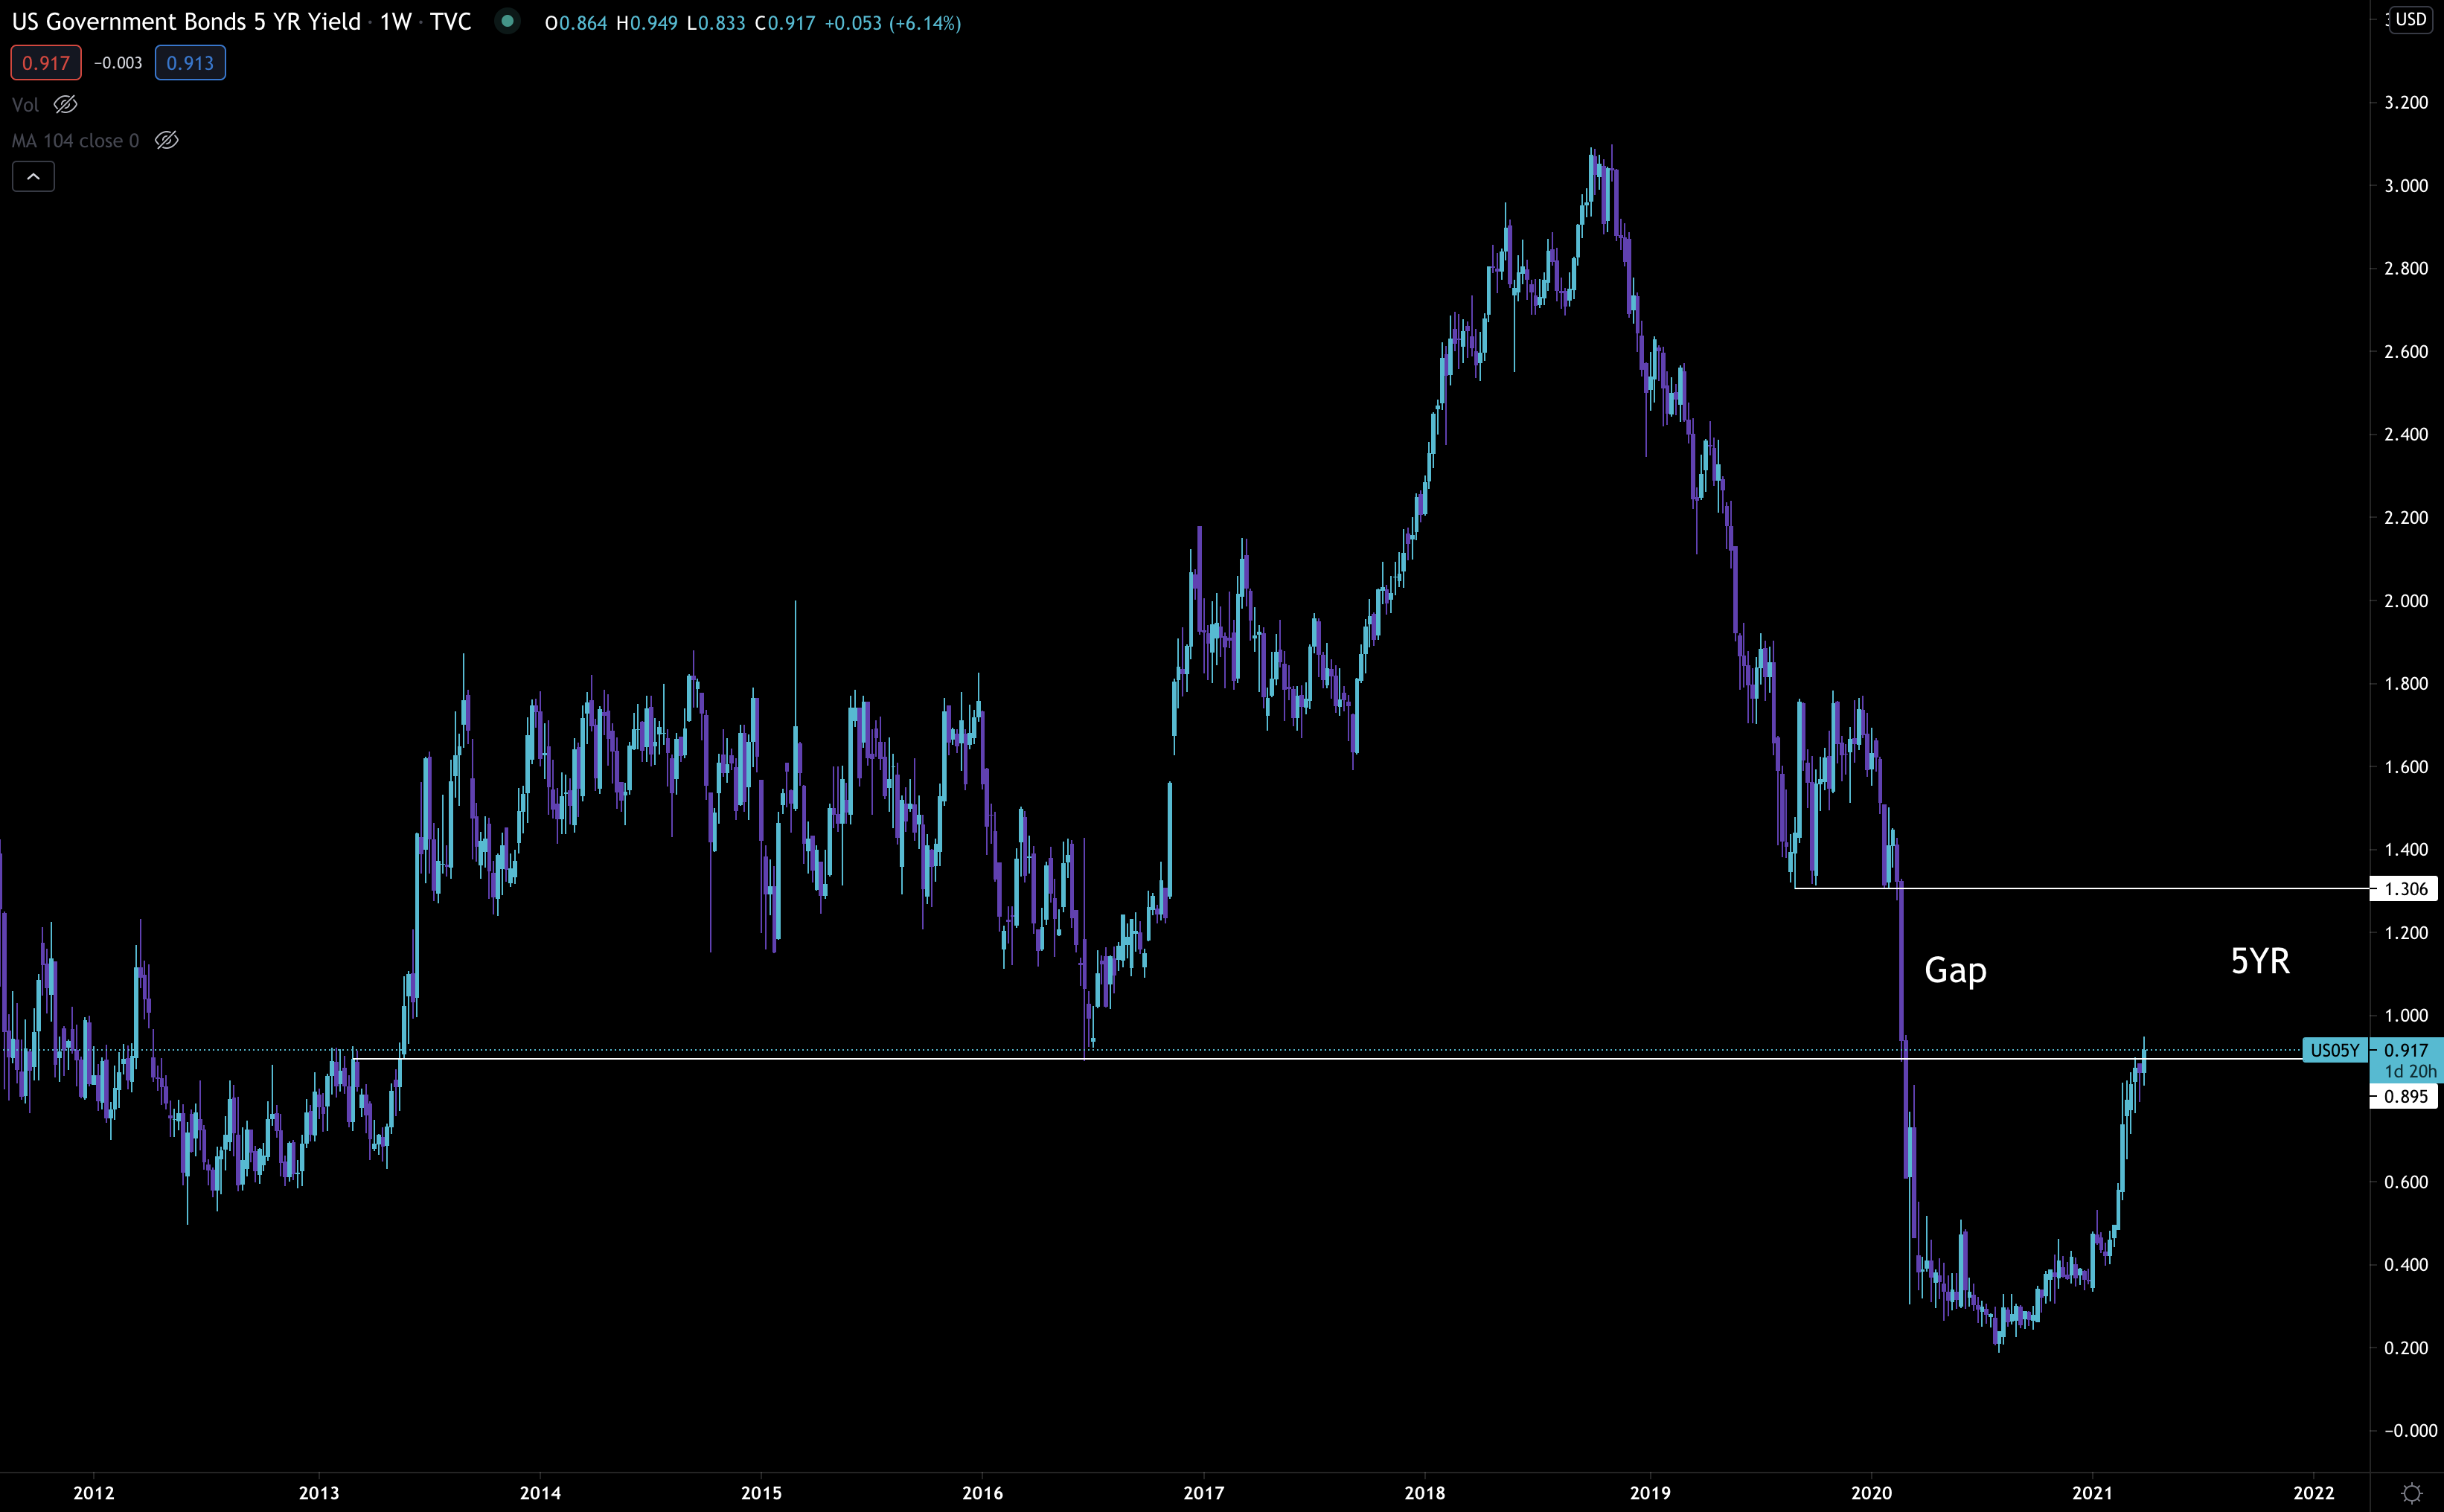
That gap represents an almost 50% jump in rates. The 30 yr is also looking to make a break in a similar fashion, you can view that in our Monday report if necessary… But it’s showing a similar situation as we see with the 5yr.
The DXY and government bond yields are two things to watch over the coming days. These represent more of a hurdle than funding rates do.
The reason funding rates aren’t much of a hurdle is they can easily reset with a quick dip in price.
Resetting DXY and yields on the other hand… that requires government interference. It’s the type of event that can get the FED to take action.
And if we get it, then bitcoin and crypto will be off to the races. Until then we continue to remain bullish with mild caution forming due to macro indicators.
Your Pulse on Crypto,
B
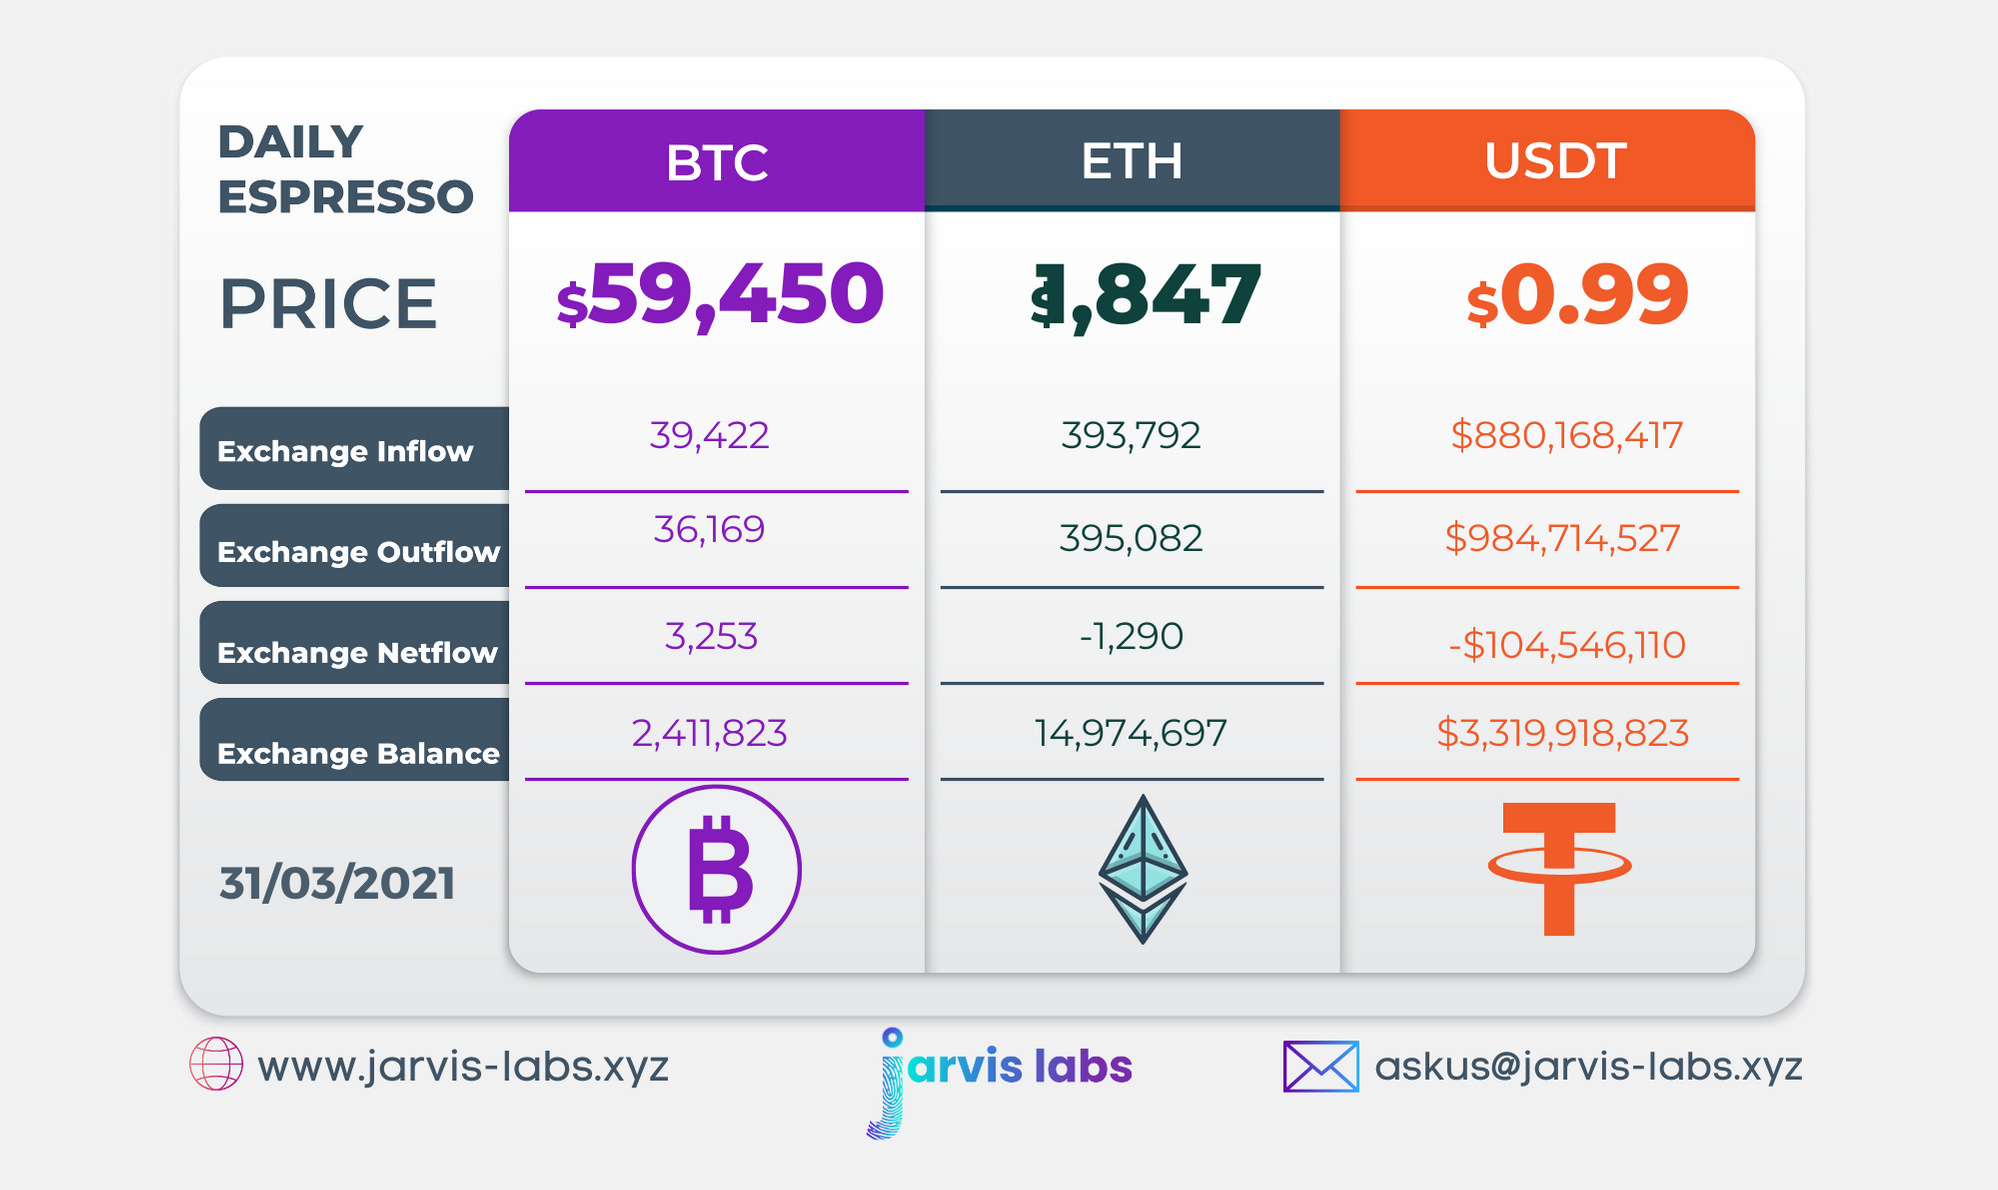
Below is our daily exchange flow data. This is a great gauge for understanding if BTC, ETH and USDt are flowing into exchange or leaving. If BTC and ETH are entering exchanges it can generally be viewed as bearish. The opposite scenario is bullish.
When USDt is flowing into exchanges it’s typically viewed as bullish. The opposite scenario is bearish.
This should only be used as a general gauge. Tagging the exact wallets these flows move into or out of helps improve the reliability of this data, which is what we do at Jarvis Labs. To date we have over 800 market mover wallets and 16 million wallets tagged all together. Consider us your on-chain trackers.