Crypto Manifest Destiny
Notes From the Lab: The Last Line of Resistance Separating BTC and ETH From the Promised Land


Crypto Twitter, except in real life.
Can you imagine that?
All of your favorite cartoon characters from our weird corner of the internet gathered in the same physical place every day.
Pepes, wassies, wolves, smols, spartans, cats, robots, and even janitors enjoying markets together in a shared asylum for the deranged.
Also imagine if instead of simply logging into an exchange to trade, we had to actually square off against our counterparties face-to-face.
If you think each day would end with a mixture of laughter, vulgarity, violence, and all-around chaos, you’re probably correct.
But as absurd as that idea sounds, it’s actually how TradFi markets worked prior to the 2000s.
It was what’s known as an “Open Outcry” system, where traders would meet daily in a pit to place orders and duke it out, sometimes literally.
In these trading pits, you’d find the who’s who of high finance, with everyone from billionaire bankers, to trading icons like Paul Tudor Jones, and upstart legends like Jimmy Jude.
Jimmy’s Twitter is often filled with hilarious war stories of his trading days in those viper dens, and there’s usually a kernel of wisdom baked in with them.
This one in particular has been on my mind recently while analyzing the crypto market:
A great line from an old trader on the NYMEX floor when I went to take an early profit on a great position I had on, still helps me stay in trades to this day. He said 'Hey kid, if you want to take the train to California, you dont get off in Chicago'.
— James Jude (@Jimmyjude13) 11:12 PM ∙ Sep 3, 2019
Reason being is that at the time of writing, Bitcoin looks weak.
It was unable to sustain momentum over $25,000 and has since rejected back down below $24,000.
Likewise, Ethereum (ETH) has also been rejected from the crucial $1,700 level we outlined in January.
This begs the question: Were $25,000 and $1,700 the best prices we should expect to see for the foreseeable future?
Should we get off the train now in anticipation of danger ahead? Or is this just another bull market shakeout?
Given the market brutality we witnessed in 2022, the Pavlovian impulse to “sell the rip” here remains a justifiable response.
However, relying on impulse over data comes with its own risks.
Risks that could leave you stranded in the Windy City this winter, rather than on the sunny shores of Malibu.
In order to discover our proper place on the map, let’s take a look at the closest thing we have to a market GPS – the data – and determine if we should take the next exit, or sit tight and prepare for the ultimate journey west to California.
Chain Check
We start with the onchain metric that kicked this rally off – the MVRV difference chart.
If you were reading in December, you’ll remember that while the majority of the market was then calling for $8,000–$12,000 BTC or lower, this metric was telling us it was time to say goodbye to the bear market.
For those of you who missed that analysis, the MVRV difference chart shows us the ratio of Bitcoin’s moving value (MV) versus its realized value (RV).
MV tells us what the average cost basis of coins being transacted are. RV tells us how much those coins were worth when last transacted.
The difference between these two prices tells us what percentage profit or loss the average Bitcoin transaction is currently realizing.
Way back in August when this indicator bottomed, the ratio was around negative-.42, which meant that the average Bitcoin transaction was then realizing a loss of 42%.
This negative score was a sign of mass capitulation, consistent with other macro bottoms we saw in 2015, 2018, and 2020.
In each of those previous examples below, we see how MVRV (pink line) recovered from deeply negative territory to rise above its 200-day moving average (MA, blue ribbon) and that action preceded large price gains for BTC (green and red line).
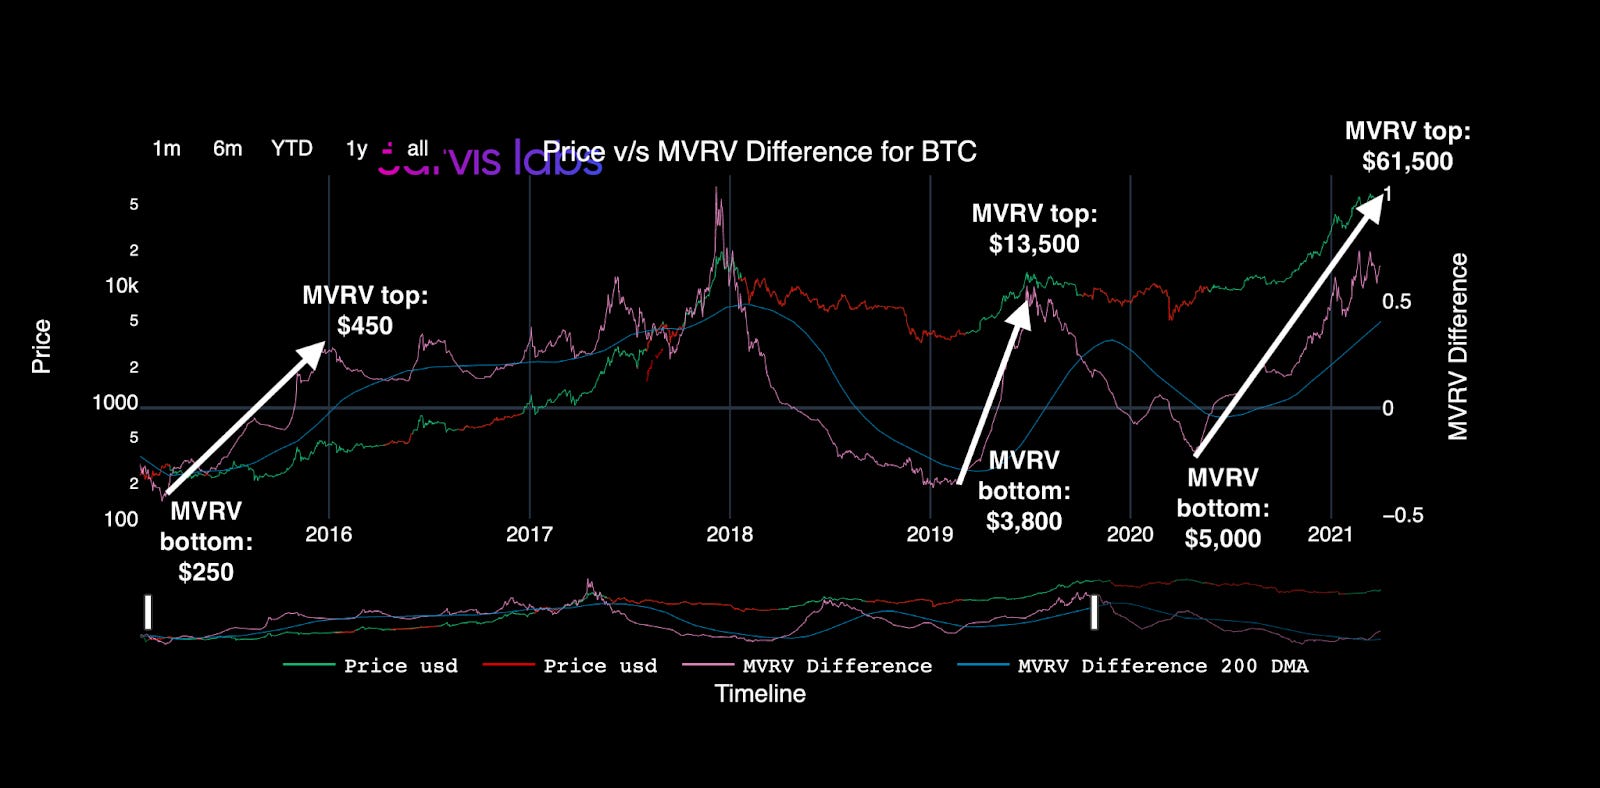
In December, we discussed how the MVRV difference reconquered its 200-day MA, and that this signal was as potent an indicator as there is in predicting the early stages of new Bitcoin bull markets.
True to form, both MVRV and BTC have been unstoppable since then, with BTC now up over 50% since the signal flashed.
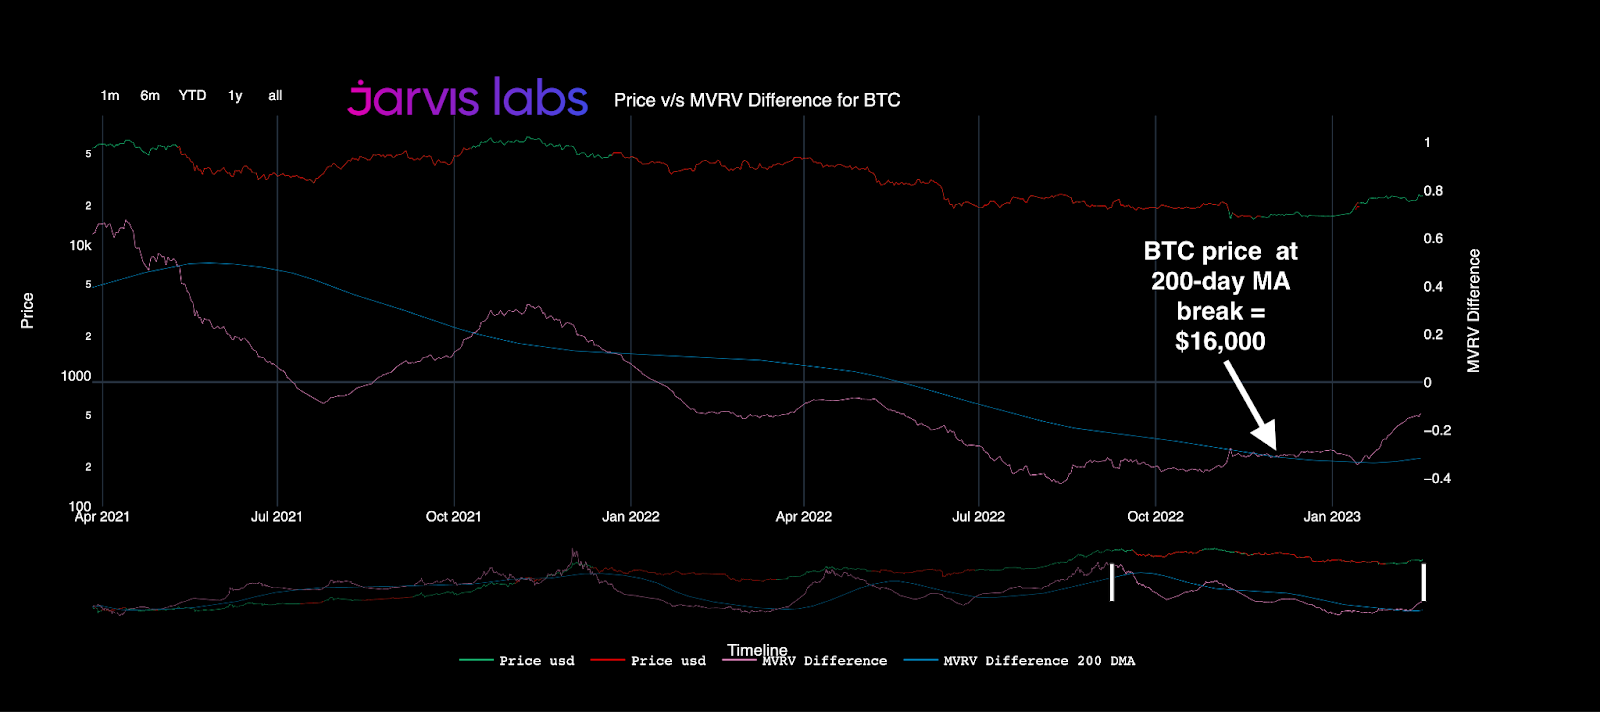
At present, this ratio sits around negative-.12, which means the average transaction is now realizing a loss of 12%.
As we discussed in December, all previous times BTC’s MVRV reconquered its 200-day MA, price appreciation didn’t stop until the MVRV ratio went from negative into deeply positive territory.
The fact that this ratio is still negative implies that we are still much closer to Chicago than we are California, which implies that this rally has much further to go from a macro perspective.
An encouraging sign for continuation, especially considering the additional confluence below.
Gary’s Goof
By now, you’ve likely read the countless headlines of SEC Chair Gary Gensler’s war of vanity on crypto.
This vendetta came to a head last week when U.S. regulators turned their Eye of Sauron onto stablecoin issuers, declaring Binance and Paxos’ Binance USD (BUSD) coin an unregistered security.
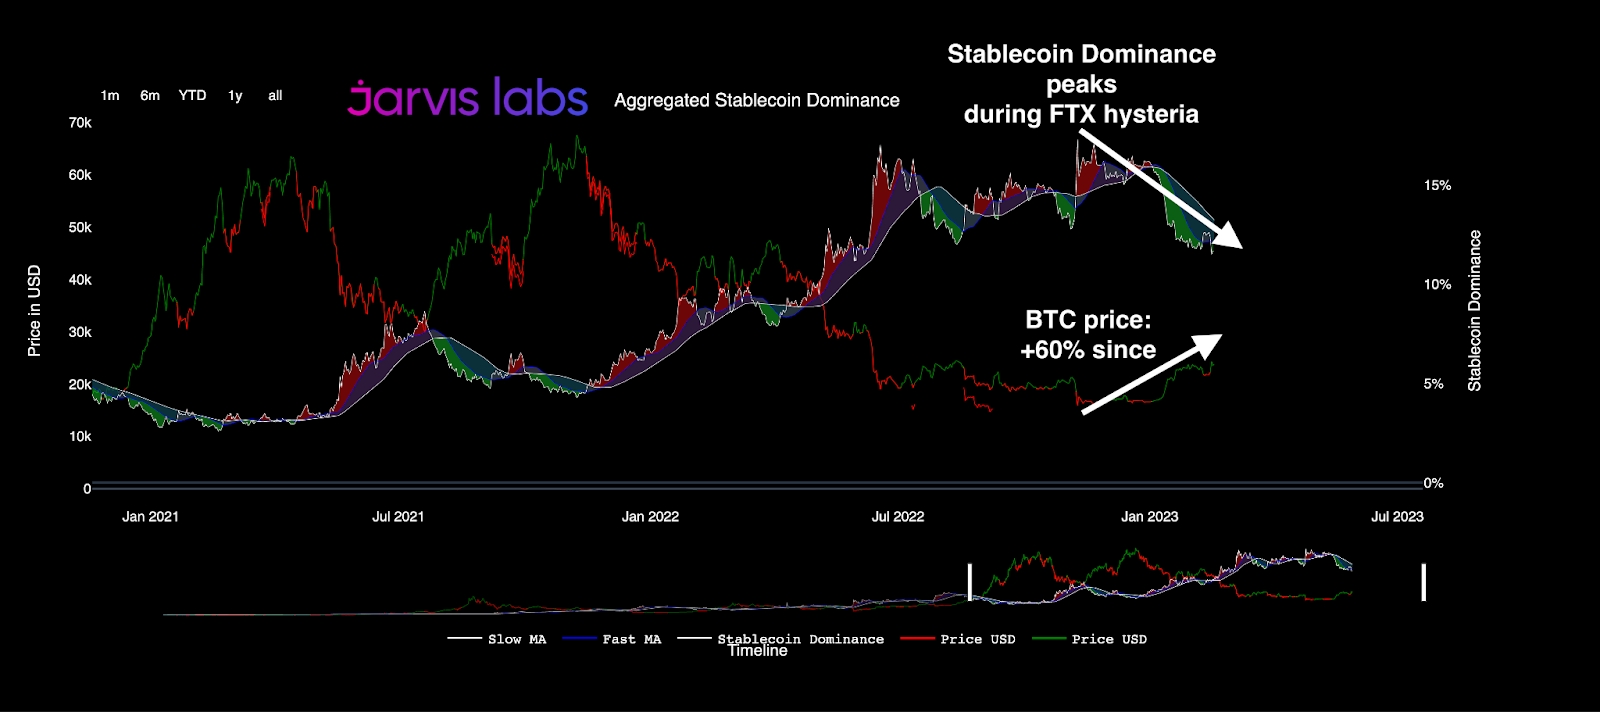
That announcement brings into focus our next chart, stablecoin dominance versus BTC price.
We first covered this back in August, when I studied the inverse correlation between stablecoin dominance and BTC price. I compared what was then ~$130 billion worth of sidelined stablecoin liquidity to a powder keg in search of a spark, due to the ease with which these stablecoins can be swapped for BTC.
In a beautiful twist of irony, the SEC’s clampdown may have lit that fuse.
As the chart below shows, a second-order consequence of the SEC’s enforcement has led to stables being converted into BTC at a record pace.
Following the fall of FTX, stablecoin dominance reached an all-time high and accounted for over 17.3% of BTC’s market cap.
Since that November peak, stablecoin dominance has fallen rapidly and now accounts for less than 11.5% of BTC’s market cap.
The reason Gensler’s war on stablecoins could continue to benefit BTC is twofold:
The primary users of stablecoins are “unbanked” digital natives, those in foreign countries who don’t have any other way to gain direct exposure to the U.S. dollar.
Stablecoins pegged to the U.S. dollar are a safe haven asset for people in places such as Lebanon, where the fiat currency has collapsed into crisis.
Eliminating the availability of stablecoins for the unbanked creates a vacuum of demand for an alternative store of value – a vacuum which BTC has been filling.
Stablecoins are backed by a combination of U.S. dollars (DXY) and U.S. Treasurys (UST).
This means that if the remaining ~$60 billion of stablecoin liquidity were to be drained out of the crypto ecosystem, it would have adverse effects on both the DXY and UST markets.
Considering that crypto has a high inverse correlation to both, any turmoil in those markets is likely to lead to much larger price increases for BTC.
And to that end, this forced drop in U.S. stablecoin demand will do no favors to a DXY which has already suffered a rough start to 2023.
Uncle Sam’s Struggle
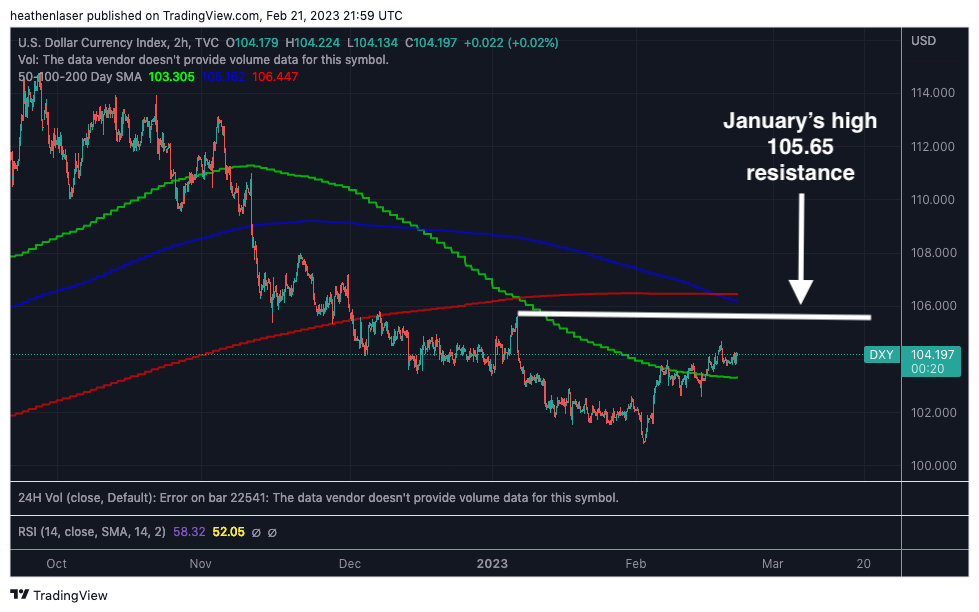
As we see in the chart below, DXY regained its 50-day MA (green line below) last week.
However, at the same time, it experienced yet another bearish crossover of its other major moving averages, as the 100-day now rests below the 200-day (blue and red lines, respectively).
This action further solidifies the technical trend change for DXY from bull to bear, which we first covered in “The King is Dead, Long Live the King.”
In order to call the top on crypto’s current rally, we will first need to see the dollar regain more lost ground and repair its technicals.
That would start with a reclaim of January’s high at 105.65 (white line below) followed by a reconquering of the 100- and 200-day MAs.
Above those lines, the “dollar wrecking ball” is back, and all markets, crypto included, are unlikely to be spared.
This is a pivotal inflection point for the dollar from a technical perspective.
If it doesn’t make a thrust toward trend recovery soon, new year-to-date lows could be on the way as soon as March, if not April.
New lows would include a trip back to the sub-100 range for the first time since the Fed began its hiking cycle in early 2022.
Should that happen, crypto would have all the fuel it needs to carry us onward to California in 2023.
Then, there will remain only one final wall for smashing.
Thank you for reading Espresso. This post is public so feel free to share it.
Break on Through (To the Other Side)
The final crucible BTC and ETH will need to overcome if they want to make it to the promised land is this descending resistance of their 30-day returns.
These charts below show us both price (top line) and 30-day returns (bottom graph), which reflect the amount of gain or loss one would have if they bought precisely 30 days prior.
You might remember us covering this specific to ETH when we discussed the importance of it breaking this 30-day return level in conjunction with $1,700.
As we see below, both BTC and ETH have been in patterns of declining 30-day return momentum since January 2021.
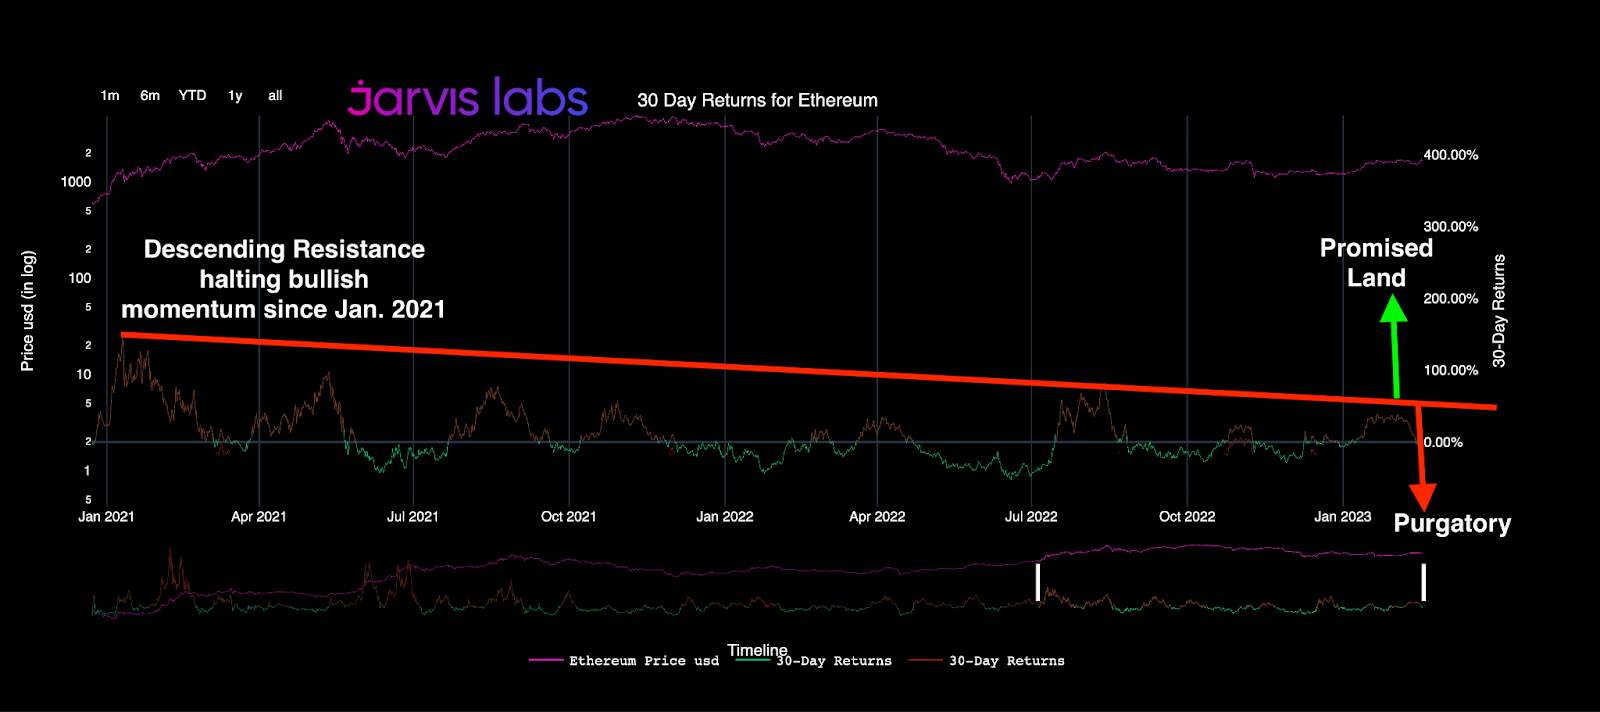
Should BTC and ETH shatter this two years’ worth of resistance now, while DXY also falls to new lows, expect fireworks to the upside for months to come.
But proceed with caution, as the opposite could also happen.
Should DXY instead recover its MAs and begin a new bull trend for itself, you can expect these 30-day returns to reject yet again and plummet us back into bear market purgatory.
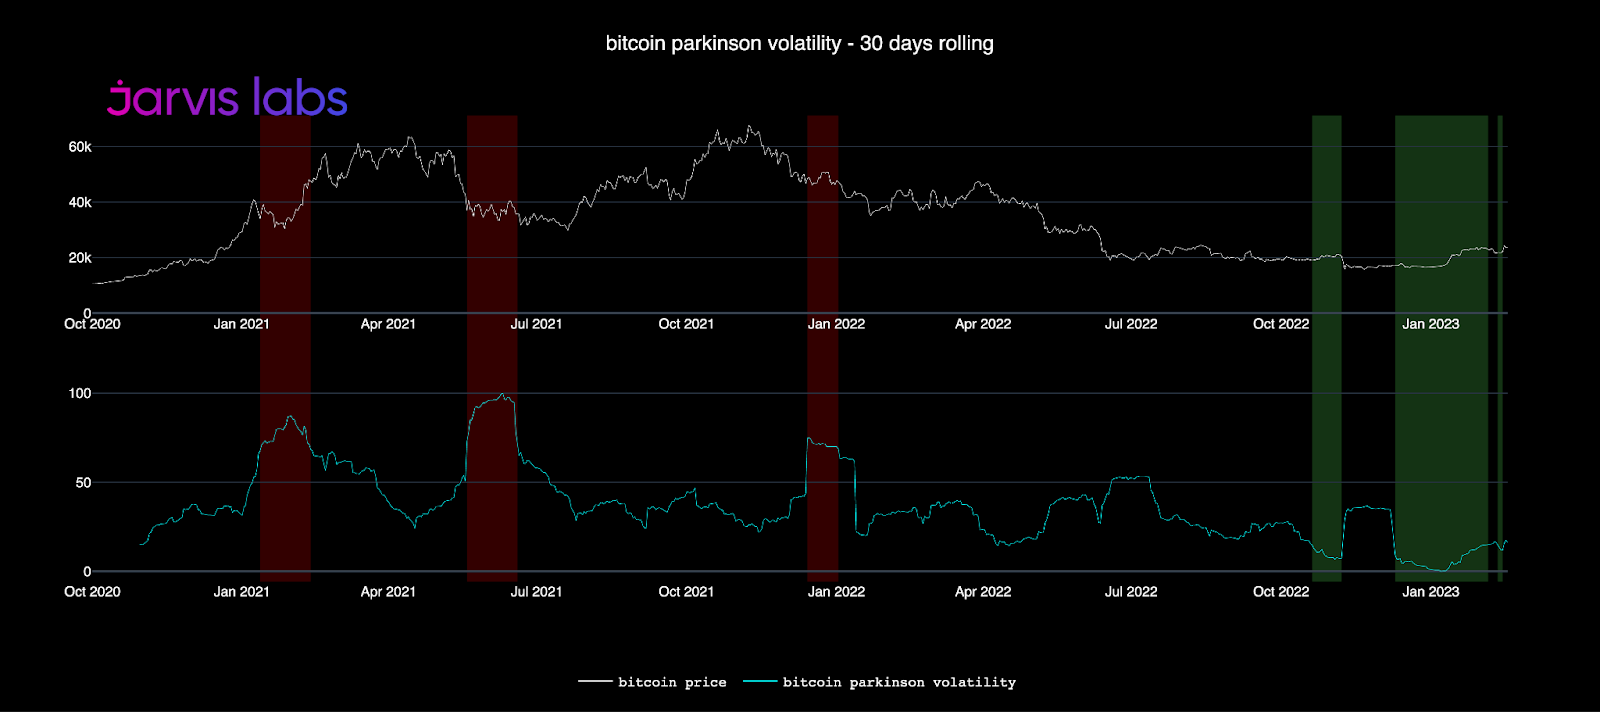
Giving more confluence to the probability of high volatility ahead regardless of direction is the Parkinson volatility chart.
For our new readers, the red lines below warn us when periods of low volatility (boring price action) are incoming, and the green lines tell us when to expect high volatility (wild price swings).
You can find a more in-depth description of it here.
What’s notable is that the chart recently streaked green again, warning us to prepare for another round of whiplash.
To sum up all the data we covered today: We’re still quite far from California.
However, don't expect the remainder of this journey to be without risks and challenges.
There will be a flat tire or two…or three…or four, and we might get stuck in a Route 70 blizzard while driving through the Rockies.
Nothing our bus can’t handle.
But the potential for sunshine and beaches on the other side of those mountains make it a worthy adventure.
My survival advice to those brave enough to continue the trek would be:
- Watch your leverage.
- Continue to monitor the key technical levels we’ve been following.
- View deep dips as opportunities so long as they are above key MAs.
- Maintain a plan for the worst – especially if DXY regains strength into month’s end.
Then, if all goes well, I will see you in the promised land.
Godspeed and safe passage,