Ethereum’s Date With Destiny
Notes From the Lab: Is Ethereum Reaching a Tipping Point?


Can you feel the mojo rising?
Ever since the success of last year’s Merge, the stage has been set for Ethereum to lead us into the next bull market.
The inevitable catalyst of ETH2.0’s new economics is something the team at Espresso has been covering closely – most recently in Mr. Lilly’s essay, where he unpacked ETH’s new supply-and-demand dynamics and the effect they could have on prices in the near future.
Analysis I found to be mind expanding.
Pulling on the thread of curiosity that essay provoked, I joined the team on a road trip last weekend (pictured above) where I sought out to learn more from Ben.
After we listened to The Doors album L.A. Woman (1971) a few times over, we rotated to a podcast featuring fund manager Hal Press, where he said: “Crypto is a game of positioning for narratives before they even exist.”
Pairing Ben’s analysis with Hal’s insight helped me better understand why analysts around The Lab spend so much time digging into fundamentals.
Something I didn’t fully understand initially, but as we’ll see today makes a powerful partner when paired up with technical and on-chain analysis. What Mr. Lilly and co. have slowly helped me realize is that the biggest moves happen when fundamentals pair up with technicals.
And after analyzing the full spectrum of ETH metrics in this new light, I’m starting to grasp what everybody is “tripping out” about when it comes to ETH’s prospects in 2023.
Today, let’s take a look at the confluence of these metrics + fundamentals, and see why they’re both pointing to the same direction on a macro timeline.
And that direction is UP.
Supply Sinkhole
Way back in ancient history (pre-FTX) during October 2022, we shared this essay about the growing phenomenon of liquid-staked derivatives (LSD) use within crypto.
In it, we mentioned how LSDs could eventually become the neo-DeFi Food Tokens of 2020 that helped set off that cycle’s bull run.
This is because the more LSDs are used, the more ETH becomes staked to the network, and thus illiquid – unable to be sold and suppress price.
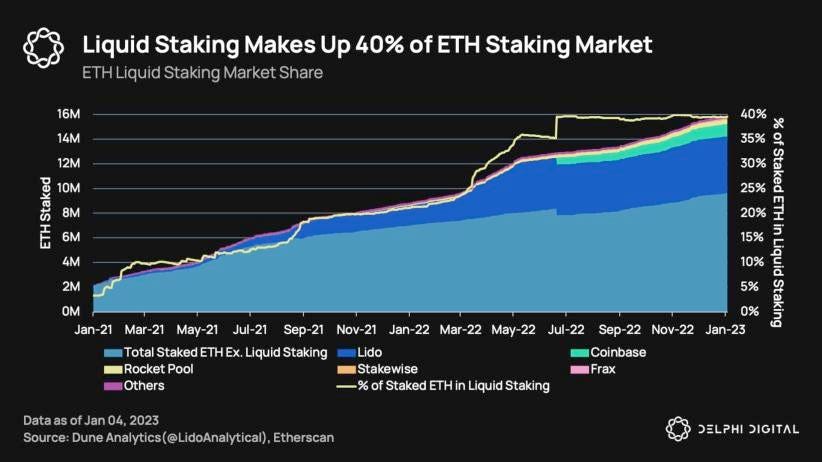
Since then, the narrative has certainly taken hold. We are beginning to see ETH Staking Wars in the headlines as LSD adoption has skyrocketed, and these derivatives now account for 40% of all ETH staked.
What a long, strange trip it’s been.
The effects of this large amount of ETH being removed from exchanges in favor of staking and staking services is also visible when we view our own on-chain metrics.
The chart below is a whale divergence chart, which measures “whale” (wallet addresses holding more than 10,000 ETH) buying patterns versus the rest of the market, labeled as “fish” (wallet addresses holding less than 10,000 ETH).
You can find this data on our TARA-NFT dashboard.
The red dots you see below indicate periods of whale-driven accumulation, and the green dots indicate fish-driven accumulation. Blue dots indicate both selling.
Focusing on the red, we can see whales were in aggregate accumulating at nearly every price level in 2022 at an astonishing pace, undeterred by the market-wide turbulence.
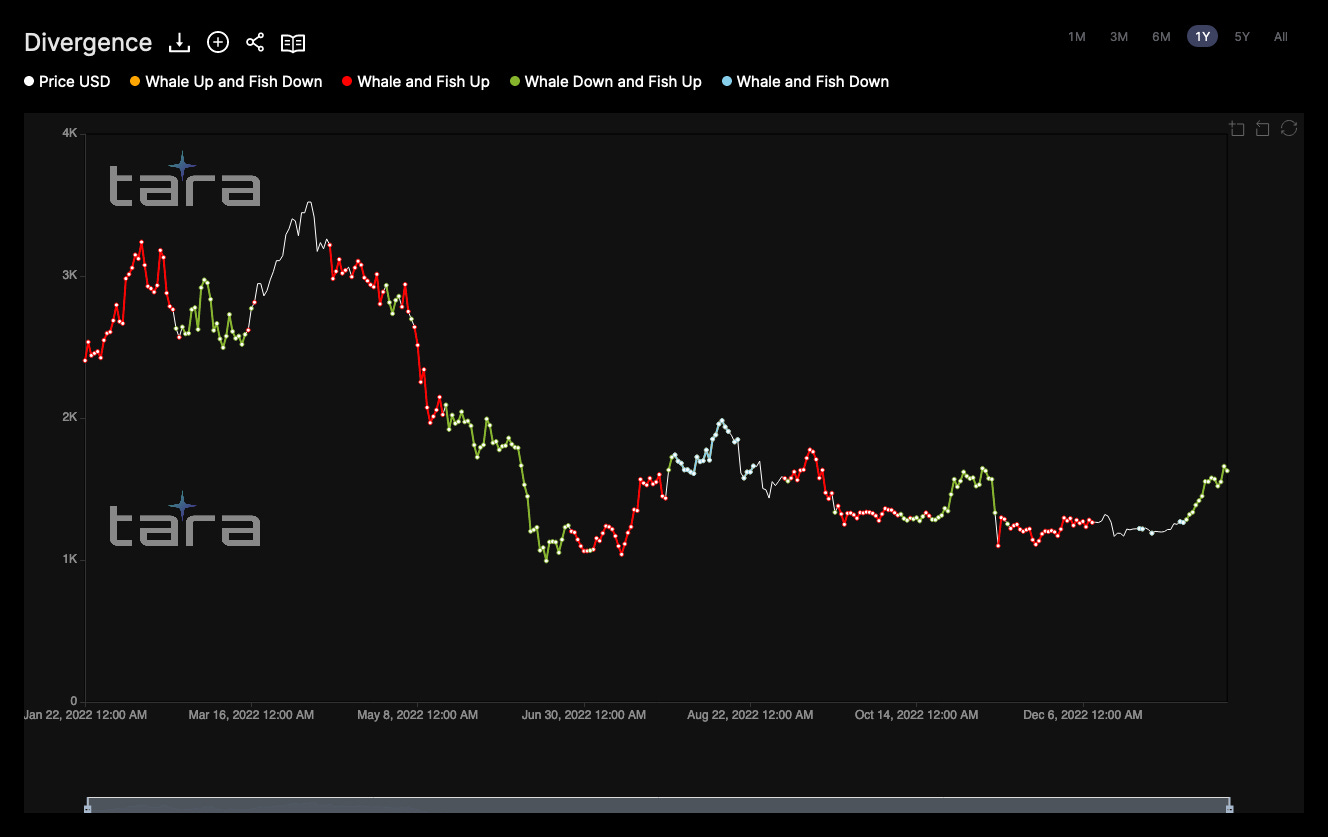
Is it possible these market movers knew something we didn’t in terms of increased adoption ahead in 2023?
That seems likely.
Adding confluence to the chart above is what we call the “ETH Exchange Whale Ratio” found below.
The ratio represents the supply owned by ETH’s largest whale wallets versus the ETH supply owned by crypto exchanges. The higher the ratio, the less ETH there is available to be sold on exchanges, which has historically led to much higher prices.
On the chart:
- Purple line = cumulative wallet balance of ETH’s top whales (currently ~24.7 million ETH)
- Green line = ETH price
- Tan line = cumulative ETH balance on top exchanges (currently ~7.3 million ETH)
- Red line = exchange whale ratio (currently 3.25)
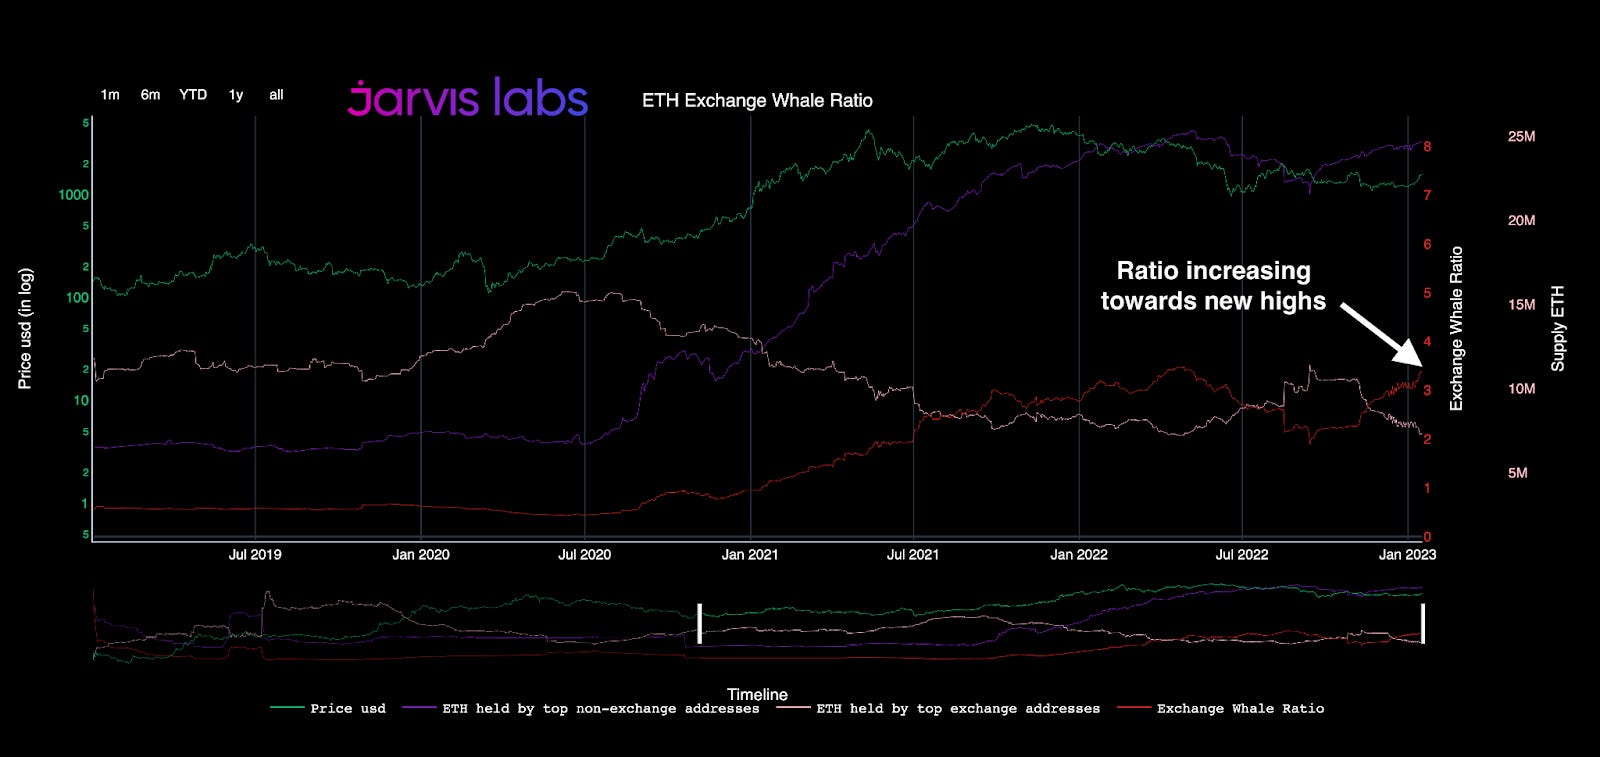
What’s notable about this ratio is that it is now in an uptrend for the first time since early 2022.
Back then, ETH was trading above $3,500 (green line), and the year’s disasters were still yet to unfold.
From the looks of the red line representing the ratio, it appears that there was steady accumulation throughout 2022, which is now primed to send this ratio (and prices) higher.
This is very similar to what we discussed last week in regards to Bitcoin’s 2022 accumulation pattern looking more and more like a “concrete floor” of support.
What’s more notable is the last time we saw an expansion of this ratio was during ETH’s last cycle of fundamental adoption.
Back between mid-2020 to late-2021, whales stepped on the gas and drove this ratio up by over 10x (from under 0.50 to over 5.00) in about 18 months.
Not coincidentally, ETH’s price also entered a new bull market, as it rose by nearly 20x, from $225 to a cycle high near $4,800.
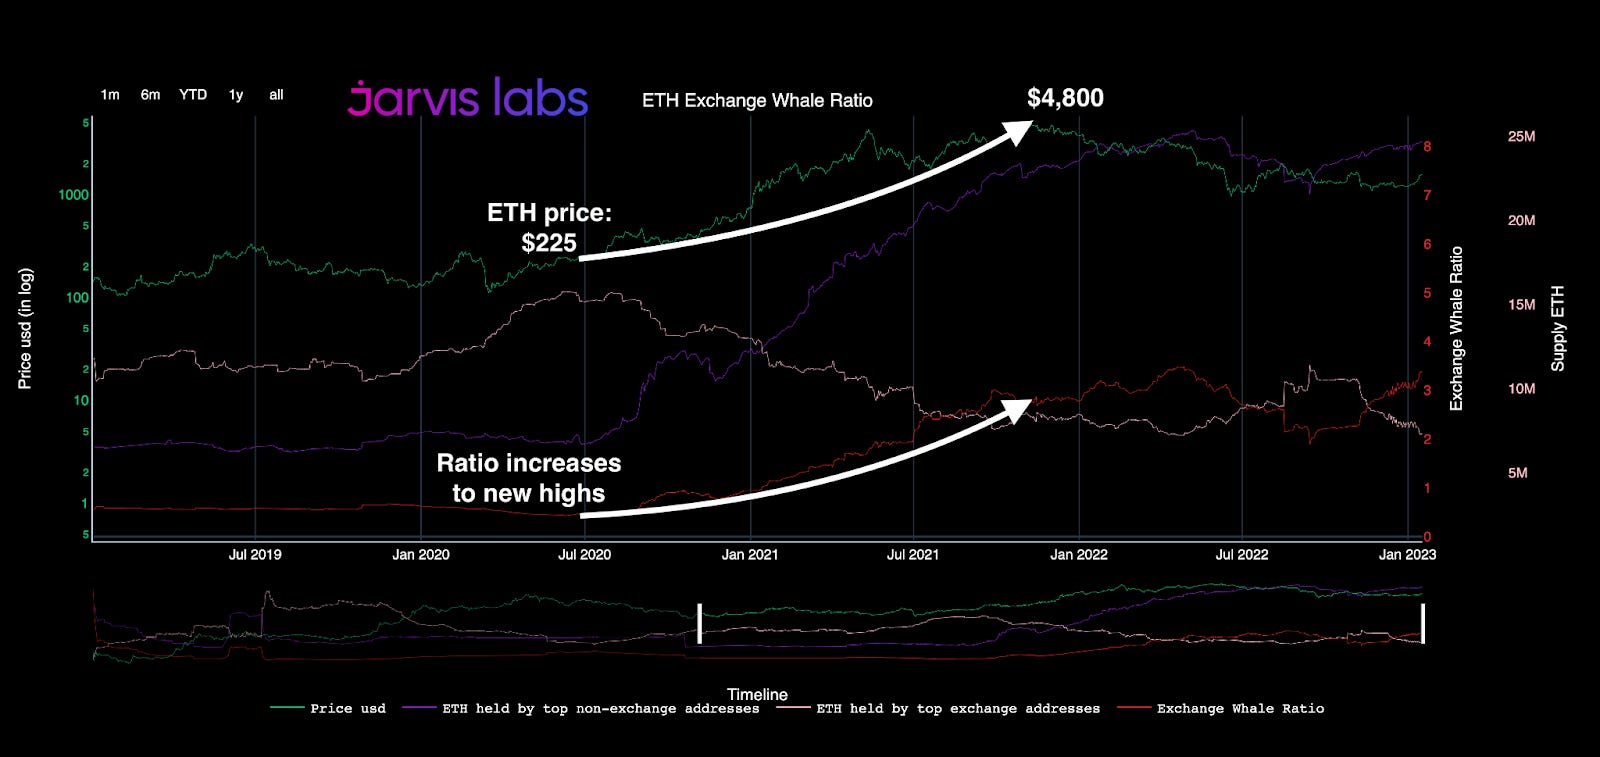
Could our current wave of adoption lead to similar results over the next 18 months?
Likely not to the tune of 20x, however, these accumulation charts are not the only indicator signaling that major macro bullishness could be on the horizon…
Rusty Cage Revisited
A couple weeks back, we reviewed the market’s technical structure heading into 2023 and discussed the importance of ETH reconquering its 200-day moving average (MA - red line below).
Well, shortly after, it did just that. ETH demolished its technical blockade with impressive strength (as seen in buy volume, green bars below the price chart). Remember, trends tend to follow strong price movements fueled by high volume.
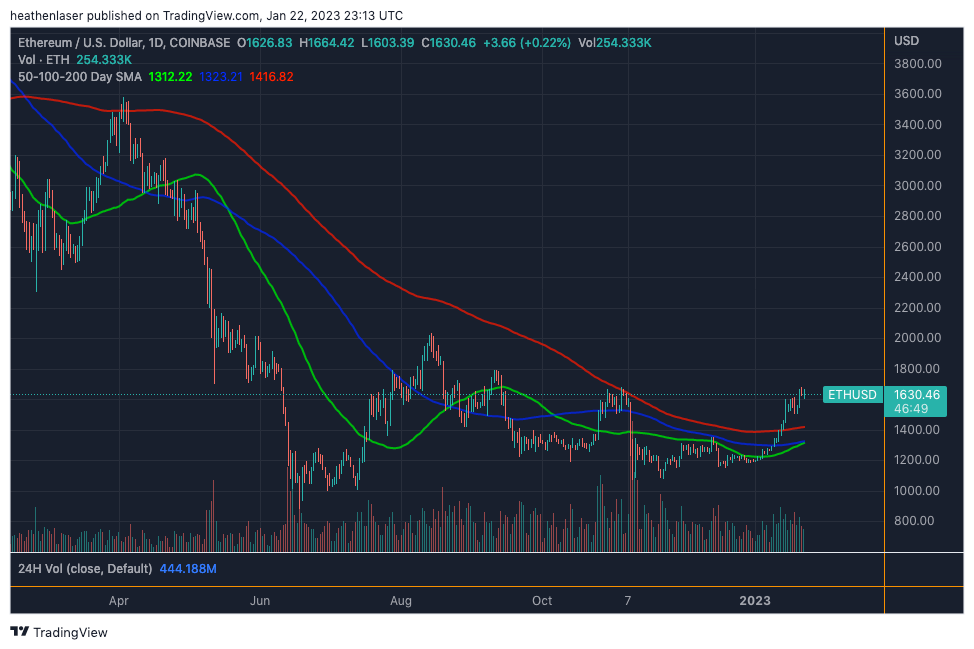
What the ETH faithful would like to see now is either continued consolidation in this $1,500-$1,600 range, or a retest and confirmation of the 200-day MA level (~$1,400) to confirm its flip from resistance to support.
Either of those scenarios would set price up for a date with destiny at the infamous $1,700 level.
A crucial level of technical resistance we unpacked at length back in November, just prior to FTX’s collapse. There, we discussed the U.S. Dollar Index (DXY) looking ready for mean reversion, and what we called ETH’s rusty cage, a reference to this long-held, sub-$1,700 range.
At long last, ETH finally looks primed to break its rusty cage and run.
Reason being is that the criteria for macro bullishness (which we outlined in this thread from July) are now starting to be fulfilled.
These charts below show us ETH’s price (top line) and its 30-day returns (bottom graph), which reflect the amount of gain or loss one would have if they bought precisely 30 days prior.
Below, we see how the 30-day trend was stuck under resistance for two years, from mid-2018 until mid-2020. But once it broke through and regained that momentum, it coincided with price shattering through the key resistance level at $400.
Following that breakout, price then rose by an additional 10x-plus, topping out over $4,300 just nine months later.
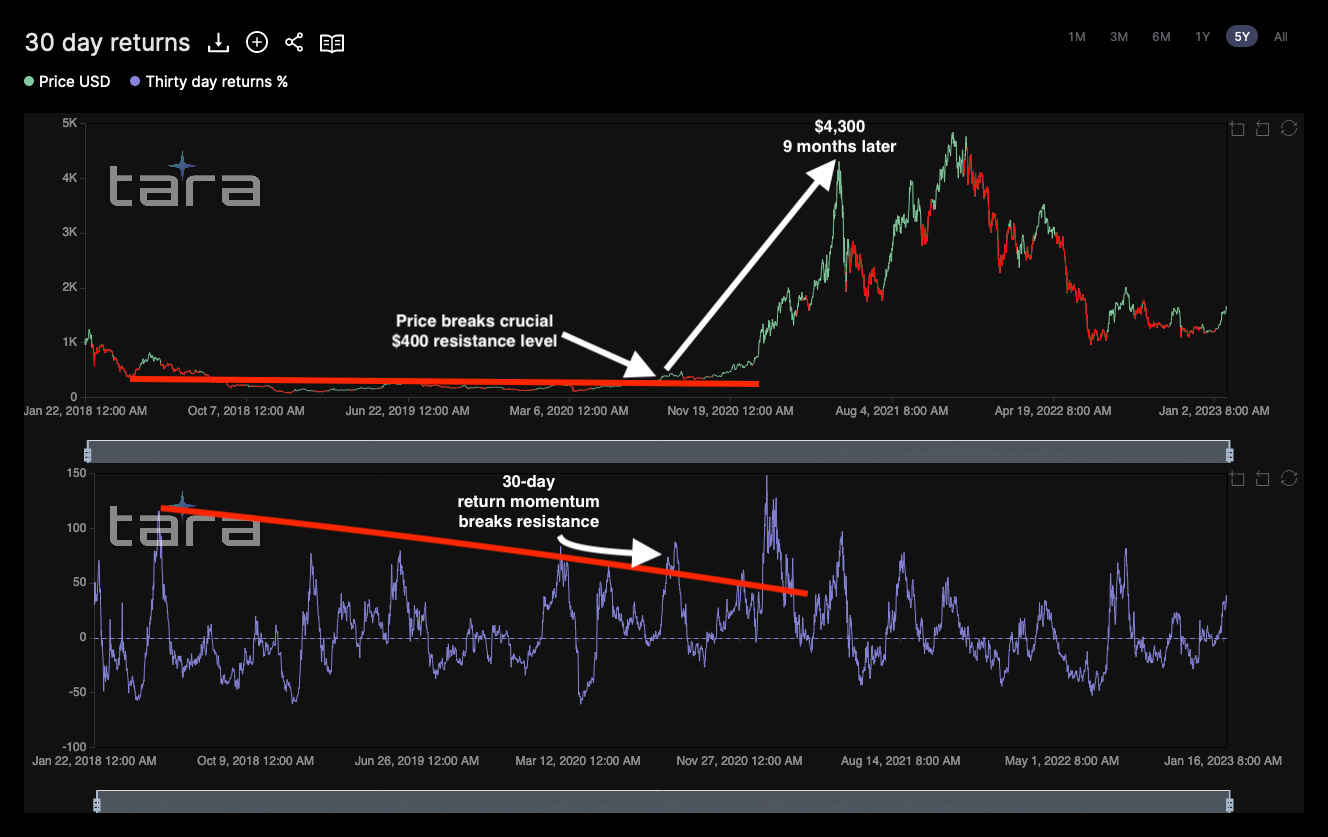
When we compare that fractal to our current structure, the similarities are quite obvious.
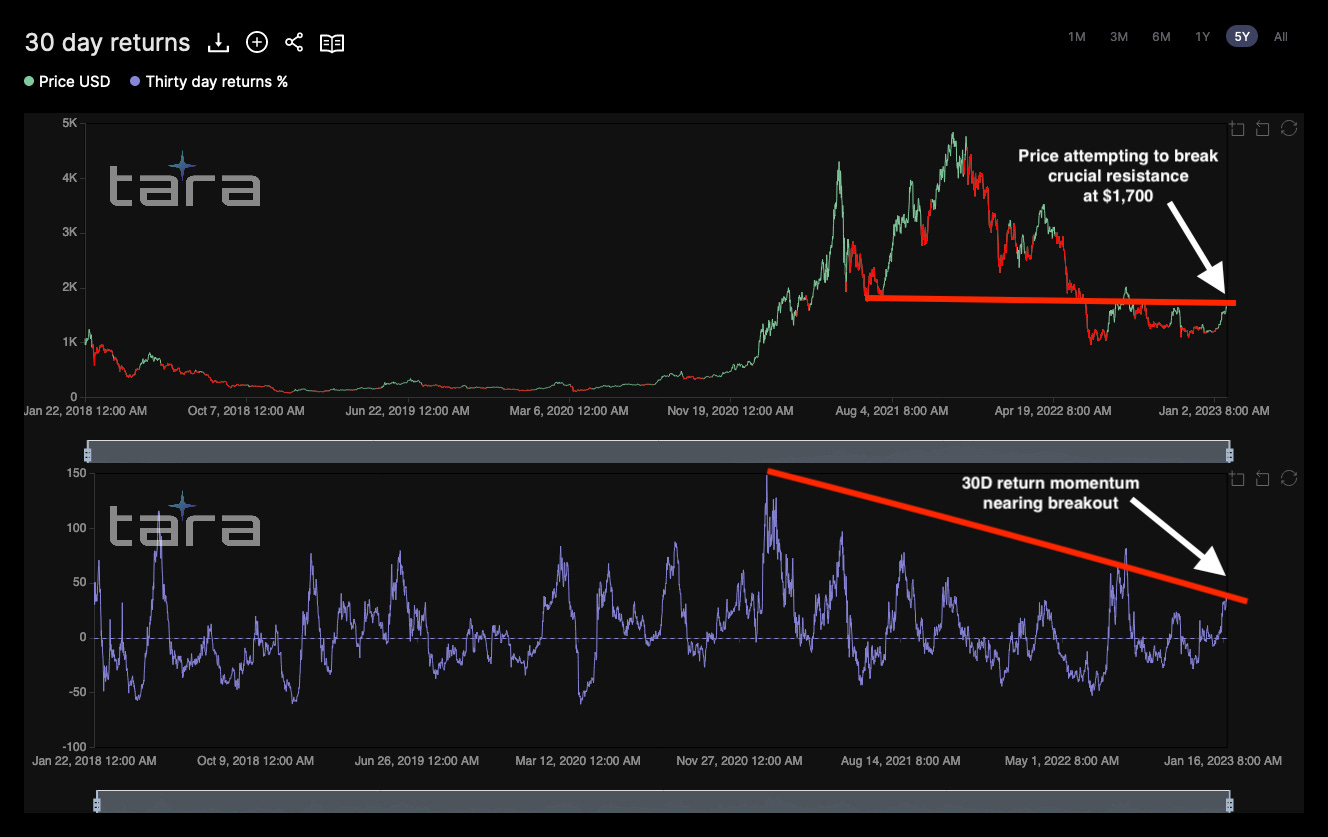
For over two years now, ETH has been experiencing diminishing 30-day return momentum.
That’s in addition to being trapped under $1,700 for much of 2022.
Looking below, however, it appears both of these resistance points are primed to break in 2023, as their major trend lines are now being threatened.
That said, don’t expect ETH’s triumph to be instant. Especially with major macro events such as the February 1 FOMC just around the corner.
This battle over $1,700 will likely be one that persists between buyers and sellers for a while, and if it breaks, will still require a backtest or two to confirm. If ETH can eventually prevail over it, however, the momentum that could generate for the remainder of 2023 and beyond would be hard to overstate.
Especially when we factor in the confluence of bullishness in these technicals with the on-chain accumulation, Mr. Lilly’s article on changing supply/demand dynamics, and parabolic use of LSDs.
While it’s unreasonable to expect 2023 to be a year of 10x-plus ETH gains, there are plenty of numbers in between 1x and 10x that I think Ethereum bulls would be perfectly content with earning this year.
What do you guys think?
Leave a comment or let me know on Twitter.
Your friend,


