A Powder Keg of Stablecoins
Notes from The Lab: The Liquidity Nobody is Talking About


I awoke from a tap on my shoulder.
“You need to go home.”
The flashlight was jarring my sleepy eyes… As I gathered my thoughts the raspy voice of a disgruntled security guard continued on again...
“You can’t sleep here.”
Seems it happened again. After work I headed to the library to do some research. And passed out only to wake up after the building locked its doors.
That was the fourth time in six months. How embarrassing.
I packed up my things and headed home on my bike. The next morning I reviewed the notes I had from my research. As I read the underlined part: “Europe pre-World War 1 = powder keg. Stablecoins = powder keg” I remembered my train of thought...
You see, my night of study was focused on the similarities between The Balkan Wars and Tether….and before you write me off as a kook for saying that, please allow me explain.
A literal powder keg is a tightly packed barrel of gunpowder which is highly explosive.
Before modern bullet cartridges were created around 1870, gun powder had to be transported in these barrels. This was extremely dangerous as the slightest accidental spark could send the kegs into a dynamite style explosion.
This powder keg phrase has been used often to explain history and markets over the last 150 years. It references times when there is high tension brewing beneath the surface, followed by an unforeseen spark that creates the BOOM that places the event in the history books.
In the case of 1914 Europe, the assassination of Austria’s Archduke Franz Ferdinand was the spark. His murder exploded the continent’s powder keg into what became World War 1.
In the case of crypto markets today, stablecoins are the powder keg, and Bitcoin’s price only needs a spark to realize its boom moment.
Let me show you what I mean, But first…
Hi everyone, my name is JJ - the night shift janitor here at Jarvis Labs.
Once I started working here I noticed the professors of Jarvis Labs frequently leaving up charts, reports, and even equations on the whiteboard once they finally left in the middle of the night. The stuff seemed pretty important, so I started interpreting these things for myself.
It wasn’t long before I realized it was like trading cheat codes. And lucky for you, my friend is sick of hearing me talk about it.
Every week I will try to share the coolest and most exciting thing I find laying around the halls of Jarvis Labs. I hope you like it and follow me because if I get 1,000 followers on Twitter (@JLabsJanitor) my friend will buy me a pizza.
So be sure to click the subscribe button below to get a weekly “Notes from The Lab” sent to your email.
The Chart
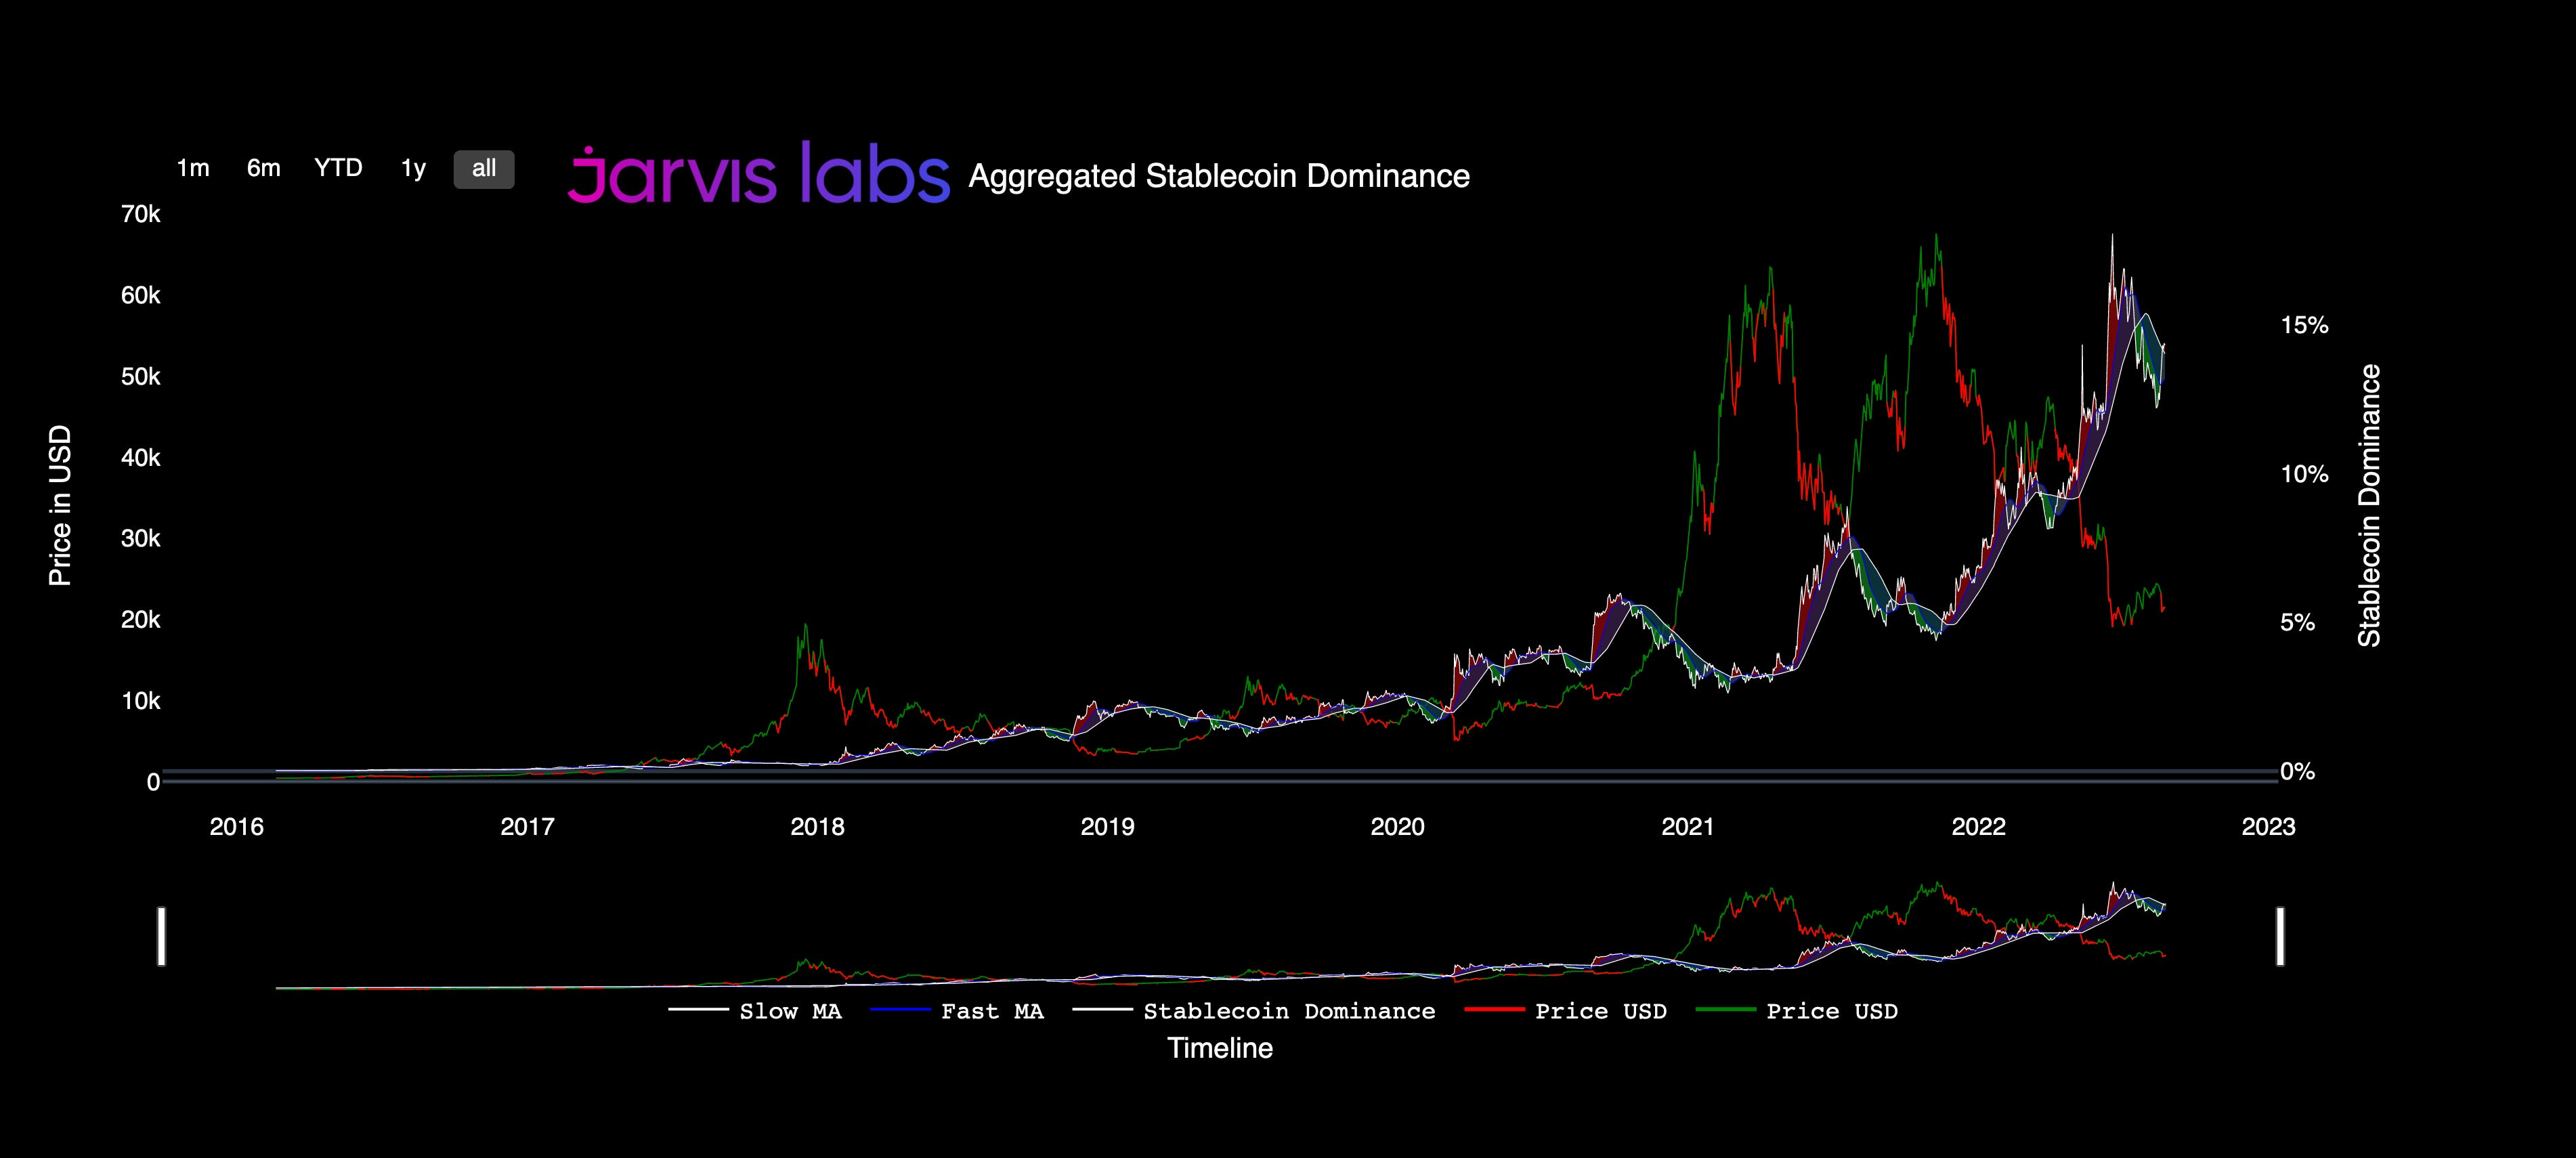
The chart that caught my eye at The Lab this week was the amount of crypto’s market cap is attributed to stablecoins (white line) compared to the price of BTC (green and red line).
The rise of the white line shows us when the percentage of stablecoins like Tether, USDC, and DAI have grown or fallen relative to BTC in recent years.
As of today’s writing they’re worth nearly $130 billion.
It’s a figure that is up over 2600 times in just 4 years!
To help us make more sense of why the current amount of stables can have an explosive impact on BTC’s price, I compiled some case studies and uncovered quite an interesting pattern…
But first a little bit of stablecoin history.
The Beginning
We can break down the growth of stablecoins into four distinct periods over the last five years.
The first periods was pre-history. This was prior to 2014 where stablecoins were not around. And if there were any stablecoins before then, there is not much history written on them.
This meant to buy bitcoin you needed to transact actual dollars. This required time consuming money transfers, sending dollars to what felt like a P.O. Box scam, or mine the currency from the blockchain.
It felt like buying gold coins from an advertisement you read in a catalog, but worse. You could use Liberty Reserve Dollars to buy BTC after waiting 3-5 days for settlement on a trade. This method also required using subpar businesses like an exchange in Costa Rica that only needed a name and e-mail to operate.
The second time period I’ll call ancient crypto history. This was 2014 to 2017. Stablecoins were starting to emerge and the process of buying and selling Bitcoin as we know it today was still much different. Stablecoins were scarcely used nor trusted. There was not any meaningful amounts of money being stored in these tokens.
It wasn’t until the end of 2017 bull run that this changed.
This third leg of stablecoins growth can be seen in the chart below.
In 2018 USD stablecoins began to earn a role as a highly liquid trading pair vs BTC. This meant once price began to collapse, users started to trust in stablecoins. The white arrow shows how this kicked off the growth of stablecoin’s dominance.
This led to their 12x growth in less than a year as more and more trade pairs began to offer a stablecoin. It was no longer altcoins to ETH or ETH to BTC. Many of the top altcoins started to trade with stablecoins.
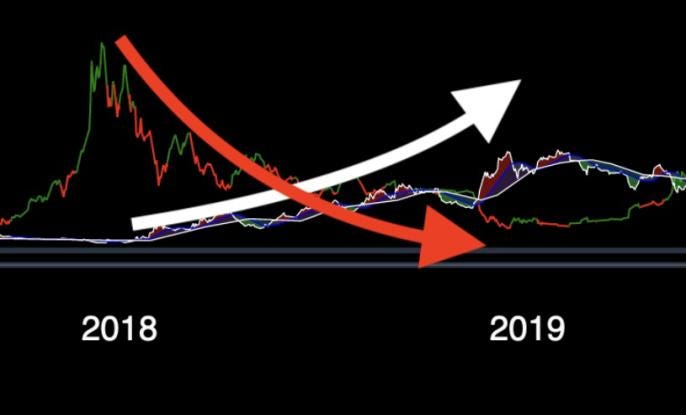
The growth was so consistent that even in the crab market in the second half of 2018 where BTC went sideways, stablecoins still trended higher.
The fourth period was the advent of DeFi during the summer of 2020. We can thank the start of yield farming… Suddenly the need to have a representation of the U.S. dollar was not just a preference, it became a requirement to use onchain solutions with DeFi.
Those developments ballooned stablecoin dominance to nearly 20% this evening.
The Pattern
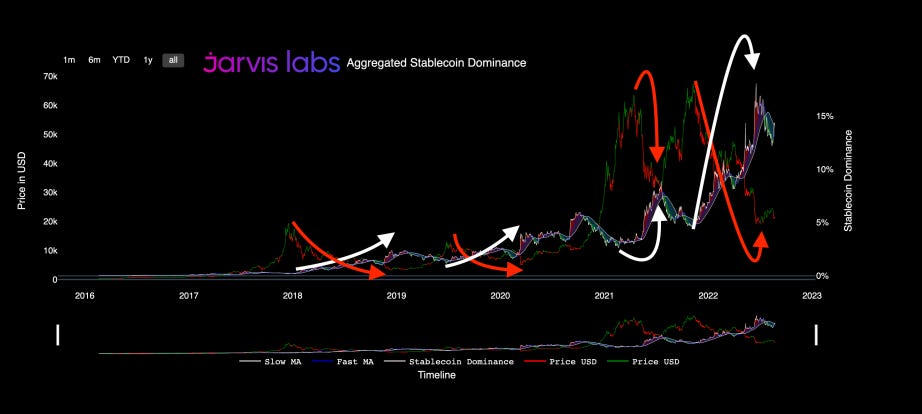
When we zoom back out on this chart we can see that BTC price and the stablecoin dominance ratio have been extremely inversely correlated since 2018.
Meaning as one falls, the other rises, and visa versa.
On the first chart below, the red arrows show instances of major price crashes. Unsurprisingly, each one has syncs up precisely with large rises in stablecoin dominance.
The tallest white arrow shows this ratio hitting new ATHs near 20% this past June, a far cry from the fraction of a percent in 2018.
More importantly, this shows us that most who’ve sold throughout 2022 haven’t off-boarded to fiat bank accounts, but are instead holding their money in stablecoins… A powder keg.
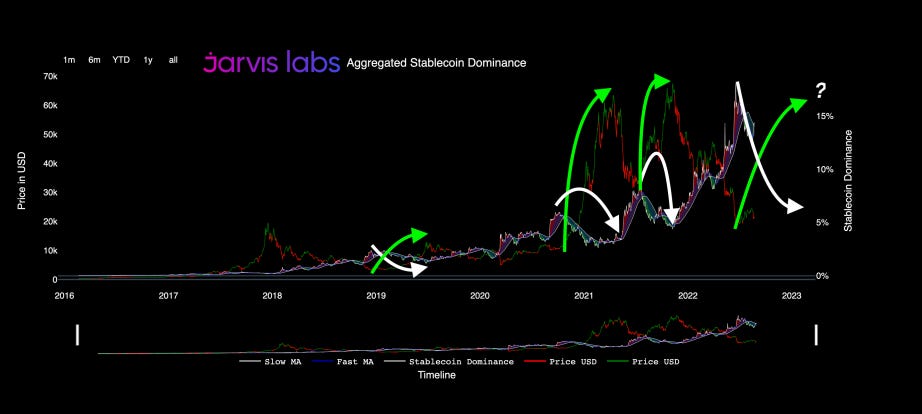
To understand why that is, here are the past instances of BTC price rising as stablecoin dominance drops.
Anytime BTC has had a major rally since 2017 it has acted as a vacuum for stablecoin liquidity. The green arrows show previous instances of price rising as stablecoin supply drops.
What this signals is that the next bull run will start with stablecoins being converted into BTC. No need for three days of settlement times.
Which is why the current meteoric rise in stables could eventually unleash an unfathomable amount of buying power on to the market when/if BTC reaches attractive enough price levels.
Of course, this does not mean things will suddenly switch tomorrow. We still need to see demand pick up as Mr. Lilly seemed to touch on with his Market Update.
If we do see demand pick up, there’s over one hundred and thirty billion dollars currently sitting on the sidelines already inside crypto’s ecosystem. Especially Ethereum’s.
All of it just one spark away from being converted into instant buying power.
What type of catalyst event that spark could be though, I have no idea.
But I think just like World War 1, in hindsight it will seem so obvious.
Thank you for reading. If you can, please leave a comment with your thoughts, suggest any topics you want me to ask the guys at Jarvis Labs, or even message me to say hi on Twitter @JLabsJanitor!
Your friend,
JJ


