Chop Chop
The winning IV crush and end of May trend continues.


As the New York trading session began, I saw the setup once again.
The impasse in the options market was there, again.
It was Monday, last week, and I went ahead and alerted Ben Lilly what I saw.
He asked a few questions based on what he’d been hearing over the weekend, and within minutes we sent out an update to Jlabs Digital clients.
The takeaway was simple, be prepared for more chop throughout the week.
Here’s that week old update below:
“We are encroaching on a dealer short gamma pool between 66k-75k as shown below on the GEX chart. The red bars indicate short dated call options that market makers are currently short. If price remains above current prices for long, dealers will have to hedge.
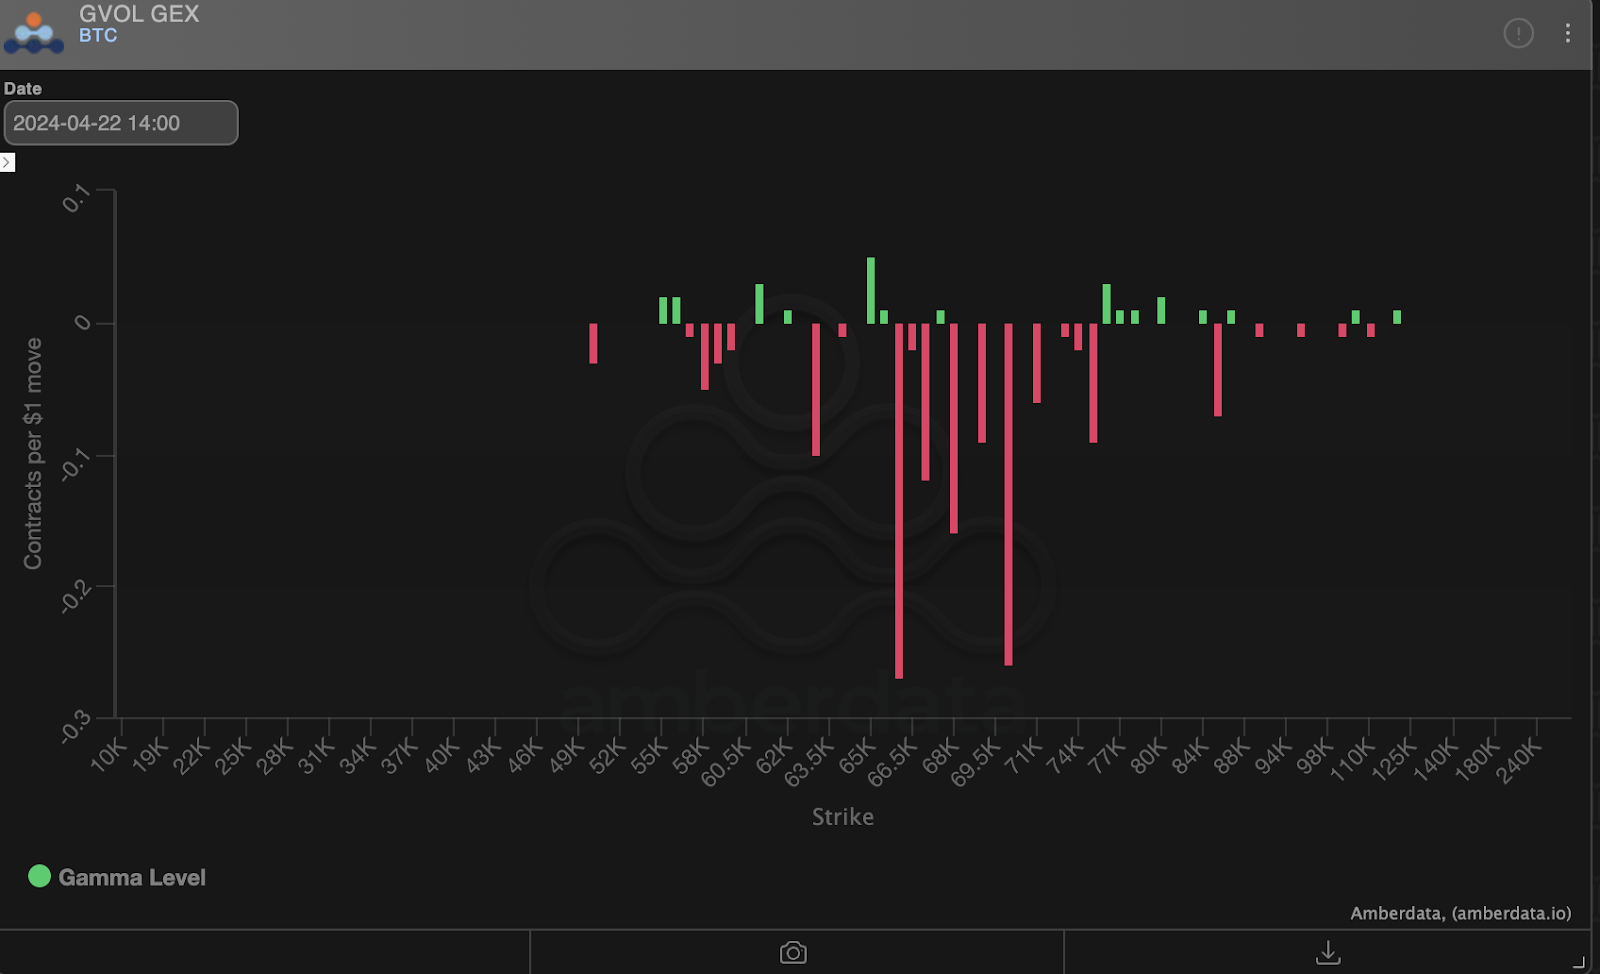
The last time we saw a gamma profile like this was in February, when dealers were short 54k-60k strikes, which fueled the ATH rally. Continued squeeze from here is an outlier scenario, but one to be aware of *if there’s a spot buying catalyst this week*.
We give the above scenario a 10-20% chance of playing out.
More often than likely we get a repeat of last week. Which is, dealers were short puts. And instead of price testing out negative gamma to the downside, we got chop. This made all those who were buying puts have worthless contracts.
This is why if you’re already long, this is not a bad place to hedge/take a bit of profit for the week.”
The result of last week - chop.
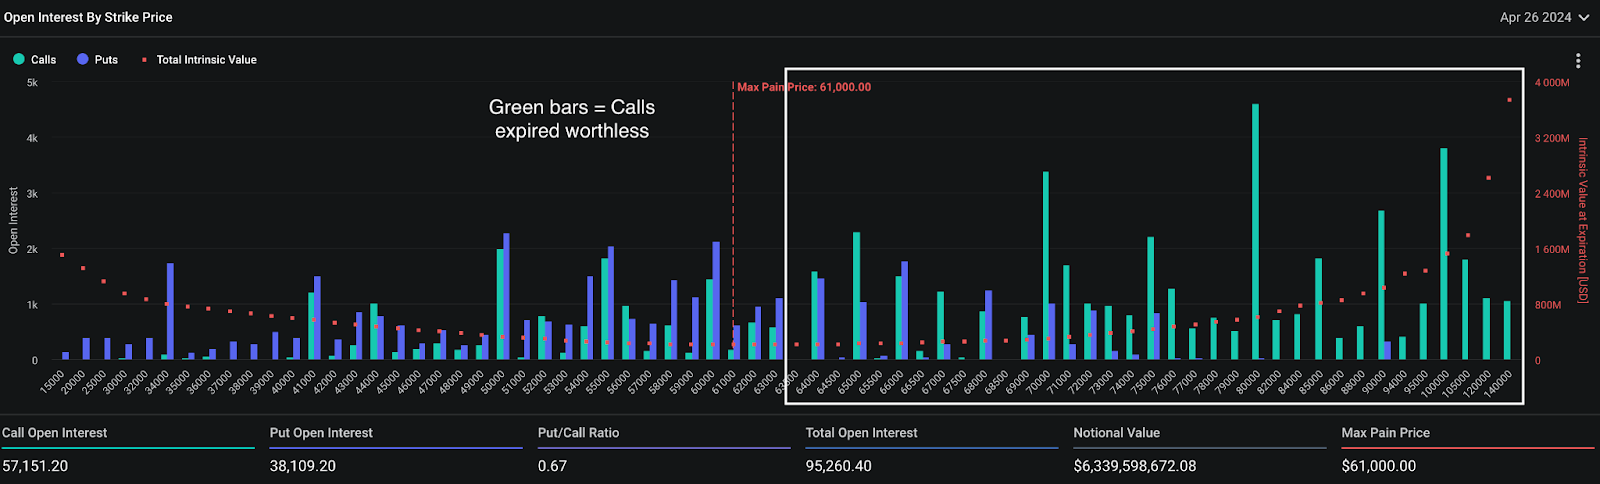
As we see on the chart down below, this past week’s end of April expiry was massive with over $6 billion in notional bets.
The majority of this notional open interest was owed to call buyers who rushed in last month due to a mix of pre-halving hype and the FOMO caused by March’s rally to new all-time highs.
This open call interest above $65,000 was what options dealers were trading against, and absent a sudden catalyst, it seemed unlikely they were going to get squeezed into such a massive options expiry (OPEX).
Notice below how the majority of calls (green bars) ended up expiring out of the money and worthless ....guess who wins again, the house.
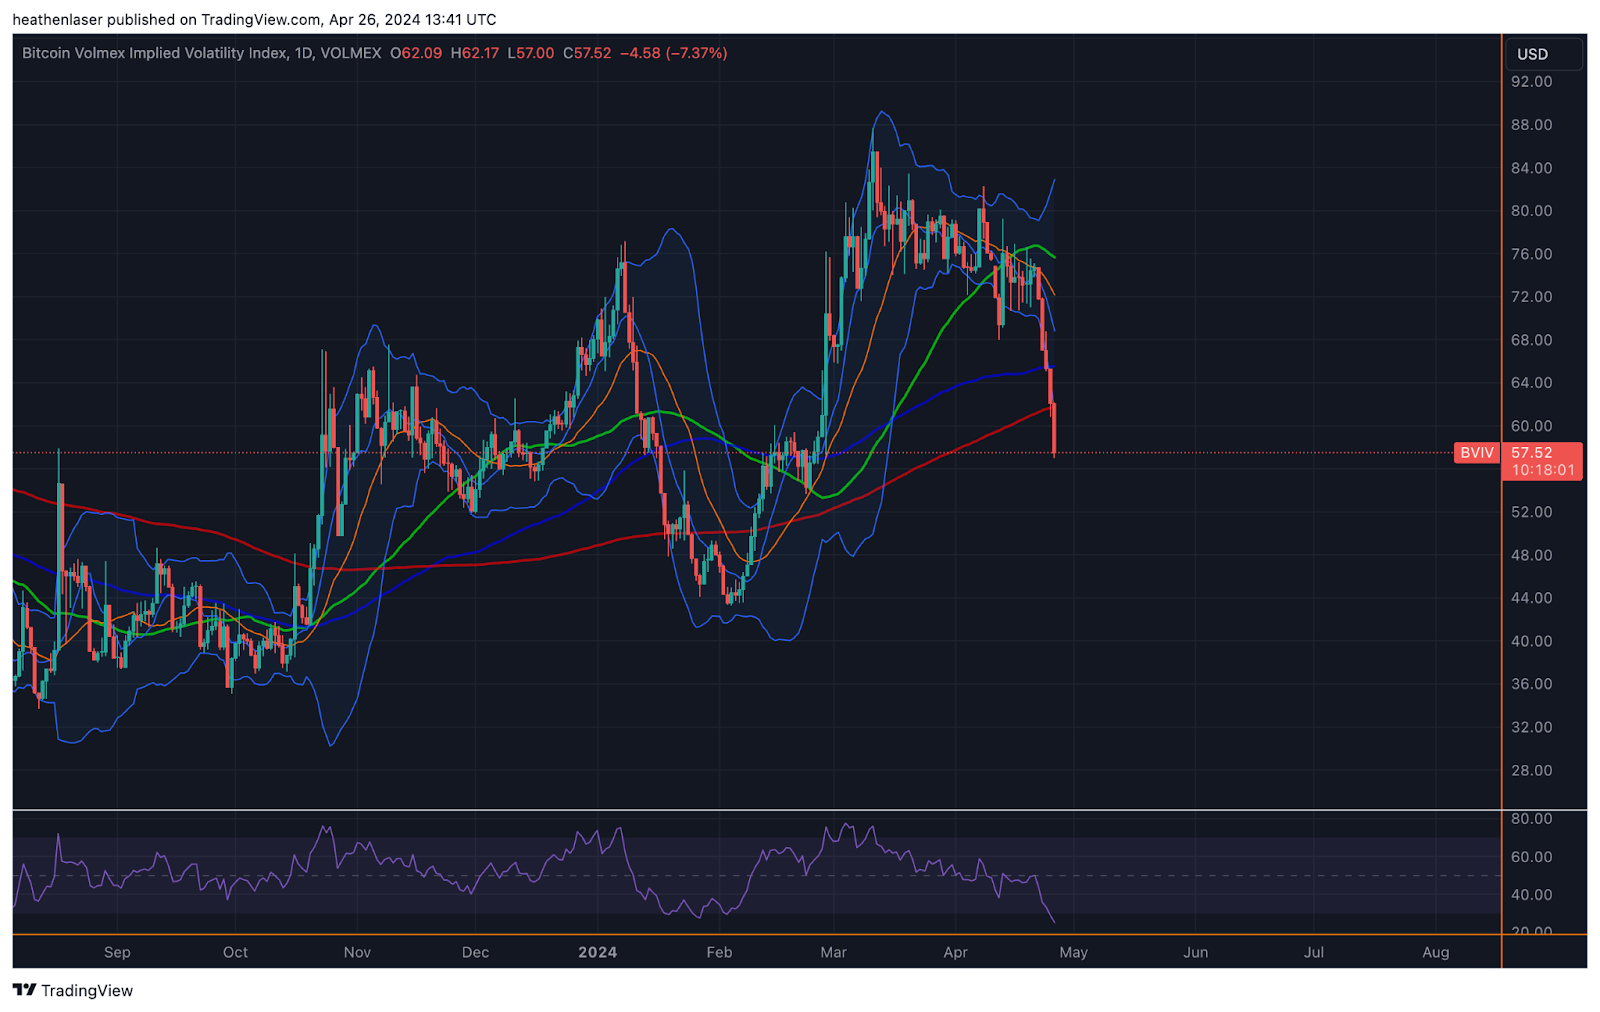
The impact the past 6 weeks of choppy price action have had on options implied volatility levels and pricing has been fascinating.
It has led to BVIV, Bitcoin’s Implied Volatility index, crashing to levels not seen since prior to February’s run from $50,000 up to $74,000+ in early March.
It’s a sign that selling the hopium of a big move up or down is profitable… Not buying the anticipation of it.
Sell the hope, don't buy it was and is the TLDR of late.
Here’s another view of the same thing via a IV-term structure chart. This compares the options premium as measured by implied volatility (IV) at a specific date across various contract expirations.
The light blue line is the current pricing, and has IV scores of just 55 for May and 67 for December.
This is in stark contrast to the dark blue line, which is what IV was at the end of March (dark blue line) across expirations. These contracts were trading at IV scores of 77 and 80.
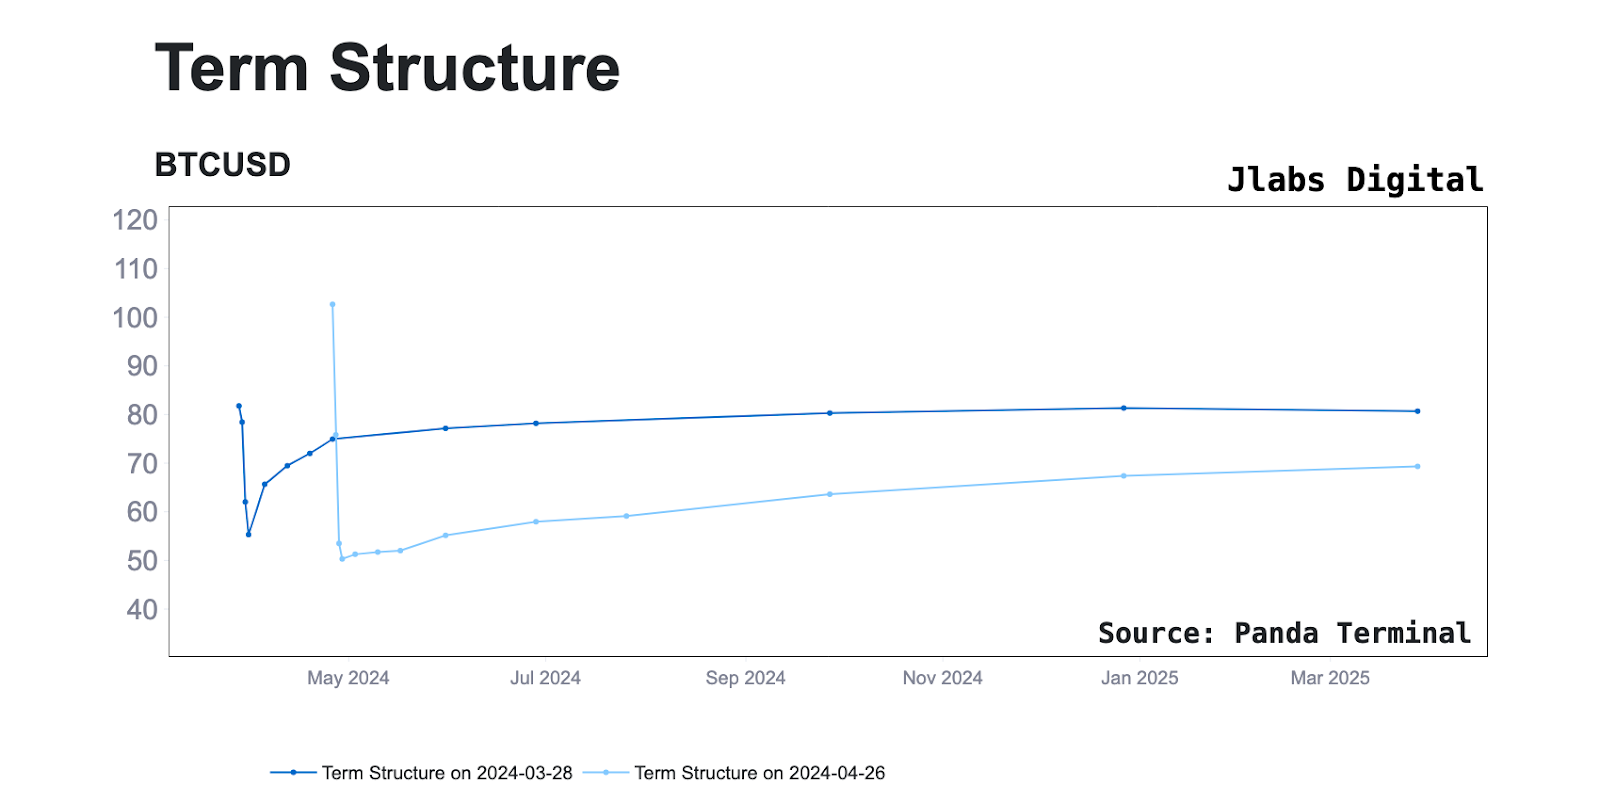
The IV crush continues.
The question now is whether or not this continued trend is hinting at an opportunity to finally get long volatility as we close out April. That’s what we look at next.
The Other Trend
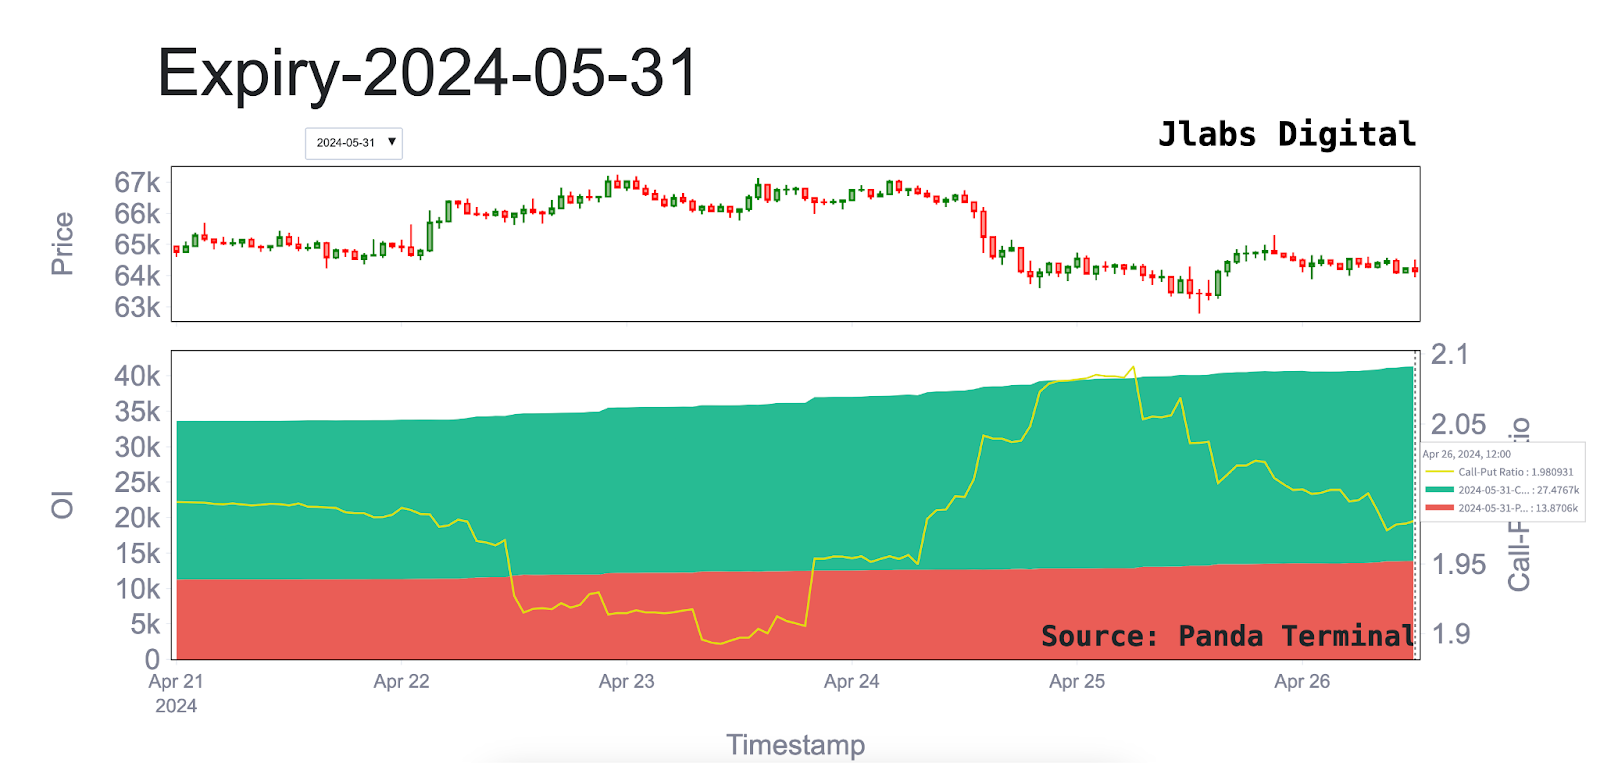
Open interest at the end of May for the options market has continued to outpace other expiries.
We began noticing this trend two weeks ago, in an essay title “The End of May”.
And the trend has continued to grow at a rapid rate with call OI now exceeding 27,000 notional BTC and put OI nearing 14,000 BTC notional, as of April 26.
The most popular buys among these contracts have been the $69,000 call option (currently trading for ~$2,700), as well as the $55,000 put option (currently trading for ~$1,050).
This suggests that market participants are preparing themselves for a price action breakout of our current range in May.
Whether or not these bets will be rewarded remains to be seen, but they’re something to be aware of as we head into the monthly open as well as the long awaited Hong Kong BTC ETF launch.
We also have an upcoming FOMC event which could either breathe new life into the market, or suck the air out of the room depending on the Fed’s forward guidance.
If we start to see some signs of life from the volatility index accompanied by an increase in spot volume either above the recent highs around $67,000 or below the lows near $62,500, then these May contracts will become all the more important to focus on.
In the meantime, I’ll be here… Searching for clues in this boring price action so you don’t have to.
Watching the tape,
JJ
P.S. : The next video in my Bitcoin options trading educational series will be released May 7th, where we’ll be discussing how to use options to time and hedge yourself at the peak of Bitcoin’s bull market.
Don’t forget to subscribe here https://www.youtube.com/@xChangingGood and check out the previous videos as well as our bi-weekly podcast for more options market alpha.
Here's the previous video ICYMI.


