The End of May
Why the end of May might give us one of the best opportunities of the year.


What started with a bang, ended with a fizzle.
Volatility that is.
In the April 5 options update, we touched on how Bitcoin’s term structure chart and implied volatility levels were hinting a volatility spike could be on the horizon.
The days that followed looked to give us what we expected. You can see that in the chart below with Bitcoin’s Volatility Index climbing from 72 to 80 in three days.
But the move quickly fizzled out as Monday’s New York trading session began.
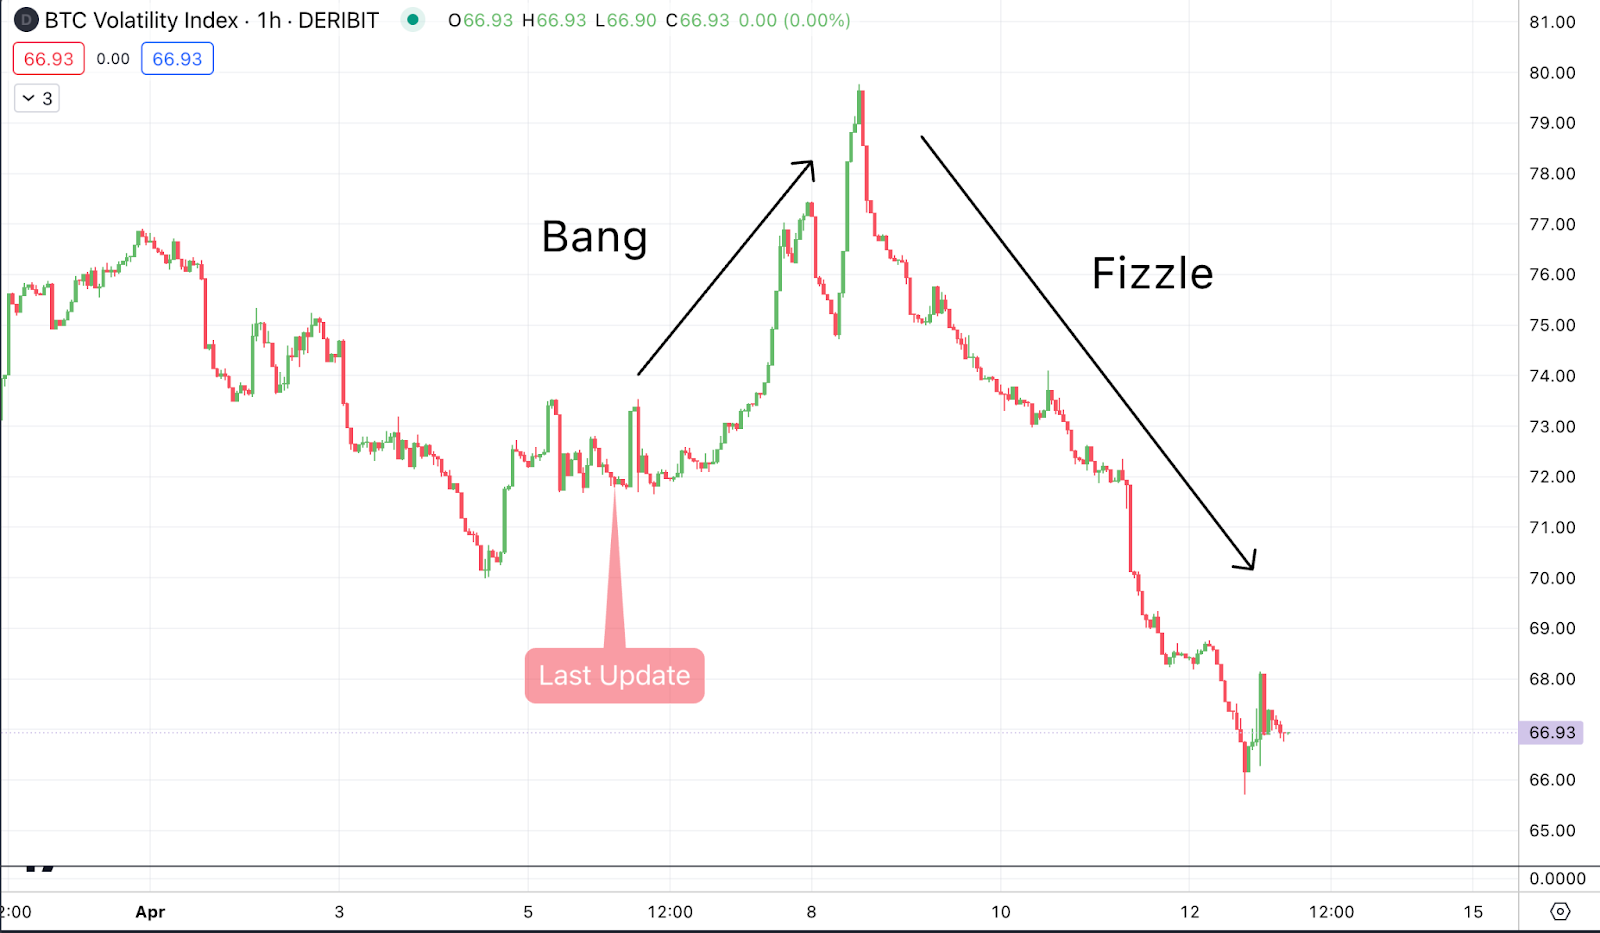
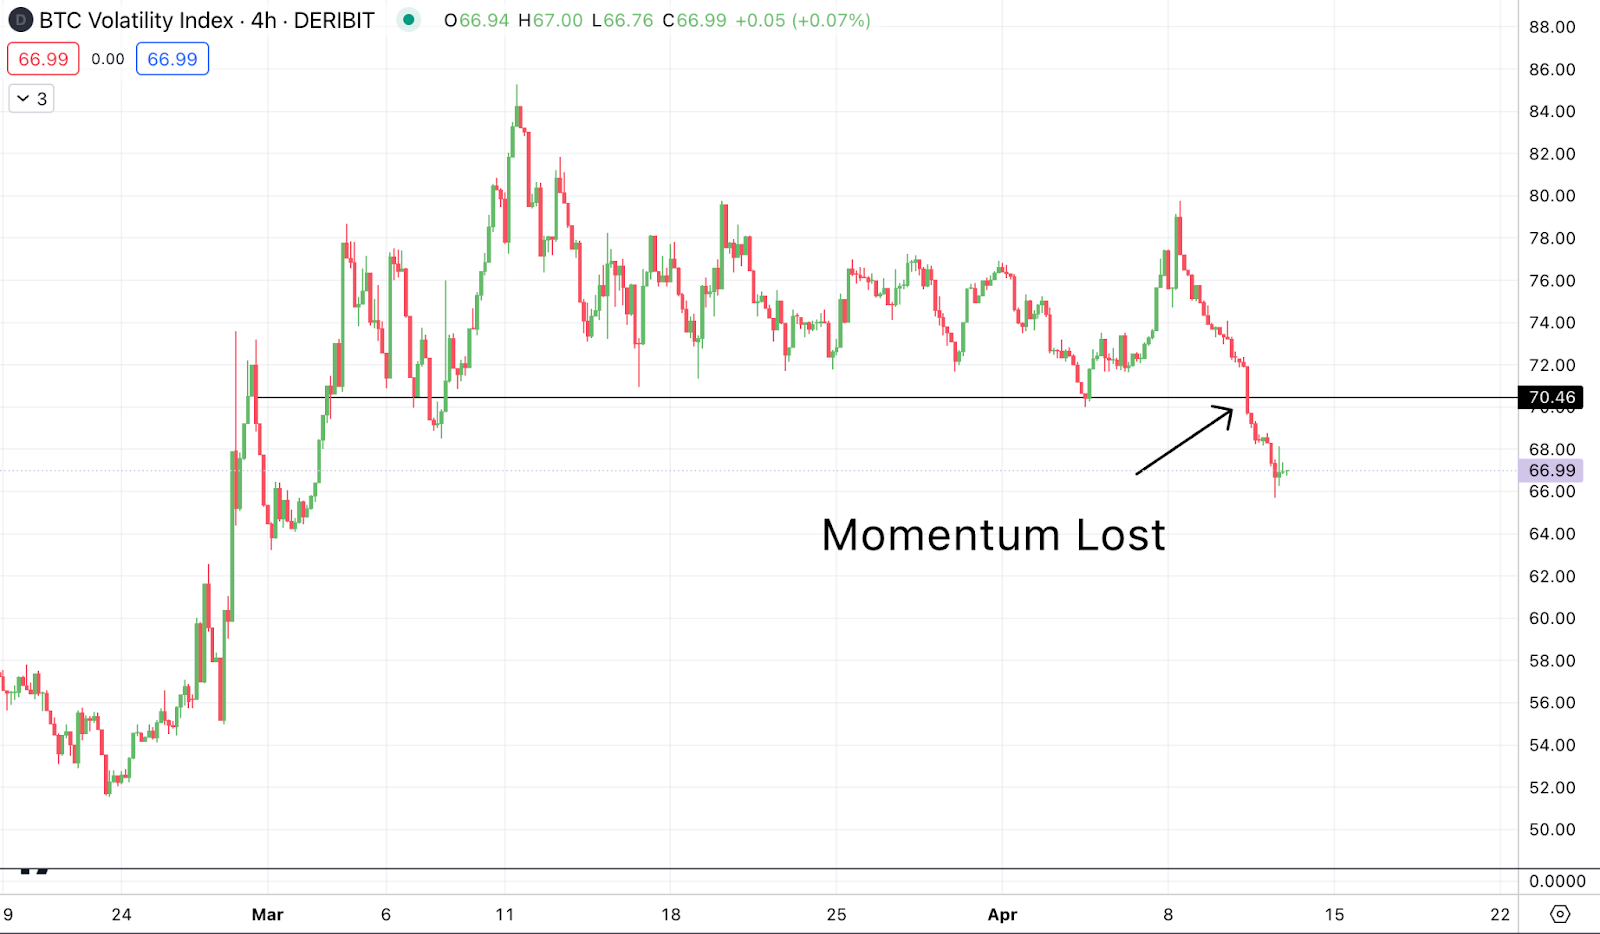
The index is now sub-70, erasing nearly all of the momentum in volatility it gained following Bitcoin’s $60,000 break higher back in early March.
And though yesterday afternoon’s -5% sell-off may have seemed severe in the moment, the volatility needle didn’t flinch.
It’s impressive just how much IV is getting crushed. And it really forces us to ask just when it'll change?
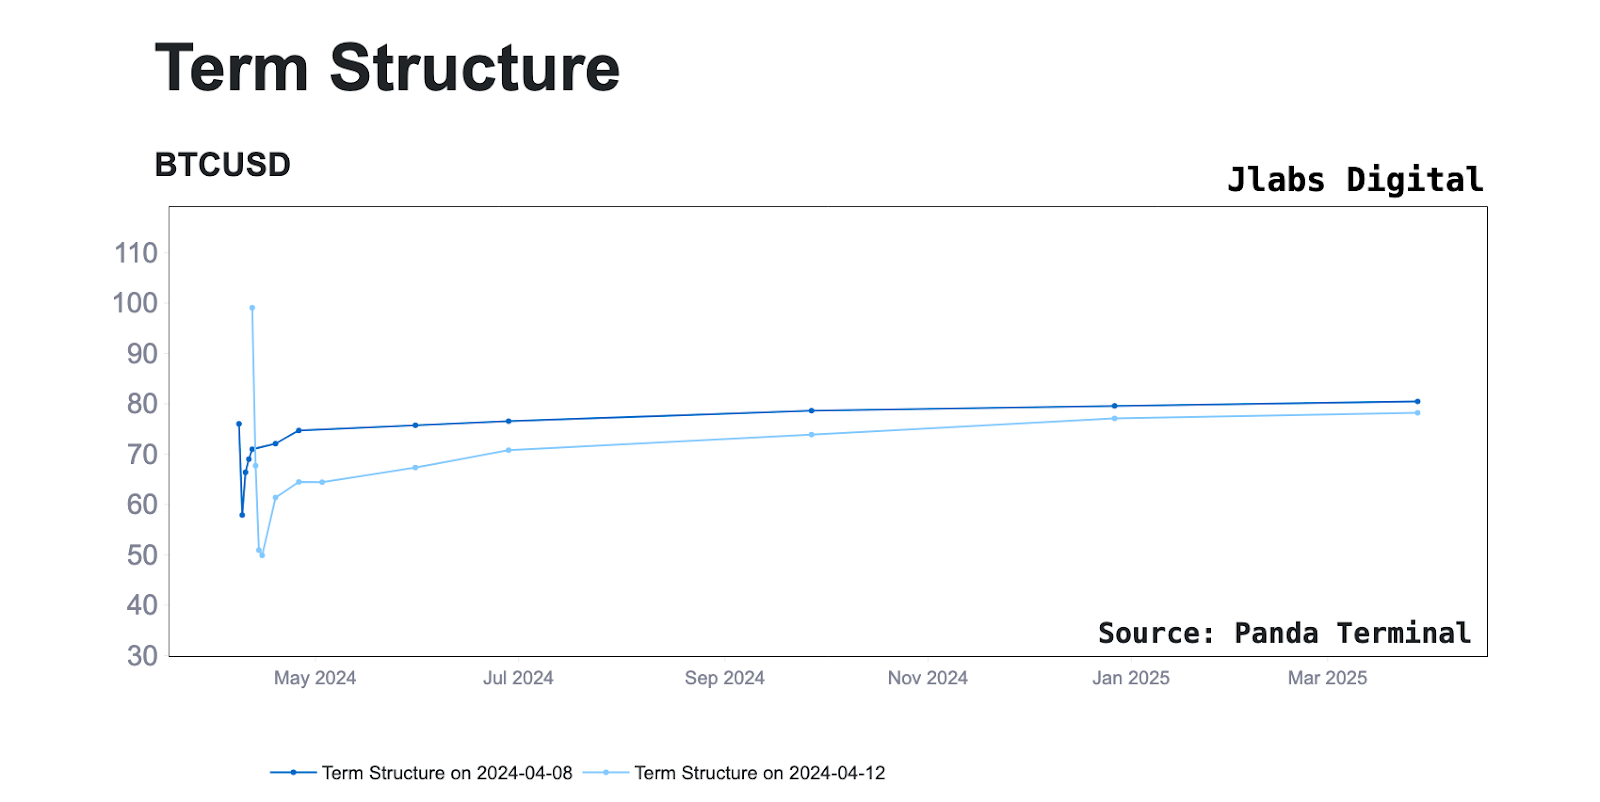
That's the insight for today's update, but before we get to it, let's take another look at just how much beaten down IV is getting.
We can do this by checking out the IV-term structure chart below. This is a snapshot in time of IV for each of the expiration, compared to another snapshot in time. The dark blue was last week compared to today’s in light blue.
Crushed.
This is yet another sign of the times. We are still in a regime that’s been ongoing since Bitcoin reached its year-to-date highs at $74,000 last month - a volatility seller’s paradise.
And as long as Bitcoin continues to trade within a range, out-of-the-money contract premiums will continue to decay. Meaning “the house” or options dealers will continue to sell volatility for profit.
Now, to help us gain perspective on just why this is happening, let’s check back in on those end of April calls we discussed two weeks back.
A FOMO Chaser Is Dangerous
You might remember us pointing out two weeks that there were some signs of FOMO as we headed toward the halving in the options market, which was presenting an opportunity to harvest volatility as we closed out March.
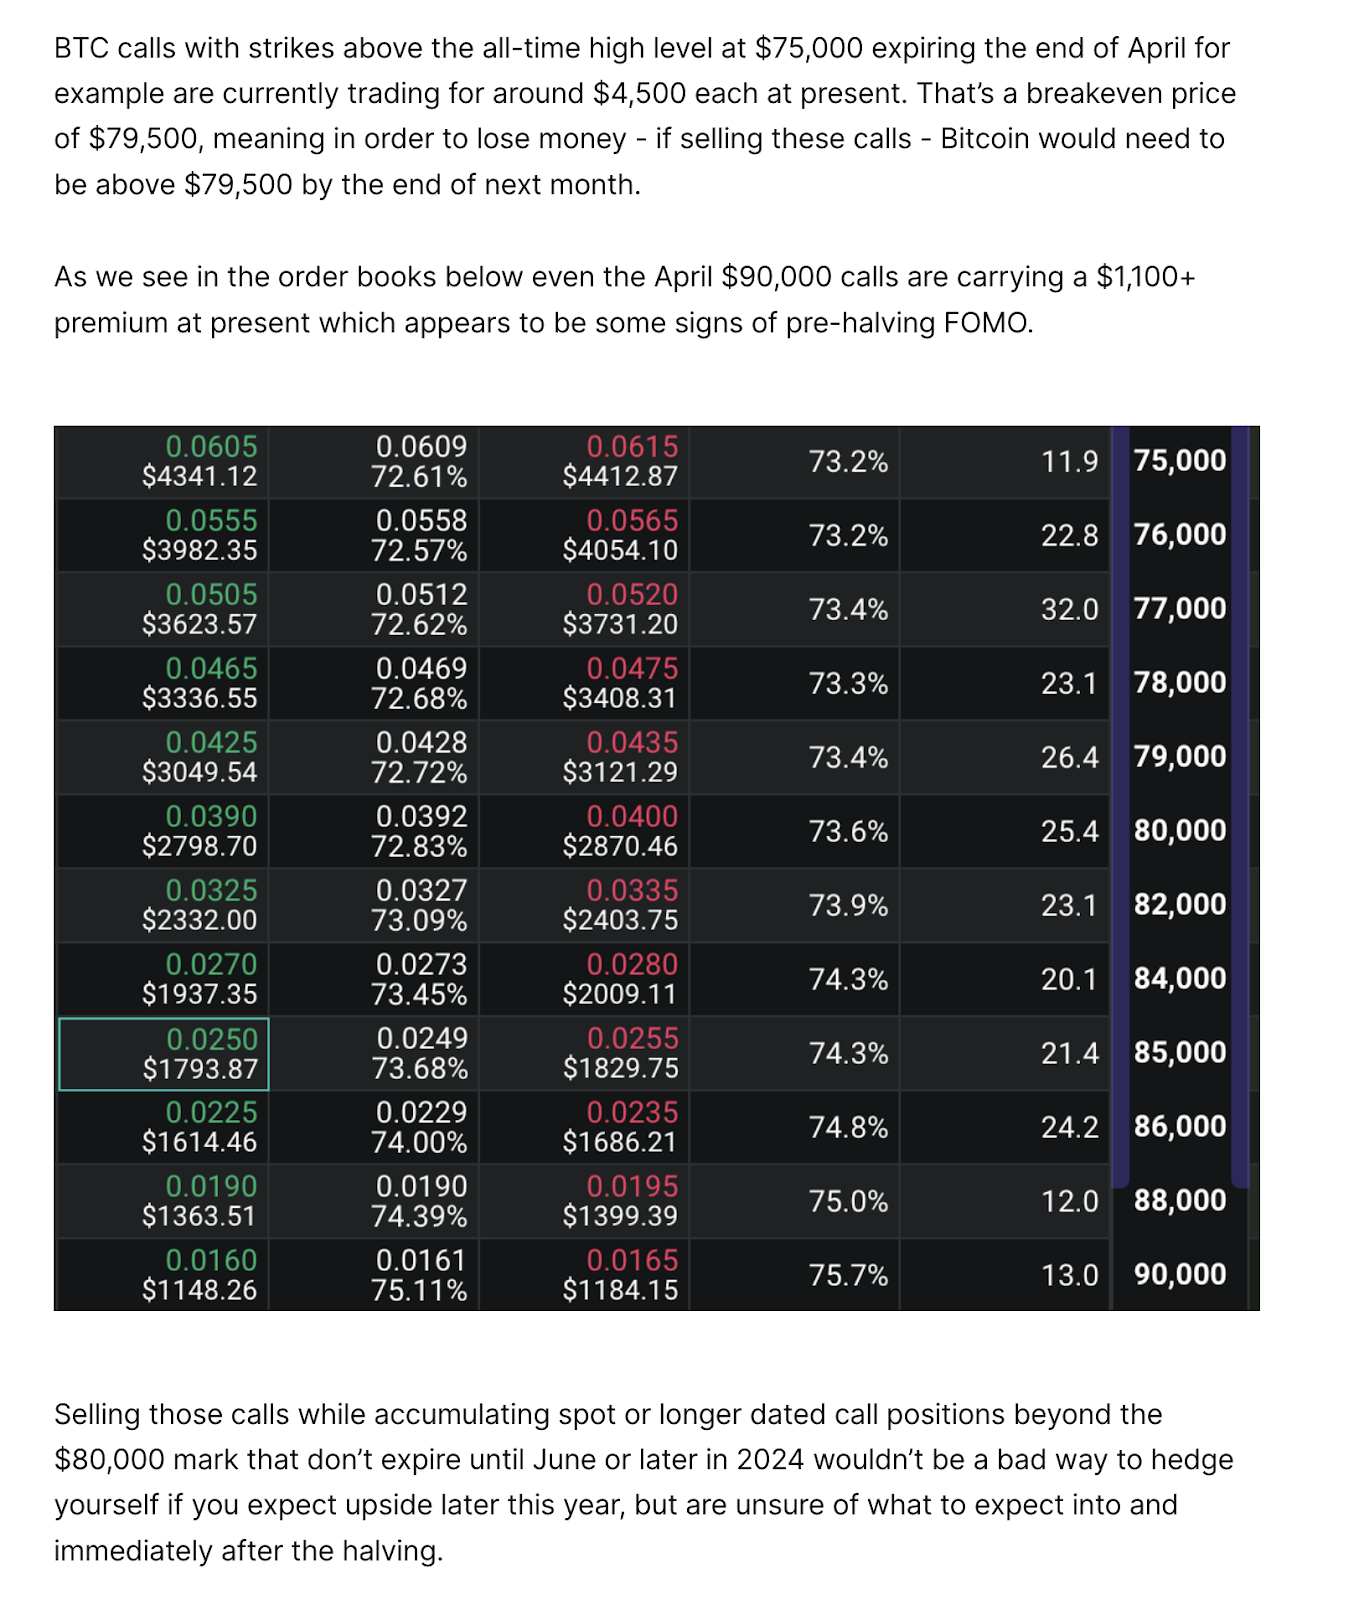
When we compare those figures to the current premiums of the same contracts, we get a clearer picture of how much euphoria has been bled out of the market, as they have all been marked down 75-90% in just 2 weeks time.
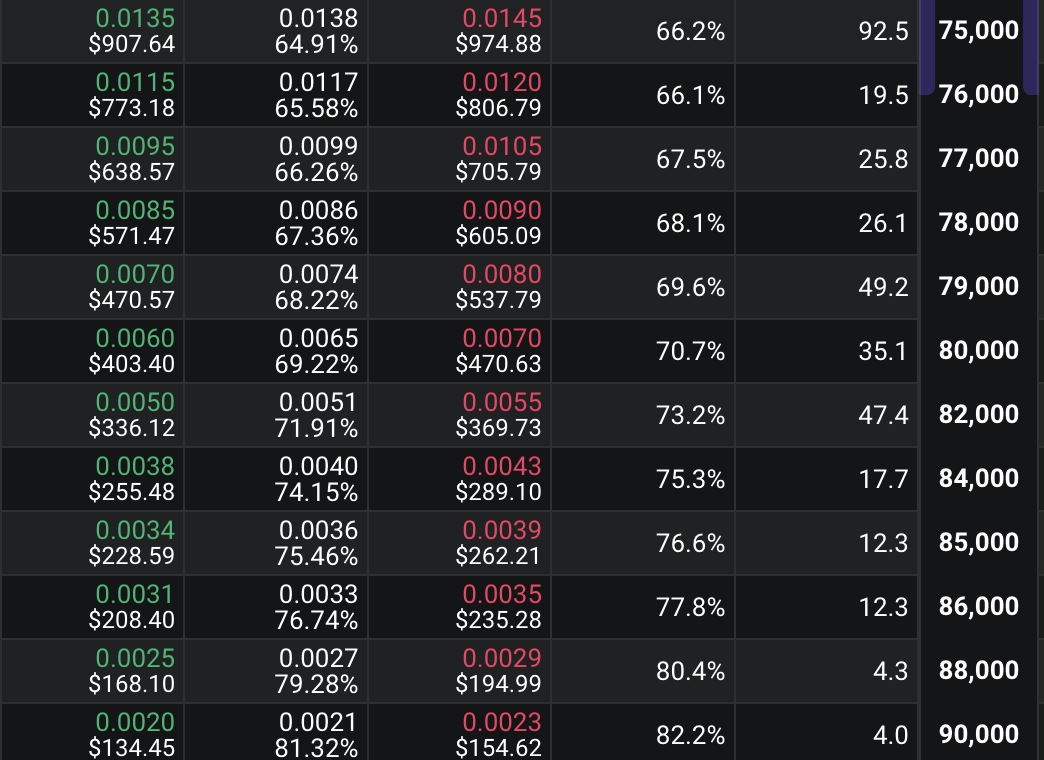
Let this serve as a good reminder on why FOMO and options are never a good combination, especially when heading into such a widely known catalyst as the halving.
So what to do in order to avoid the crush?
Searching For A Shift
To answer this question, let's take a look at Bitcoin's technicals and options market trade flow.
Bitcoin's technicals are beginning to coil
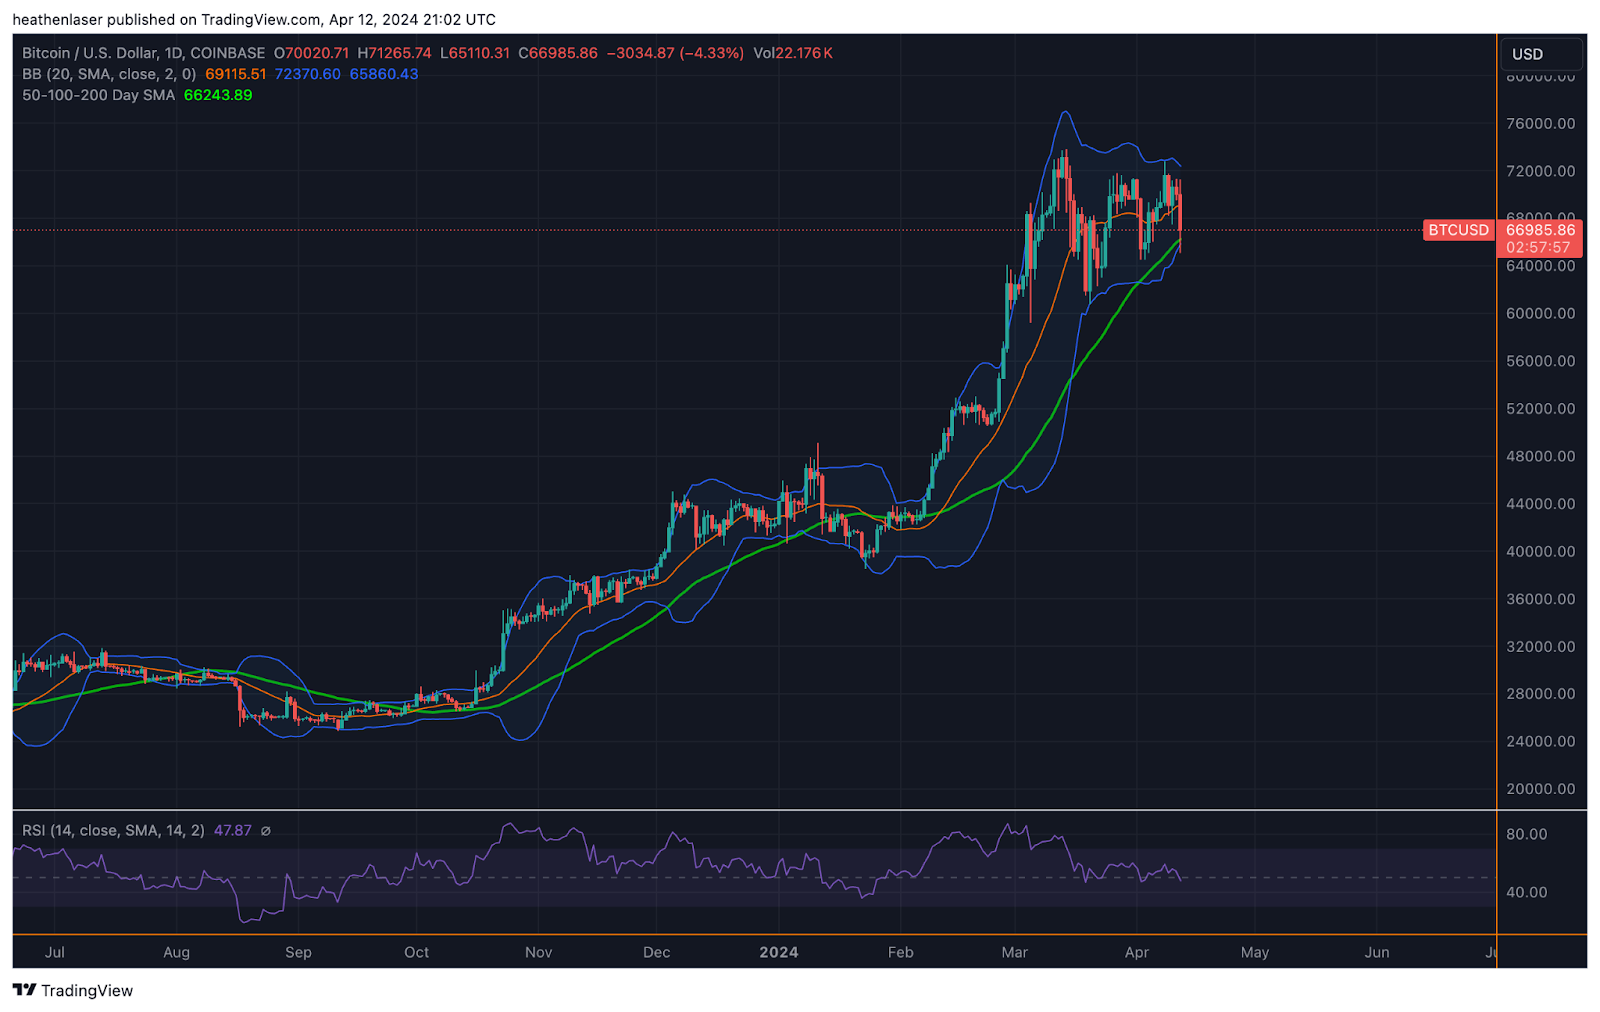
Below we can see a triple confluence of Bitcoin’s 50-RSI mark, 50-day moving average, and lower bollinger band on the daily chart resting around the $66,000 region, where we bounced off yesterday.
Considering Bitcoin has held all three of these trends during its leg up from the $40,000 region in early February up through the new all-time highs in March at $74,000, a loss of this key level could bring with it heavy sell pressure and increased volatility to the downside.
There’s also the direction.
A regain of momentum back above the $72,300 level and the upper end of Bitcoin’s weekly bollinger band would reignite upside volatility.
This coiled position can create major swings.
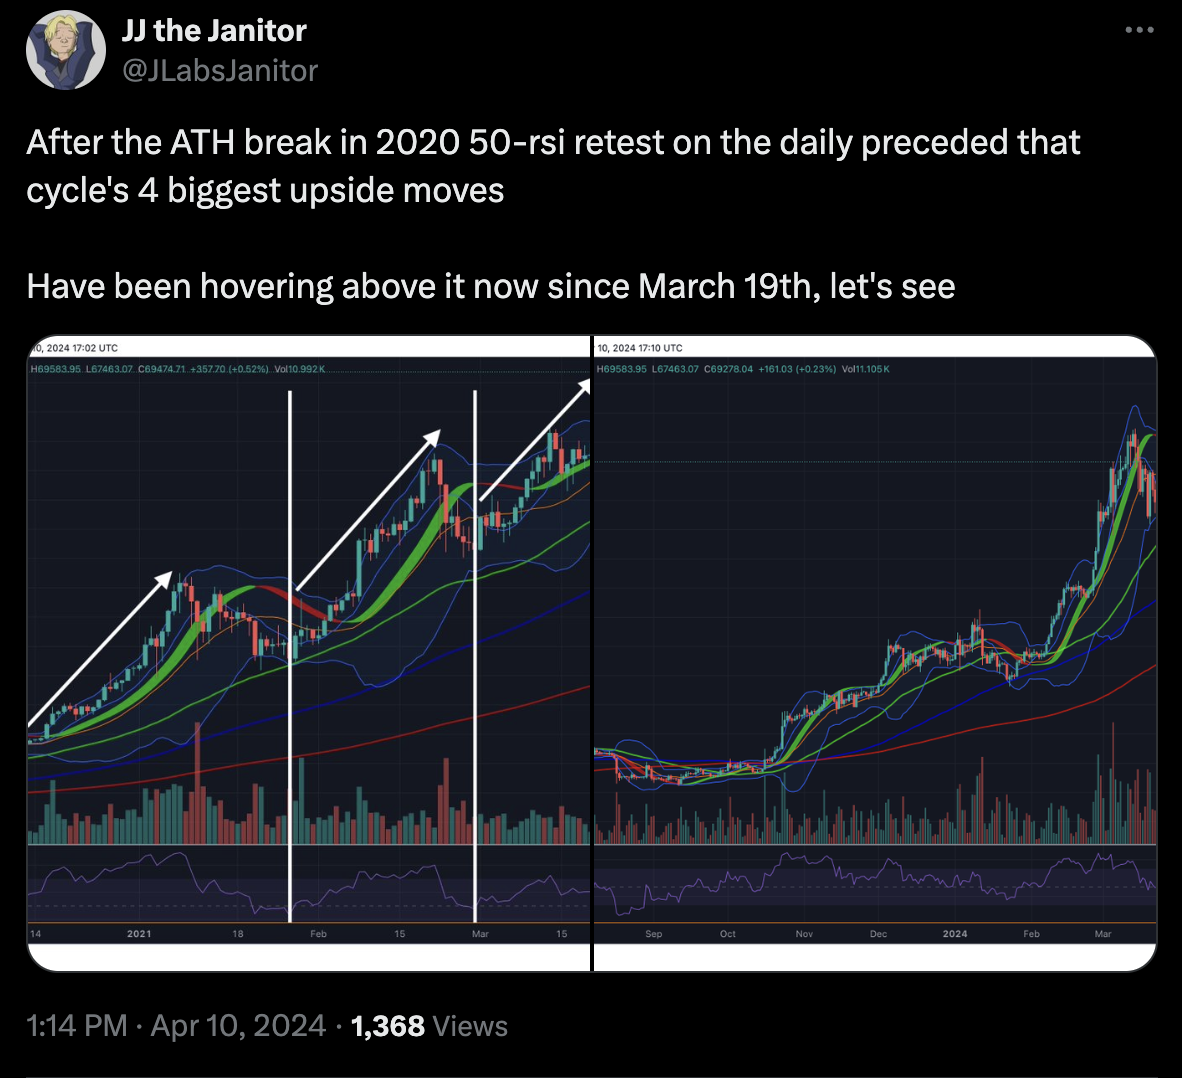
We've seen this several times before. In the tweet below I reference the 2021 bull run and how this technical level was where Bitcoin began its largest ascents of that cycle.
I bring this up to say, it's an important level. And looking at the flows, we get another hint that a range break might happen in either direction by the end of May.
To help us see why, let’s look at the call to put ratio. It’s a ratio of the number of calls versus puts for a specific contract. Watching this helps us find the shifts we’re interested in.
The ratio is the yellow line below. The green shaded area is calls while the red shaded area is puts. If you take the green area and divide by the red area, you get the yellow line,
Between April 8 and Thursday, over 1,600 BTC worth of puts (red block) were added to this expiration. That’s the area where the yellow line trends lower. This uptick in puts brought the new total put open interest to over 7,100 BTC notional for the May expiry into Friday.
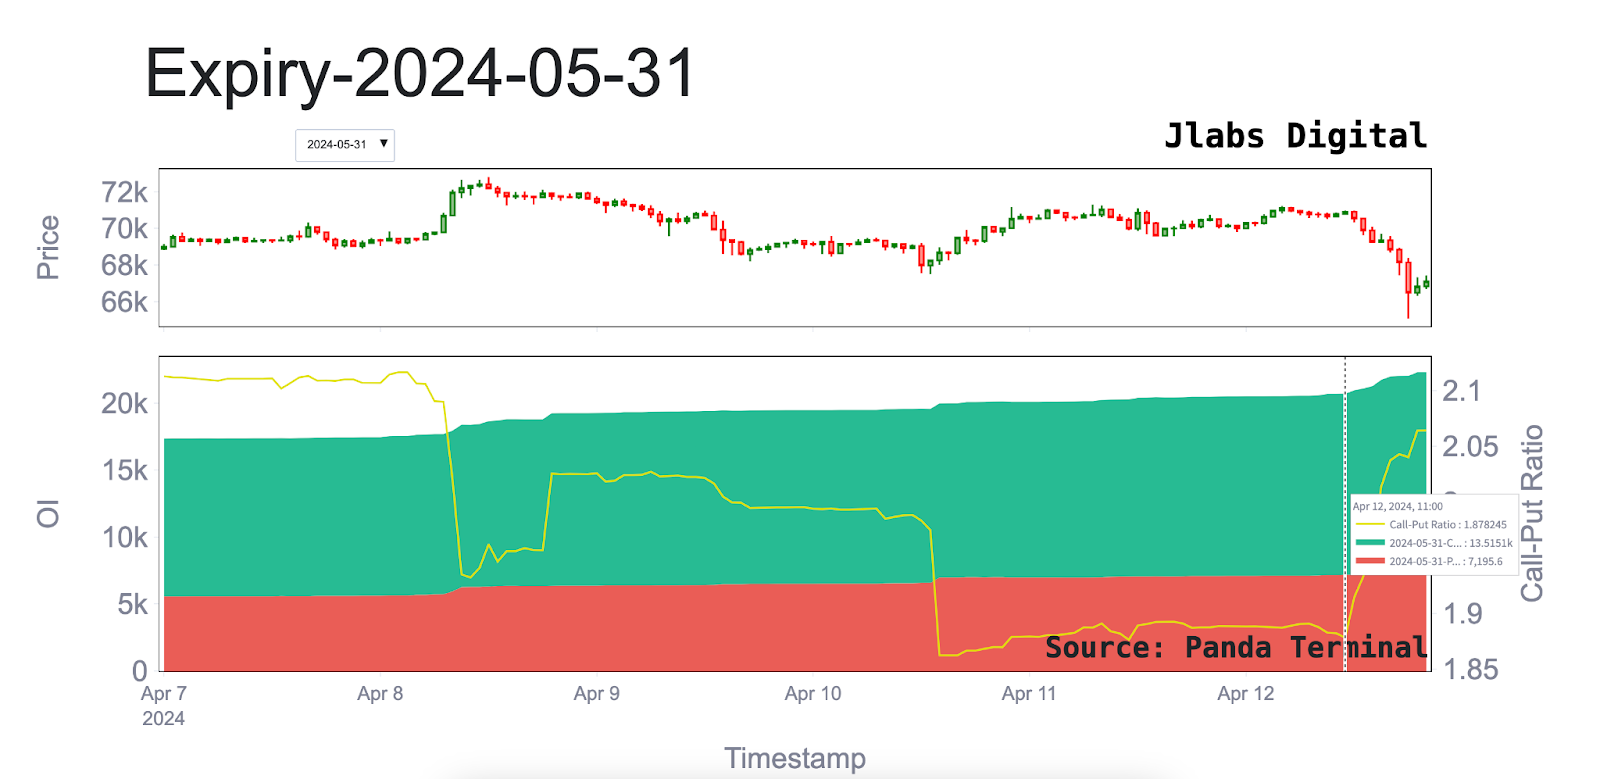
This action was followed up by over 1,500 BTC worth of new call positions (green block) being added on Friday, April 12. This brought the new total for May’s expiration up to over 15,000 BTC notional, and made the yellow line climb back higher.
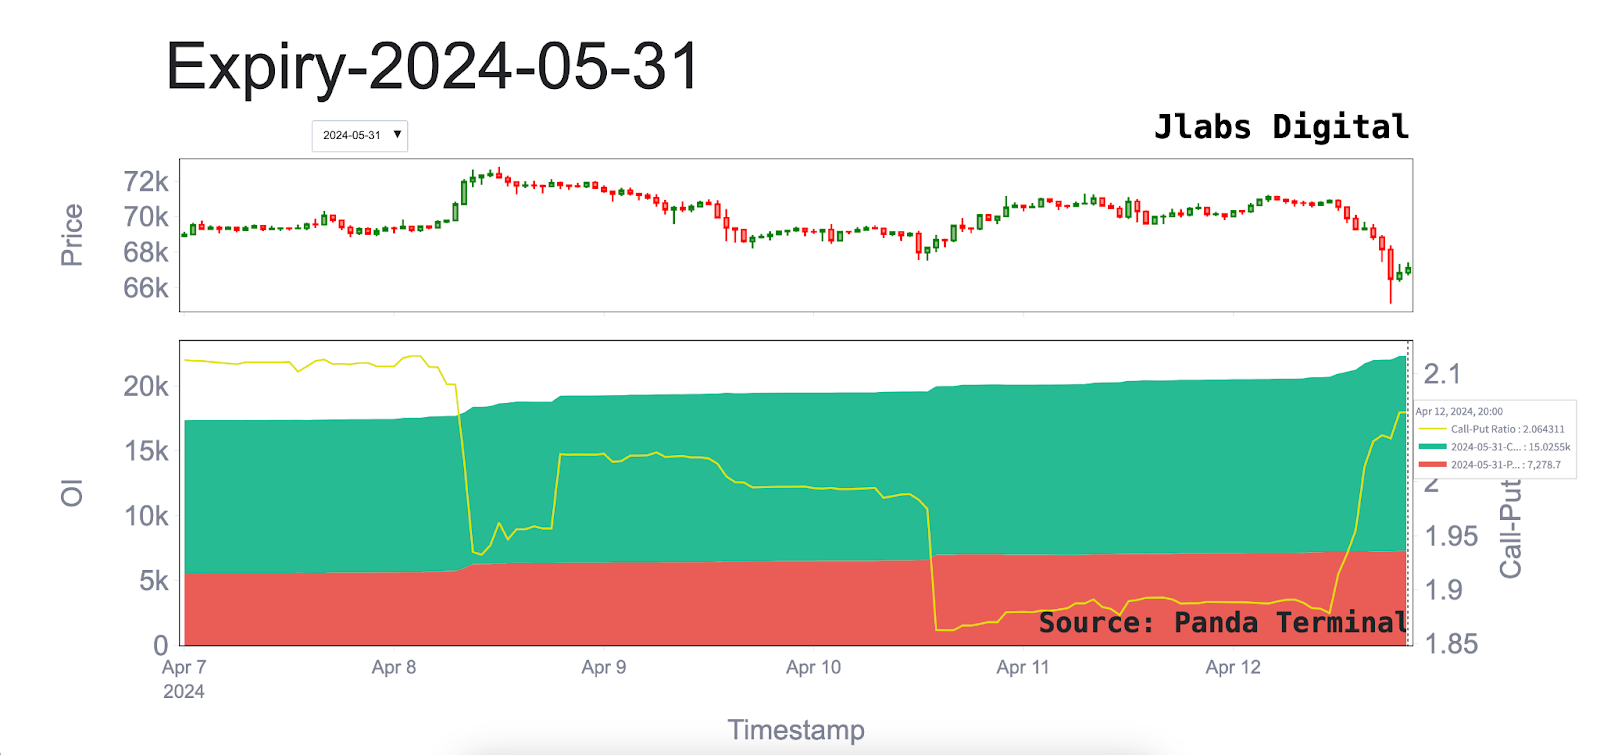
We can see this contract is getting a lot of attention lately. If a contract looks to be tipping its hat to a shift, this might be one. We will keep a close eye on it to help us better predict when Bitcoin’s long held range may finally break, giving us the regime shift we’ve been waiting for.
There won’t be many opportunities like this ahead.
Until then….
Watching the tape,
JJ


