When to Strike
Market Update: What we are patiently waiting for...


Three hours in, I headed home.
Turns out I am no Mike Wolfe… Not even close.
Then again, I was not setting out to be like the ultramarathon runner who hunts down Pronghorn Antelope on foot using only a bow and arrow.
I never really thought I’d catch one of these skittish animals. Nor was I equipped to deliver a death blow outside of making the animal collapse from exhaustion.
It was more of a simple curiosity of what it would take to out run an Antelope… Which ends up being a lot more than I had in the tank that day. Also, I’m not a hunter so had a few things to learn on that end as well.
Regardless, what I discovered that day was perhaps with enough determination… and more importantly with enough patience to plod along for hours on end… that it wasn’t impossible.
You see, humans are unique in a way that most people overlook. We can take multiple breaths per stride when we run. The cadence of our stride is not tied to our ability to supply our muscles and vital organs with oxygen.
For four legged land animals, this is not the same. They act like accordions when they run.
Which is why if humans chase land animals down for hours, they can literally out run them. Mike Wolfe is living proof that even our canola oil saturated and coach potato’d genetic version of ourselves can still perform this older than the written language act.
This astounding feat reminds us that a certain trait… one now considered a rare virtue… is what led to our culture expanding out of Africa during pre-historic times. That trait is patience.
The patience to strike at the right moment… The patience to stay within one’s bounds… The patience to force the animal to sprint over and over. This determined the success of the tribe and whether your family will eat for the week.
For traders, this patience is a trait we often need to exude to survive in what can feel like an unforgiving environment. One of rate hikes, crab markets, and low volatility.
And with Ethereum and the broader market turning soft over the weekend, we need more patience than ever. This is often easier said than done. So today we’d like to offer some perspective so you can not jump the gun.
We plan to do this by peeling back more insight on a topic we touched on last week. That insight is Ethereum, and what is taking place with its current deviation from Bitcoin.
And since Ethereum is dictating the market right now, we spent some extra time watching it trade over the last week.
You’ll want to read about the clues it showed us to better know when to strike.
Accumulation
In our last market update "Why Things Might be Different", we wrote about how Ethereum was showing structural differences from Bitcoin. Specifically, the accumulation taking place onchain as well as the change in whale holdings over time.
At the time, we weren’t sure if these findings alluded to the early stages of Ethereum breaking out from the rest of the market. That a larger trend might be unfolding.
This line of thinking pairs up with what a few analysts are considering when it comes to the upcoming catalyst for Ethereum - The Merge. An event where Ethereum as we know it becomes Ethereum 2.0 and transitions from Proof-of-Work to Proof-of-Stake.
The fact we saw onchain accumulation and the potential narrative forming in the market, we spent more time looking into this divergence from Ethereum.
To dive into the why here, let’s first pull up some onchain metrics showcasing the accumulation that took place with ETH.
In the chart below you’ll see that during the dip for ETH last month, there was whale accumulation taking place. Which is something we want to see during bottom formation. And also if we are to get any substantial rally into a higher price range. This accumulation is seen in the yellow dots within the white box below.
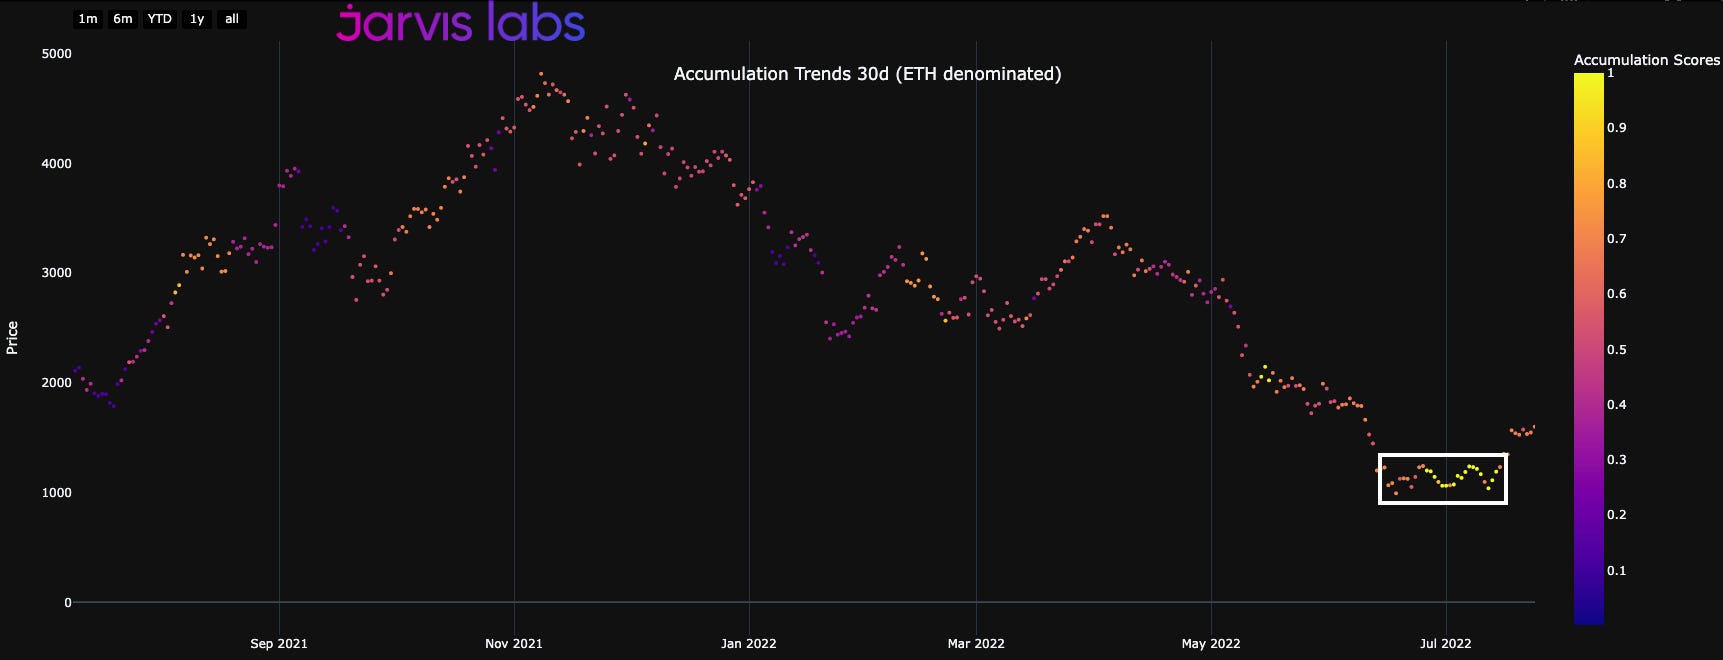
What is a bit more enlightening here is if we drop the timeframe from 30d to 7d. 30d is helpful for larger trends. But 7d can reveal when the accumulation began. It was heaviest around the time prices reached their lowest in June.
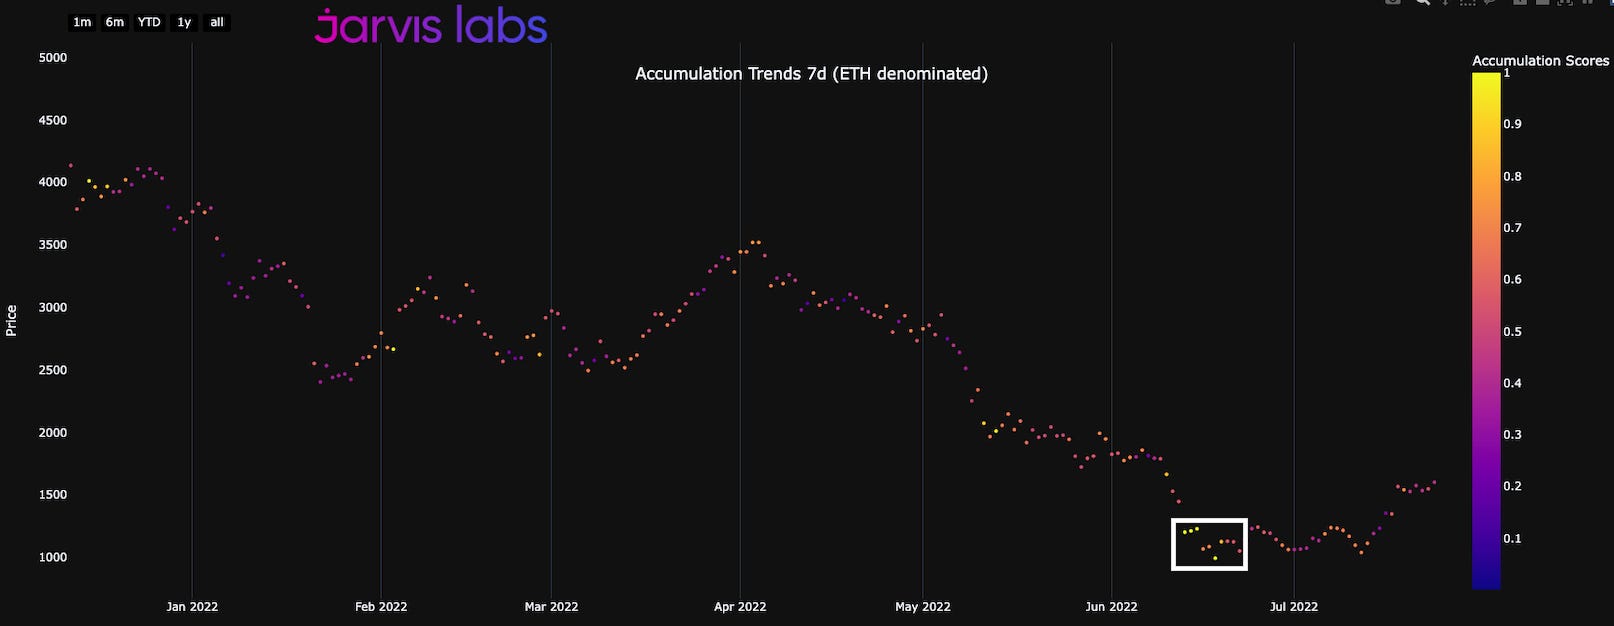
This helps explain that during the major June selloff, during the Contagion, the ETH being sold on the spot markets was absorbed by large entities.
The activity helped put a floor in place and nudged the market to a somewhat more normal cadence.
In the weeks that followed, price began to seek out liquidity to the upside… Here we see the liquidity that got tapped around $24k.
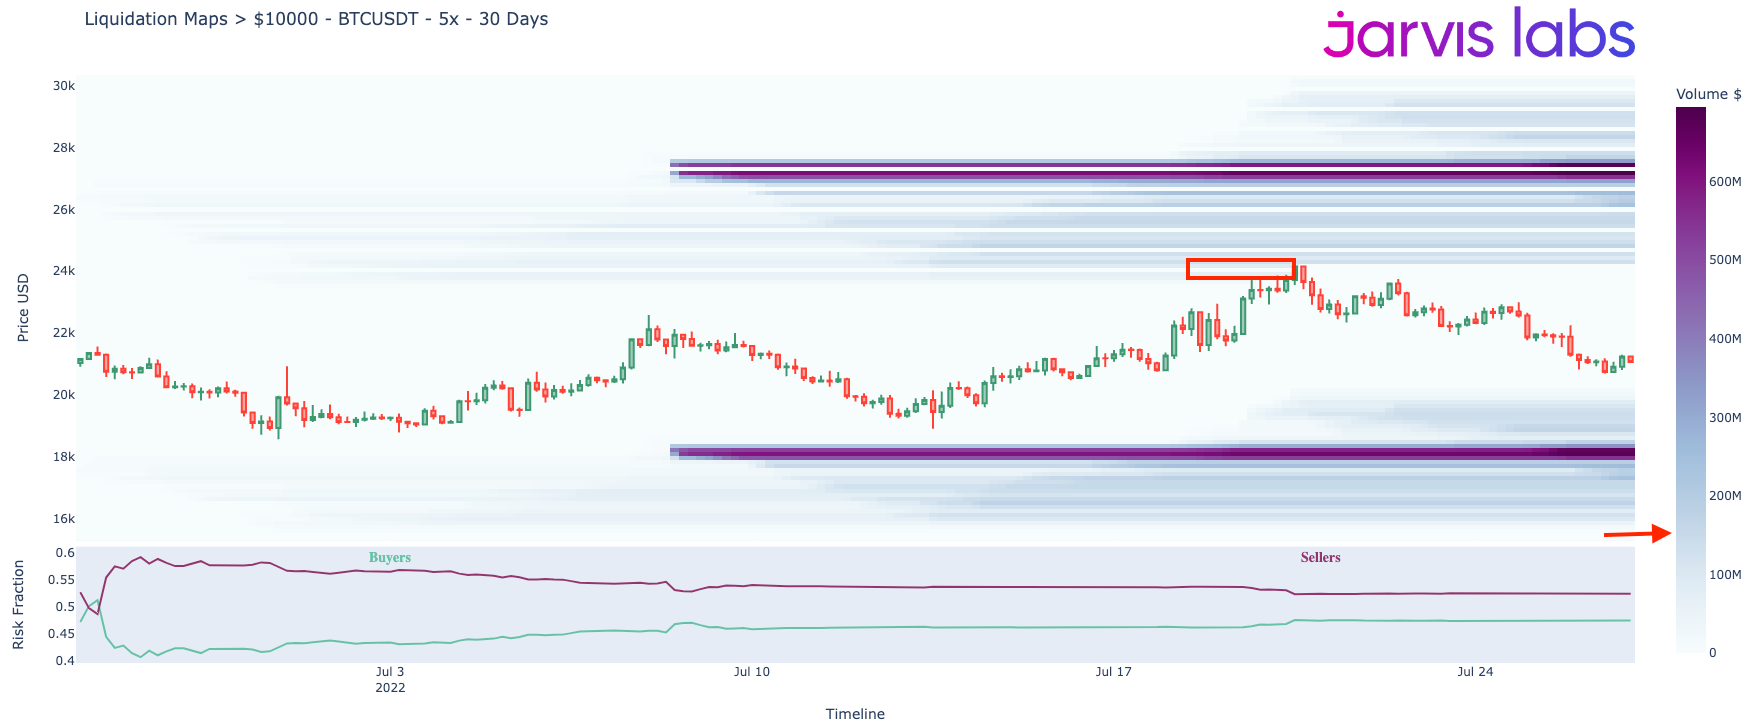
This signaled to us the market is returning to a more normal state. Forced selling is more of a memory than a constant forethought. And the question became more about how much price would pierce into that overhead liquidity.
Unfortunately was merely a flesh wound. But don’t let discourage you…
Because when price skimmed the upside liquidity, the market gave us a sign.
Where are the Liquidations
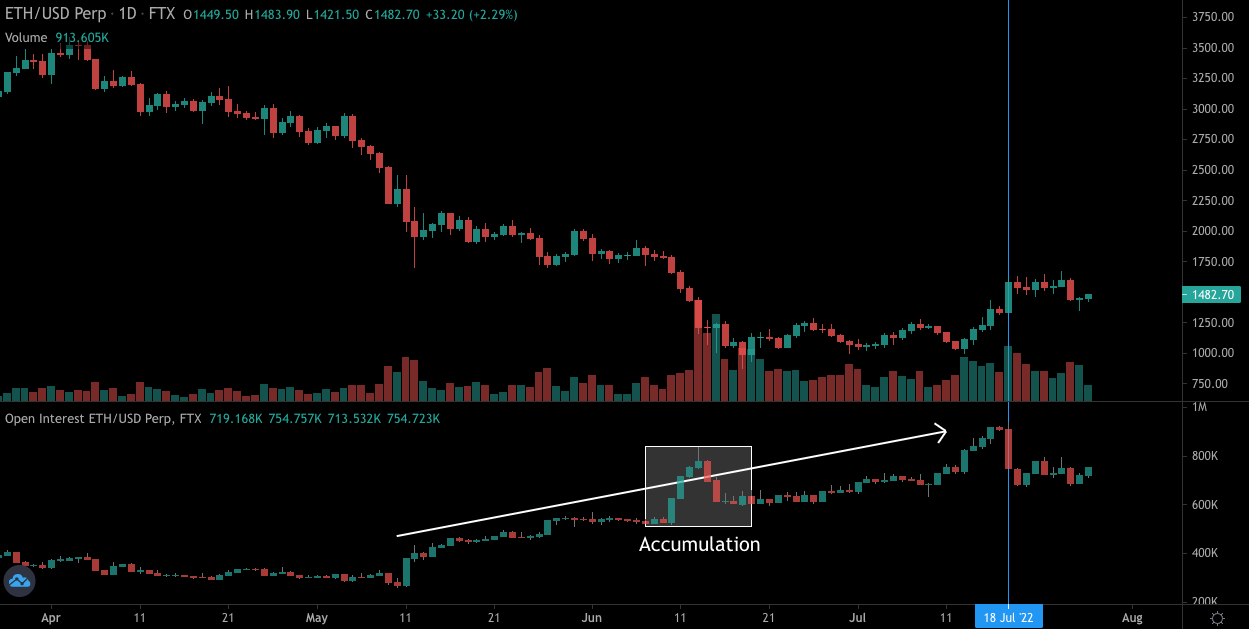
In the Coinalyze chart below, take note of the strong price action of ETH on July 18th. Then in the subplot, notice how the amount of open positions (OI - Open Interest) in ETH’s perpetual futures market dropped by 118.7k ETH or about $165 million.
The window in the chart below shows the amount of shorts liquidated on the large drop of OI. On that four hour candle $10 million of ETH on FTX got liquidated.
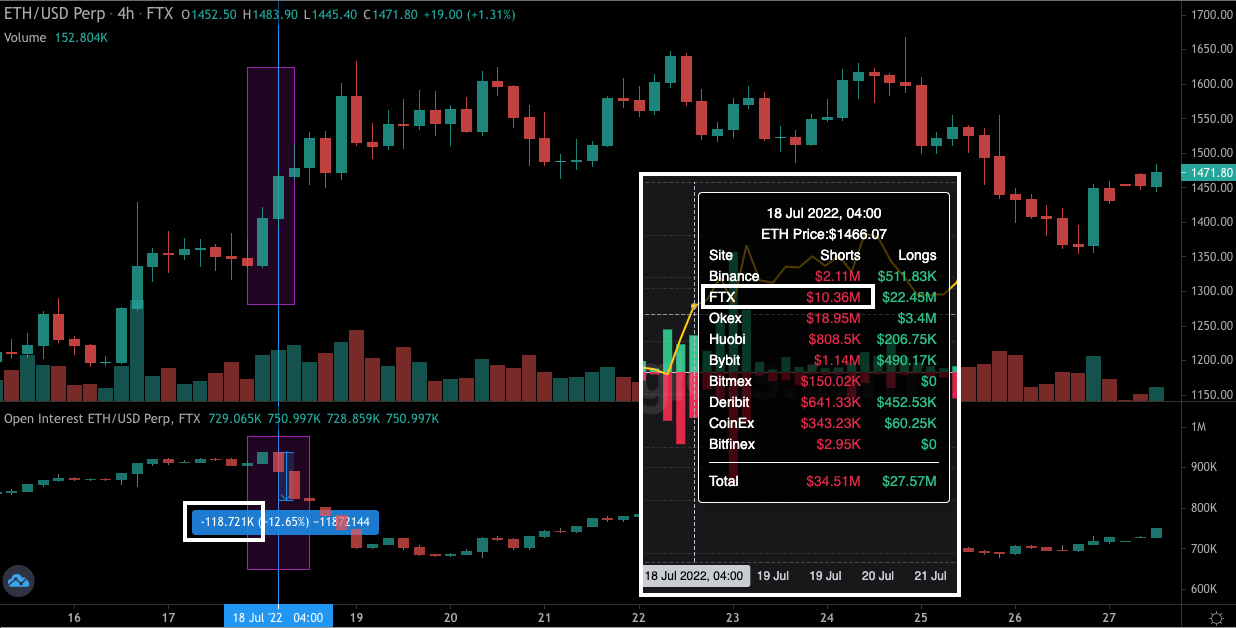
Ten millions is much less than the $165 million of positions unwound… Telling us a large entity was at work.
I bring this up because at first glance a trader might believe there was a mild short squeeze unfolding. But the Coinglass data suggests we would need a magnify glass to find any such thing.
If we then zoom out some more on the trend of OI over time, the story reveals itself a bit more. It appears the entity or entities absorbing the selloff on spot as we saw in our charts earlier, are unwinding their short positions that were put on during the selloff.
In the chart below, we can see the accumulation that took place on spot in the white box below. This took place during the selloff, meaning it was likely done to hedge the absorption.
Now what does that mean for us…
We need to remain patient. Based upon where OI sits, versus where it sat in early May, it appears the market is still unwinding from the May and June selloffs. These were violent events that take time to recover from.
It also means that with such large unwinds taking place, our attention is now drawn to the liquidity to the downside. Will we witness accumulation unfold again…
Or will nobody step up?
This is what we need to watch out for in the week to come. And why we need to remain patient for long-term timing.
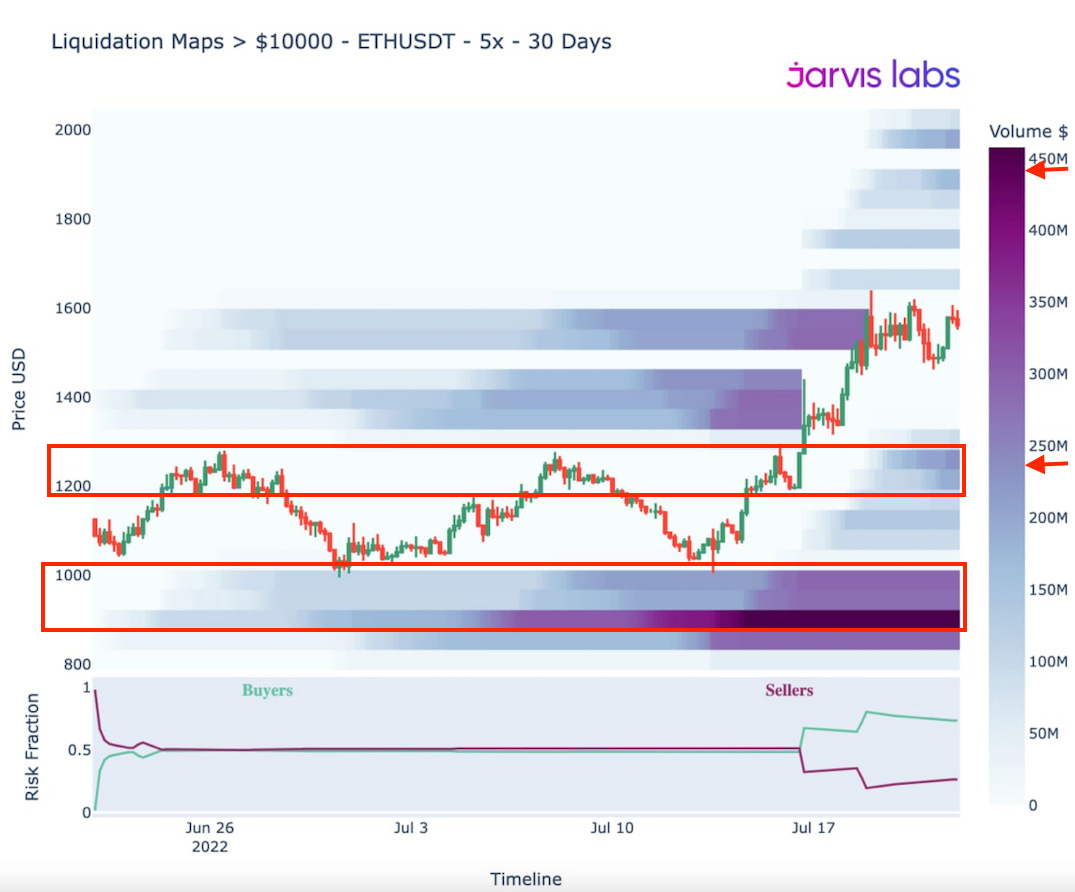
As of now, liquidity sits in two pools to the downside. One around $1,250. This is a decent size. There is then a larger one just below the $1,000 range.
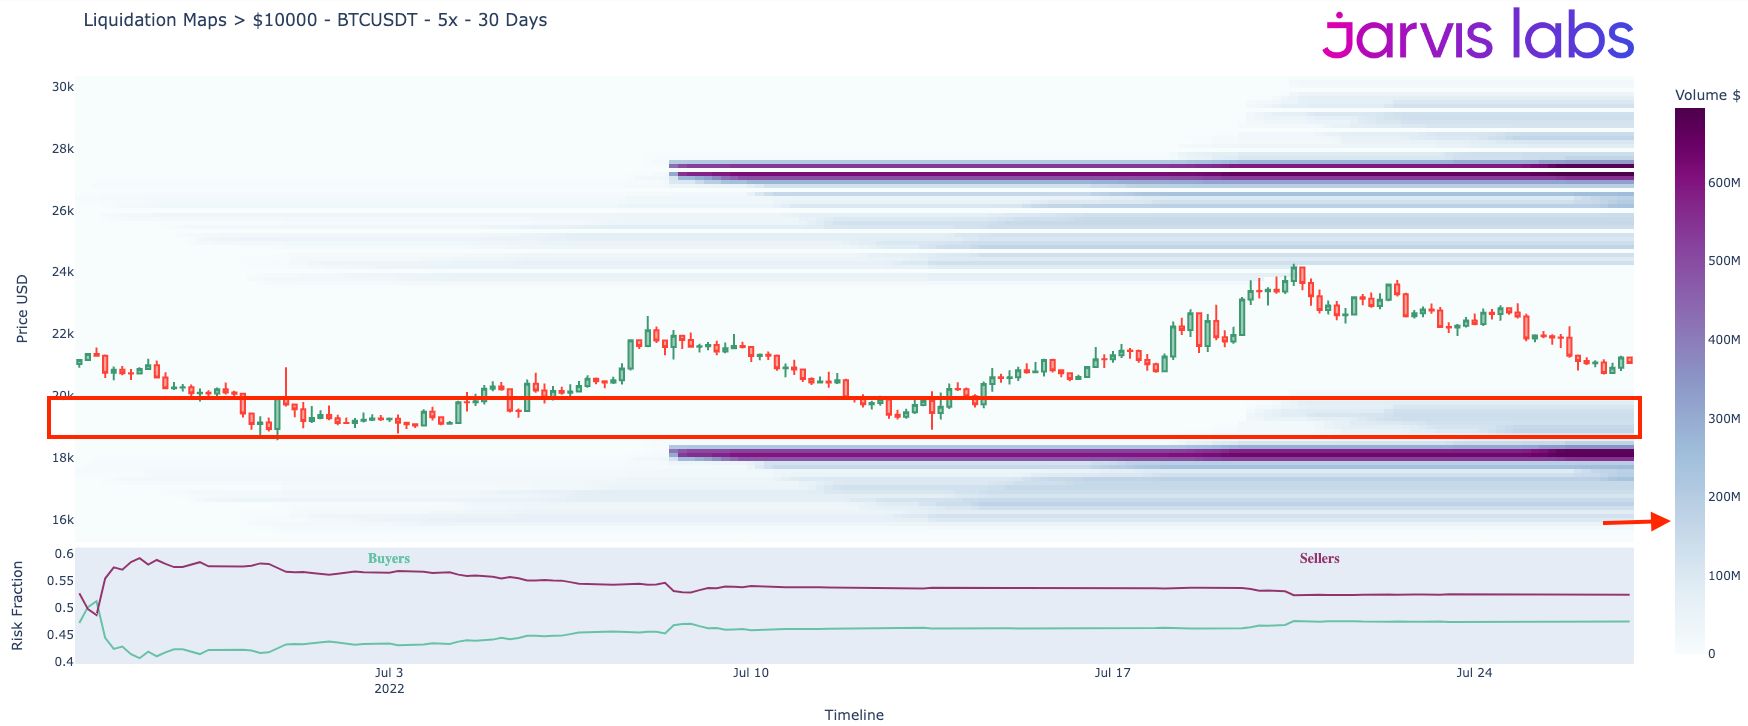
As for BTC the liquidity to the downside sits near $19k.
As price approaches this region, we will be watching out for if - and in which assets - accumulation takes place.
This also means the additional charts we originally had planned for you today will be reserved for the next time price begins marching higher. That’s because these charts will come in handy to see when the market gets stretched to the upside again and warns us that it is a good time for profit taking again.
Until next week, watch our twitter feeds for updates regarding follow up material to keep you updated if this starts to play out.
Your Pulse on Chain,
Ben Lilly


