Welcome to the Jungle
Market Update: The Danger That Sits Above


Do you know where you are?
You’re in the jungle, baby.
It sure feels that way recently, doesn’t it?
Following the fall of FTX, crypto markets have reminded me more of a Lord of the Flies reenactment than the orderly and efficient markets I had come to know and rely on. The fallout of SBF’s fraud (which we covered in depth here last week) has left many market makers, hedge funds, and other large traders without access to tens of billions of dollars of their own operating capital.
Capital which would otherwise be actively deployed and traded during this wild price action.
So, what is the result of their absence?
The market is quickly escalating into a full blown, no-holds-barred, peer-versus-peer trading environment.
Earlier this week, I got the chance to sit down with Jarvis’ head quant, Mr. Benjamin, and he walked me through some of the intricacies taking place inside this post-apocalyptic market.
I took notes.
Mr. Benjamin explained that just as there are predators and prey species in a proper jungle, so too are there predators and prey in crypto trading.
And there is perhaps no better tool for monitoring this evolving PvP dynamic in real time than by observing liquidation and order flow data.
With that in mind today, let’s take a look at Crypto Jumanji….
Hunting Liquidity
When markets become as illiquid as they are now, prices become much more prone to wild swings and manipulation.
Because of this, market makers, and other large, well informed traders (predators) non-affected by FTX, are able to get more bang for their buck. This is because illiquid markets increase their ability to influence price in their favor with the use of less liquidity.
For example, someone buying or selling a few million worth of BTC in a single order doesn’t have much lasting impact in healthy, liquid markets, but in illiquid markets, a single large order delivered at the right time into a thin orderbook can cause extremely large price swings and leave leverage traders liquidated.
When these liquidations happen it forces the predatory traders (often over leveraged retail) to exit their positions at inopportune times.
Basically, they are selling low during crashes, and buying high during short squeezes. This forced buying and selling results in volatility, which is very profitable for skilled predators to trade. And is why this type of activity happens when spot volume is lower - it’s mostly derivatives.
The chart below shows us BTC/USDT cumulative liquidation pools from users trading over $10,000 worth of contracts, on greater than 5x leverage.
If you remember last week, immediately following news of FTX’s insolvency, predators smelled blood and dumped their BTC to drive price below $20k.
This escalated into emotionally driven selling, into thin order books, and the result was a washout of over $1 billion worth of leveraged longs between $18k-16k. You can see that with the large red candle and it’s lower wick tapping all the liquidity in one swoop.
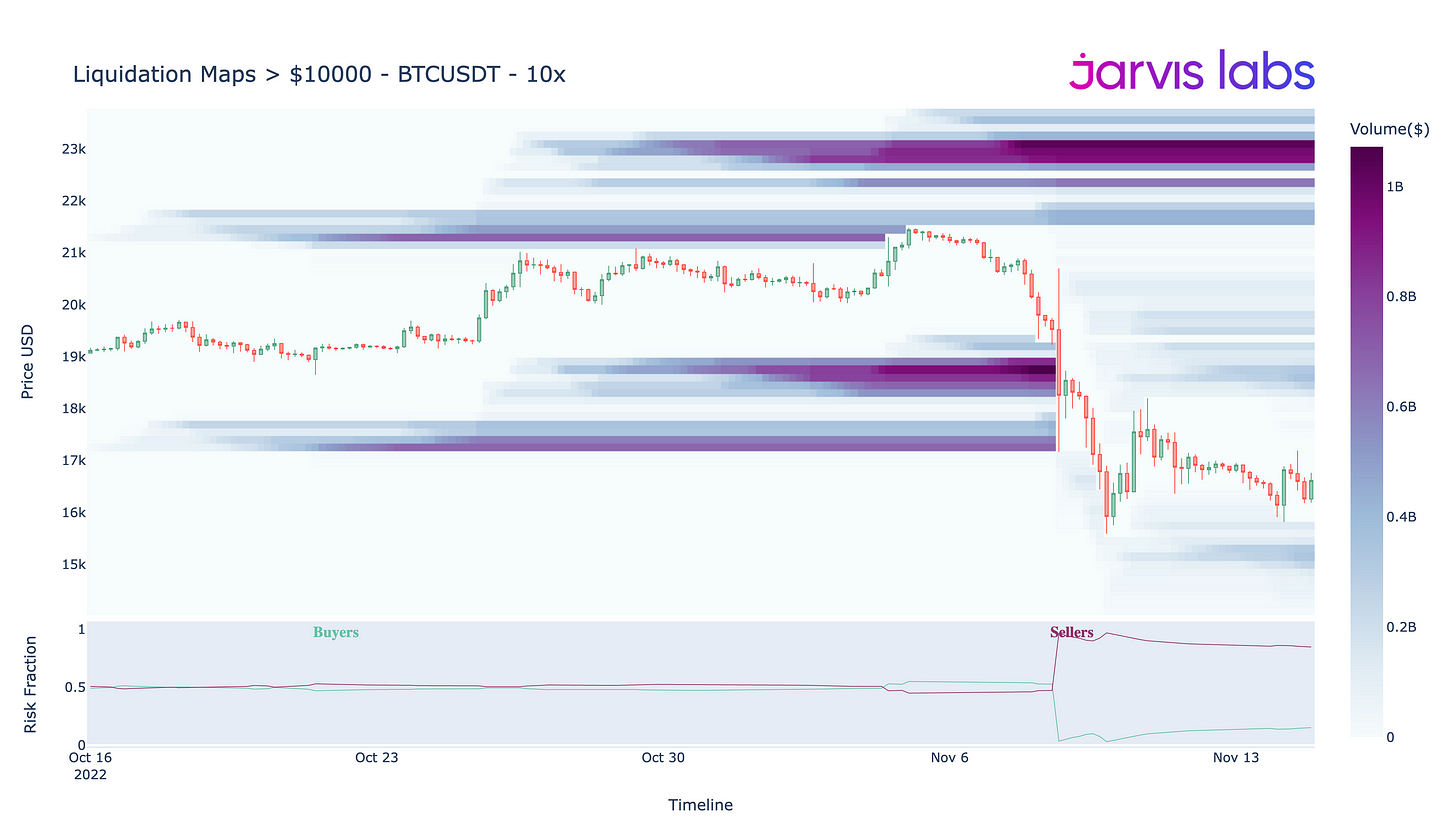
Once those large liquidity pools were ransacked did price stabilize.
What we see now are long liquidity pools (~$500mm worth) forming below 15k, but much larger short liquidity pools, totaling in the billions (larger than the amount liquidated last week) resting near $21,000 and above.
This means that currently, the short liquidity is much larger of a bullseye for predators.
We also see confluence on this when looking at BTC’s 5x chart below. This shows us additional short squeeze bounties totaling in the billions resting above $20,000.
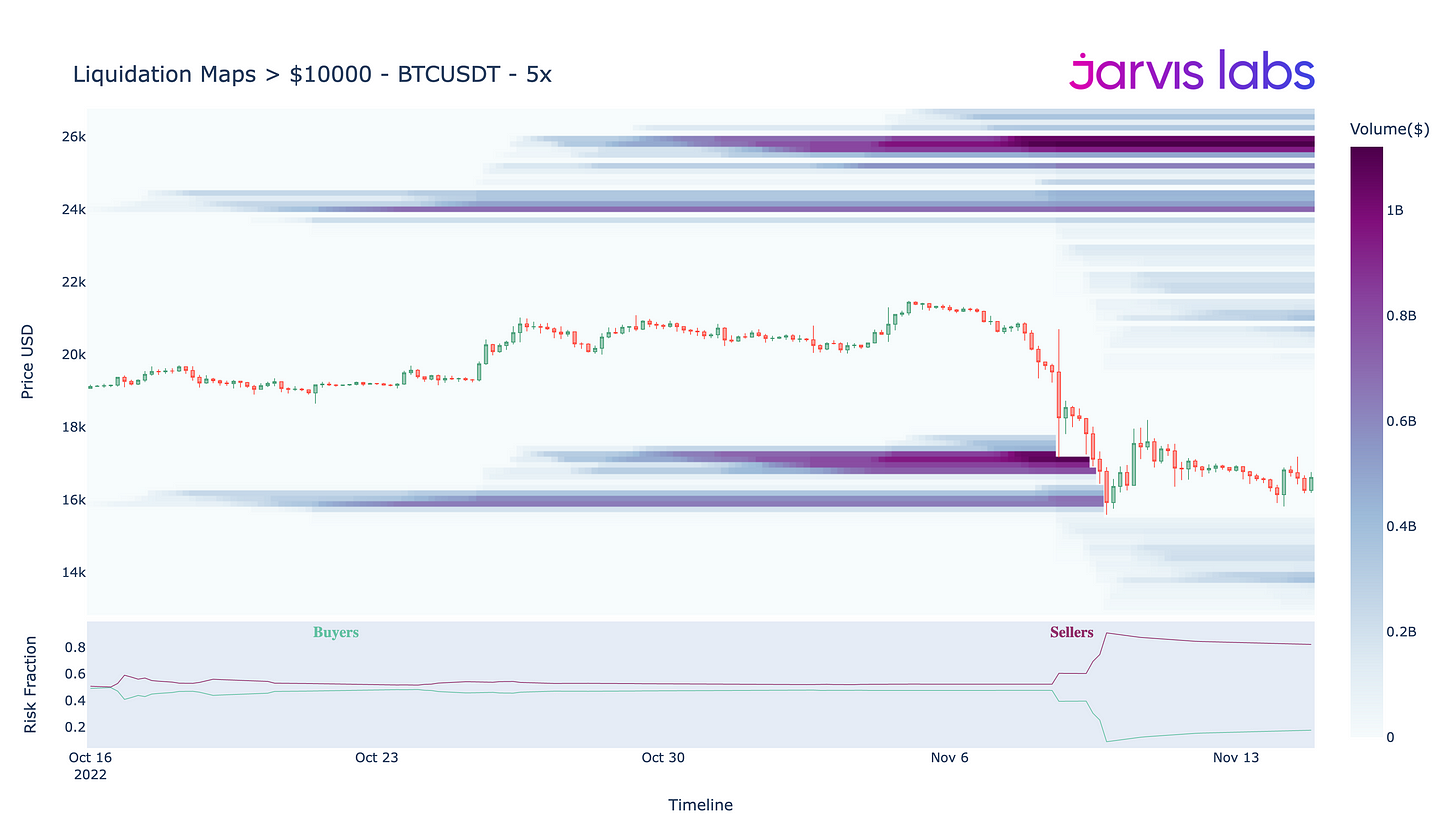
If price begins to move upward with momentum, be aware of those levels as a target points for a future short squeeze.
However, also be mindful of the smaller pools now beginning to form in the 14k-15k range on both charts. If these pools grow in value, or if price falls down below last week’s lows, leveraged longs could quickly be in danger of another major wipeout.
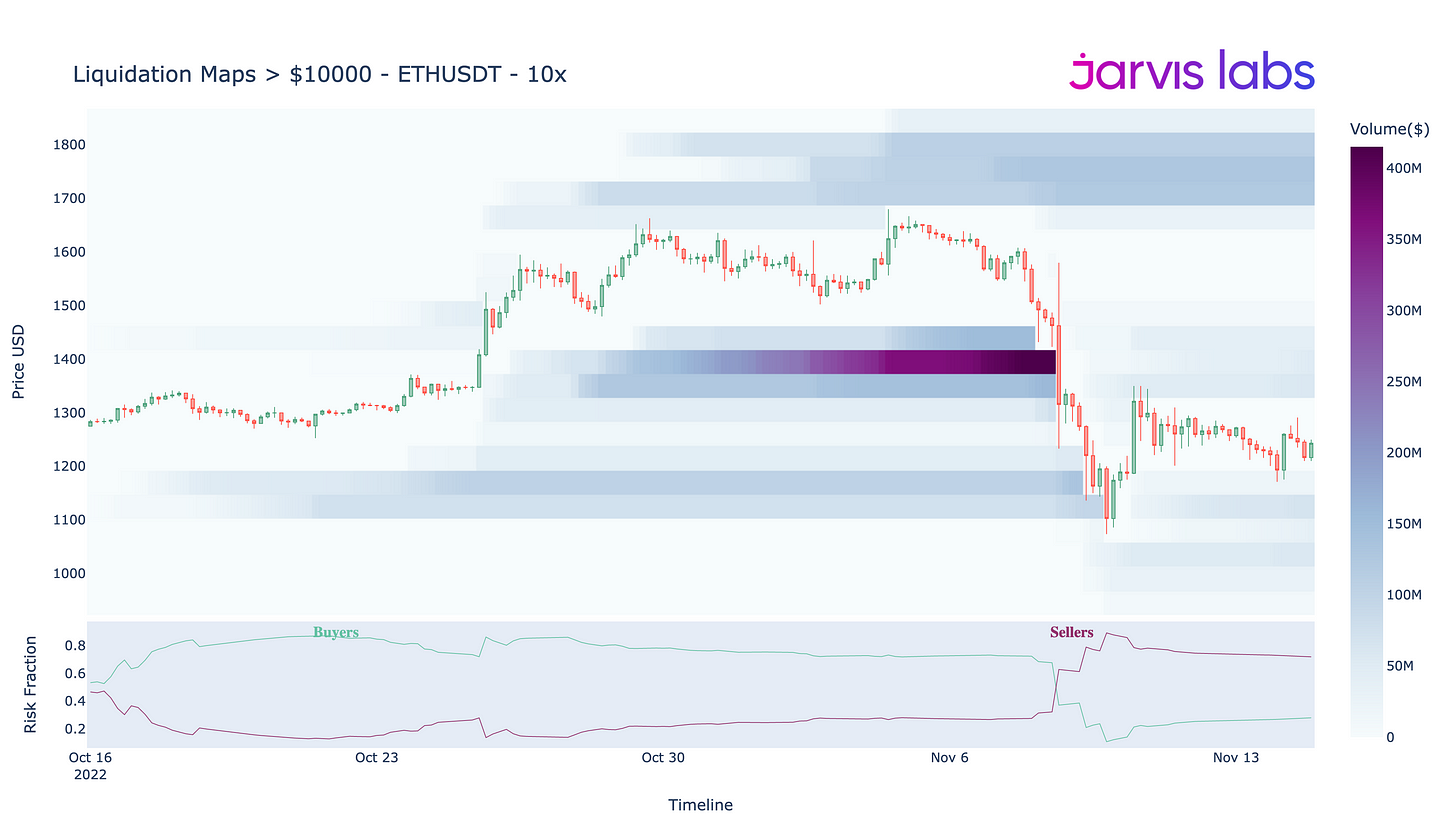
ETH’s liquidation maps all look largely similar with smaller pools on both sides, but sellers look to be more at risk of a squeeze than buyers at the moment.
After these liquidity charts, Mr Benjamin explained, the next most important ingredient to identifying any short or long squeezes before they unfold is orderflow.
Through orderflow we can better understand who is selling, how much, and at what prices. Often, this alpha gives us time to react prior to the big moves taking place.
With that in mind, let’s check out one specific tool we use called CVD, which helps us stay one step ahead of the predators.
Tracking Footprints
In order for these pools to be tapped and the short squeeze to begin, large players will need to step in and push price up against the current waves of capitulation sellers.
As we mentioned in last week’s article, all BTC holders apart from those owning <10 BTC (retail) and >10,000 BTC (whales) have been net sellers, to the tune of over 60,000 BTC, or $1 billion +, in the past 30 days and they have shown no sign of stopping.
Below we see a chart showing Bitcoin’s cumulative volume delta (CVD), which gives us insight into what class of market players are buying and selling and at what levels.
We can separate them into 3 categories:
Whale = 10,000+ BTC
Shark = 10 - 9,999 BTC
Retail = less than 10 BTC
The three demographics cumulative buying and selling is reflected on the subplot at the bottom of the image below. The brown line has ben dropping, showing that the shark class has been anxious to exit this market at nearly any price.
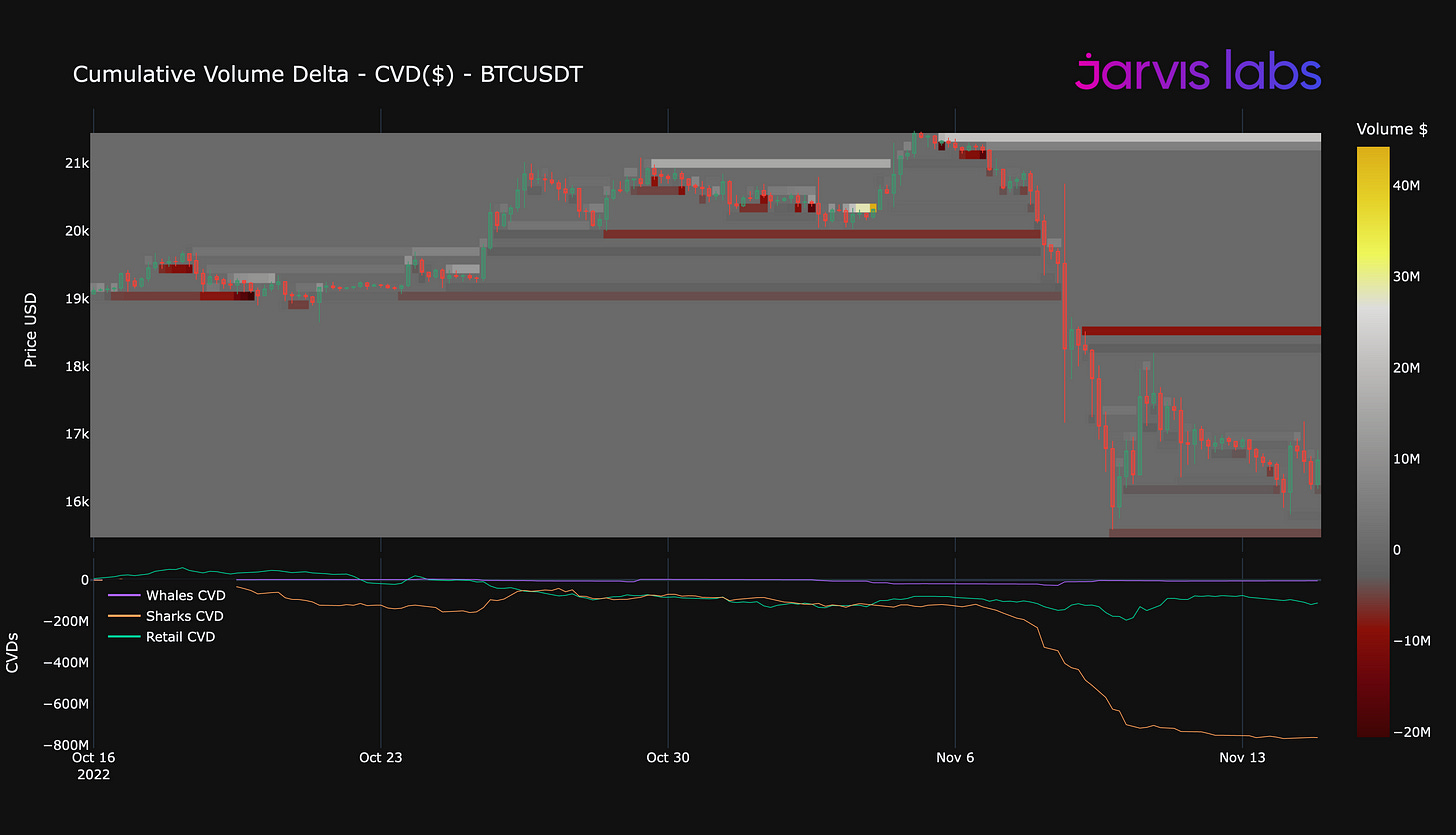
The large red line that sits just below $19k on the candlestick chart on the top half of the image shows us an area where resting sell orders sit. This is currently worth over $20 million. This means that price range will be a critical point of resistance for buyers to recapture to incite the squeeze.
If they do, be aware that the probability of price moving higher rapidly will increase. This cascade higher into liquidity pools can act as a magnet.
Keep a mindful eye on how price reacts in that range if it gets there over the next week, such a flip of resistance could spark fireworks into the end of the month.
Conversely, if price starts to find acceptance rather than support below $16,000, which could come as a result of further FTX dominos falling, new year to date lows and a lower low will likely be in order.
During high liquidity raging bull markets, our spirit animal should be that of the tiger, always on the prowl and anxious to pounce on opportunities.
By contrast, in bear markets it is wiser for most to mimic the vulture. Conserving energy and liquidity while watching the predators hunt from afar, then scavenging for opportunities in the aftermath of their liquidity hunts.
With that in mind, if you are actively trading, be cognizant of this new dynamic, how price might act if it moves into the liquidity pools to the upside, and store funds only on reputable exchanges….it’s a jungle out there.
What do you think? Comment below or message me on Twitter @JLabsJanitor
From,
JJ + Benjamin


