After the Storm
Notes From the Lab: Rebuilding After FTX's Category-5 Collapse

Over $30 billion erased in 24 hours.
If you’ve been following markets this past week, the start of this story might sound familiar. FTX’s $32 billion debacle is one of the worst events to ever happen in crypto. And yes, today we'll be discussing how it unfolded on-chain, and its implications going forward.
But our story begins with a different multi-billion-dollar catastrophe, one that hit the sandy beaches of New Jersey where I grew up.
Back in 2012, we were devastated by Superstorm Sandy. The iconic picture above shows a boardwalk roller coaster I rode as a child, which was hurled into the Atlantic Ocean once the hurricane hit.
The storm decimated entire towns and left most of us without electricity for over a month, one of the largest power outages in American history. It’s estimated the storm cost about $30 billion in damage to the state.
But what I remember most about the storm is the existential fear that accompanied inhabitants for months afterward.
We all wondered if our beloved beach towns were even salvageable.
We contemplated capitulating on our way of life, and surrendering the shoreline back to Mother Nature for good.
Because of this, we were all hesitant to begin rebuilding, worried that our labor would be in vain. A deadlier storm could always be just around the corner.
Thankfully, our collective resolve was great enough to reclaim and rebuild, and vibrant shore communities now thrive there once again. But it was by no means a linear journey to restoration.
Long after Sandy’s last rains had dried up, the trauma remained.
Monitoring the crypto market and the devastation caused by Superstorm Sam Bankman-Fried this past week, I started to get that old, familiar feeling of despair I had in the wake of Sandy.
Hello darkness my old friend.
I have no illusions over how daunting a task lies ahead for our beloved industry to regain its now-vanquished billions and accompanying public respect.
But as the old proverb goes, “A journey of a thousand miles begins with a single step.” And the first step is data analysis.
Through the data, we can uncover how we got to this point, as well as create the blueprint that will guide us in reclaiming lost ground.
So without further ado, let’s get into it.
When the Levee Breaks
As mentioned above, crypto markets withstood all they could handle and more this past week.
The community learned that one of crypto’s largest exchanges was running an insolvent $32 billion-plus Ponzi scheme.
To make matters worse, a huge portion of its operation focused on marketing, in order to lure in more capital.
This hurts not just in terms of liquidity loss, but also public trust and perception of crypto.
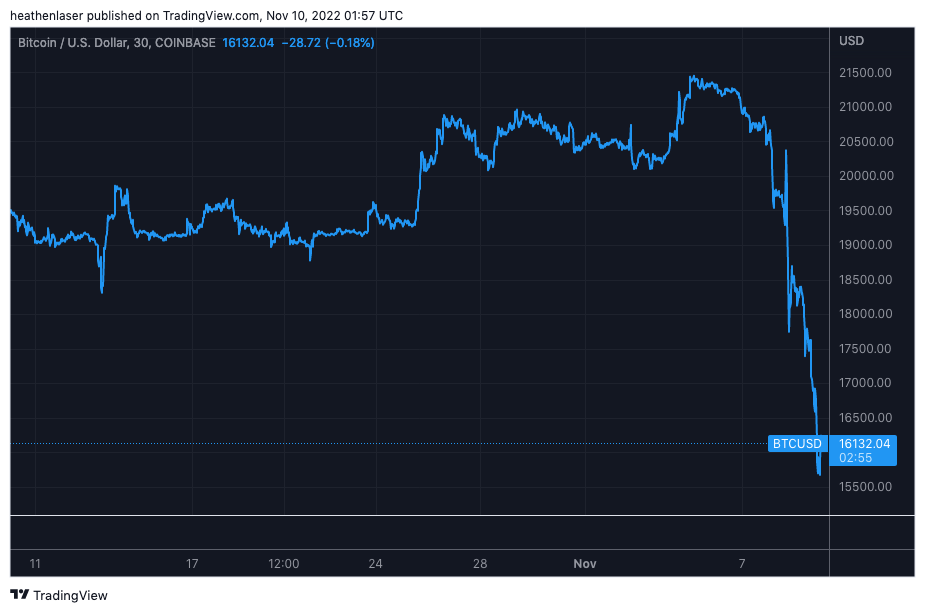
So far, this has resulted in BTC crashing by over 25% to below $15,700 in less than a day, suffering its lowest daily close since November 2020, and the total market cap of all altcoins shedding over $125 billion of value in a single day.
Two years’ worth of funny money bull market gains washed away by torrential bear market rains.
You may be asking, “Surely, some data point somewhere signaled this was coming?”
Indeed, the warning signs were there. And we’ll get to those soon.
But first, I want to highlight the importance of on-chain data. Even if it can’t predict the timing of blowups like the one that happened this week, it’s useful for managing risk ahead of potential big moves. And it’s what the smart money relies on during events like this.
Just prior to the collapse, I eavesdropped on a meeting of the minds among Jarvis’ top analysts.
They agreed the data was warning of this storm forming offshore before it made landfall.
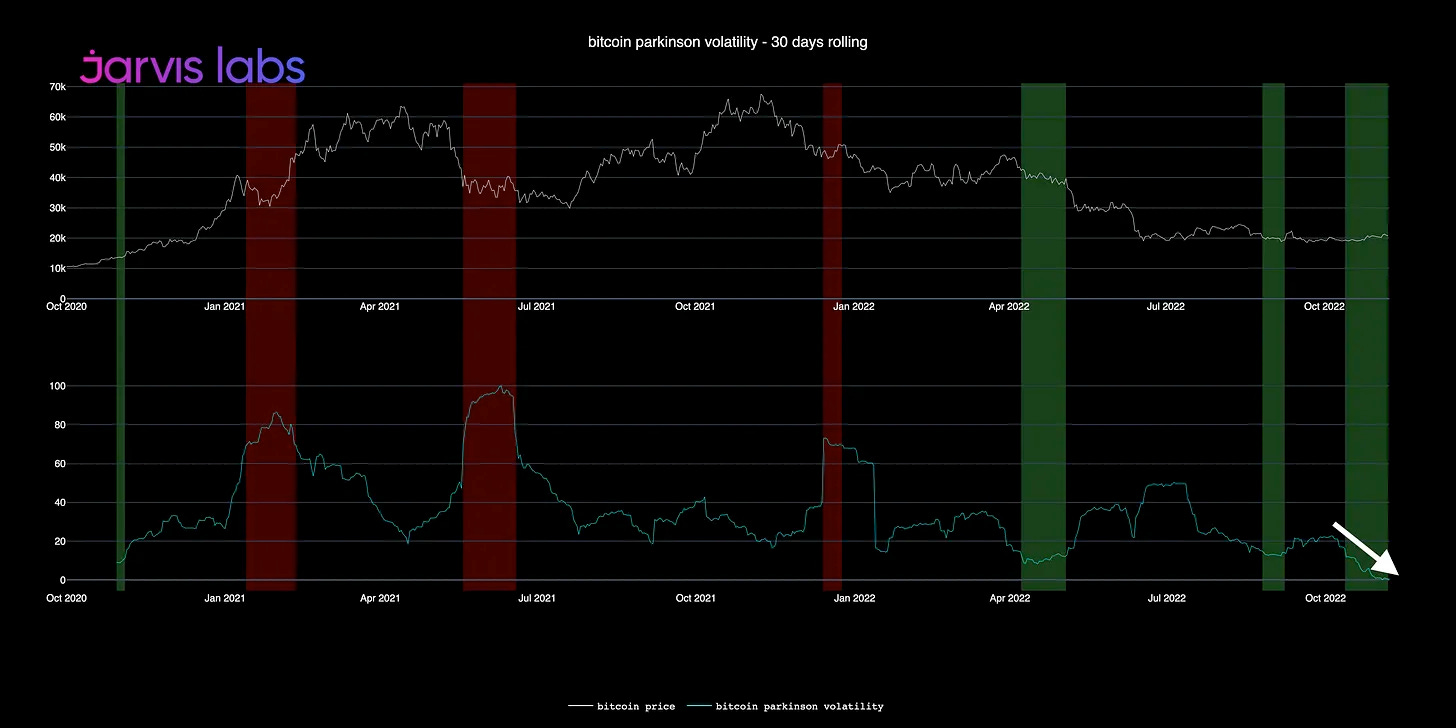
If you remember, back in September we broke down the Parkinson volatility indicator (shown in the chart below). It helps us see when major market movements are imminent.
Since mid-October, it had been giving us low readings, warning that increased volatility would be coming soon. But last week, the signal really started screaming. Once it registered all-time lows (white arrow, bottom right), a wild price storm was imminent.
Immediately, the team got to work searching for a confluence of other signals in order to determine the next move’s direction.
They found a key one when observing BTC’s whale divergences.
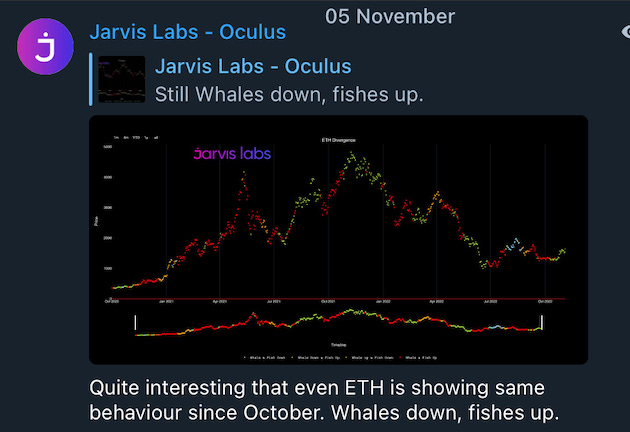
Below, we see how briefly after becoming net buyers in late October (red dots in highlighted box), this trend reversed at the least opportune time and whales once again became net sellers (green dots).
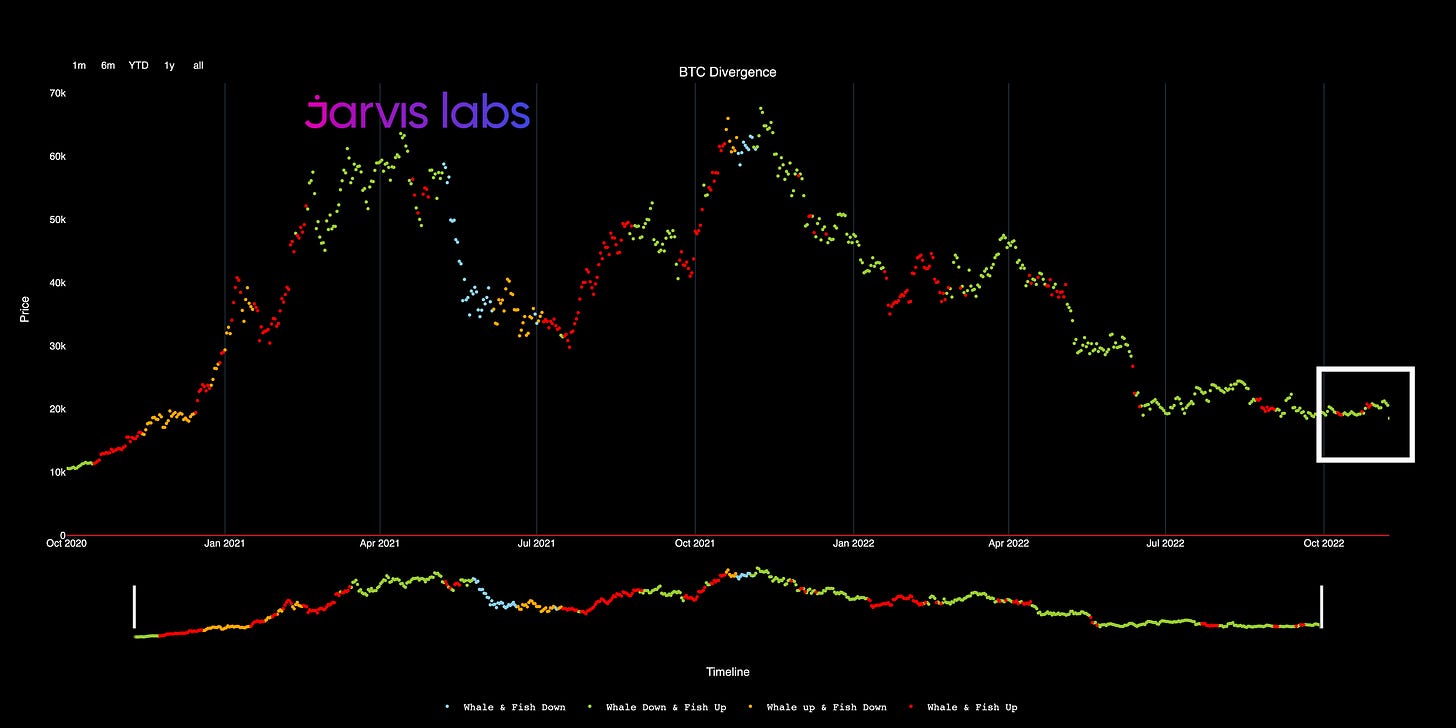
So large wallets were preparing for more volatility.
Now, that said, no one was predicting the scale of the disaster that was about to strike. Not even close. But if you dug deeper, there were a few more telltale signs that something was amiss.
Dumb and Dumber
Earlier this month, the details of Alameda Research's troubled balance sheet began to circulate.
On it were many troubling line items but none more egregious than this: Alameda reported owning over a $5.8 billion stake in FTX’s native token, FTT.
The problem? FTT only had a $3.3 billion market cap at the time. The math didn’t add up.
This meant Alameda’s balance sheet more accurately resembled Lloyd Christmas’ suitcase full of IOUs from Dumb and Dumber than it did the balance sheet of a $15 billion market-making corporation.
Needless to say, fears over the insolvency of Alameda and FTX by association began to amplify. But those who looked at the data beforehand could have seen this disaster coming.
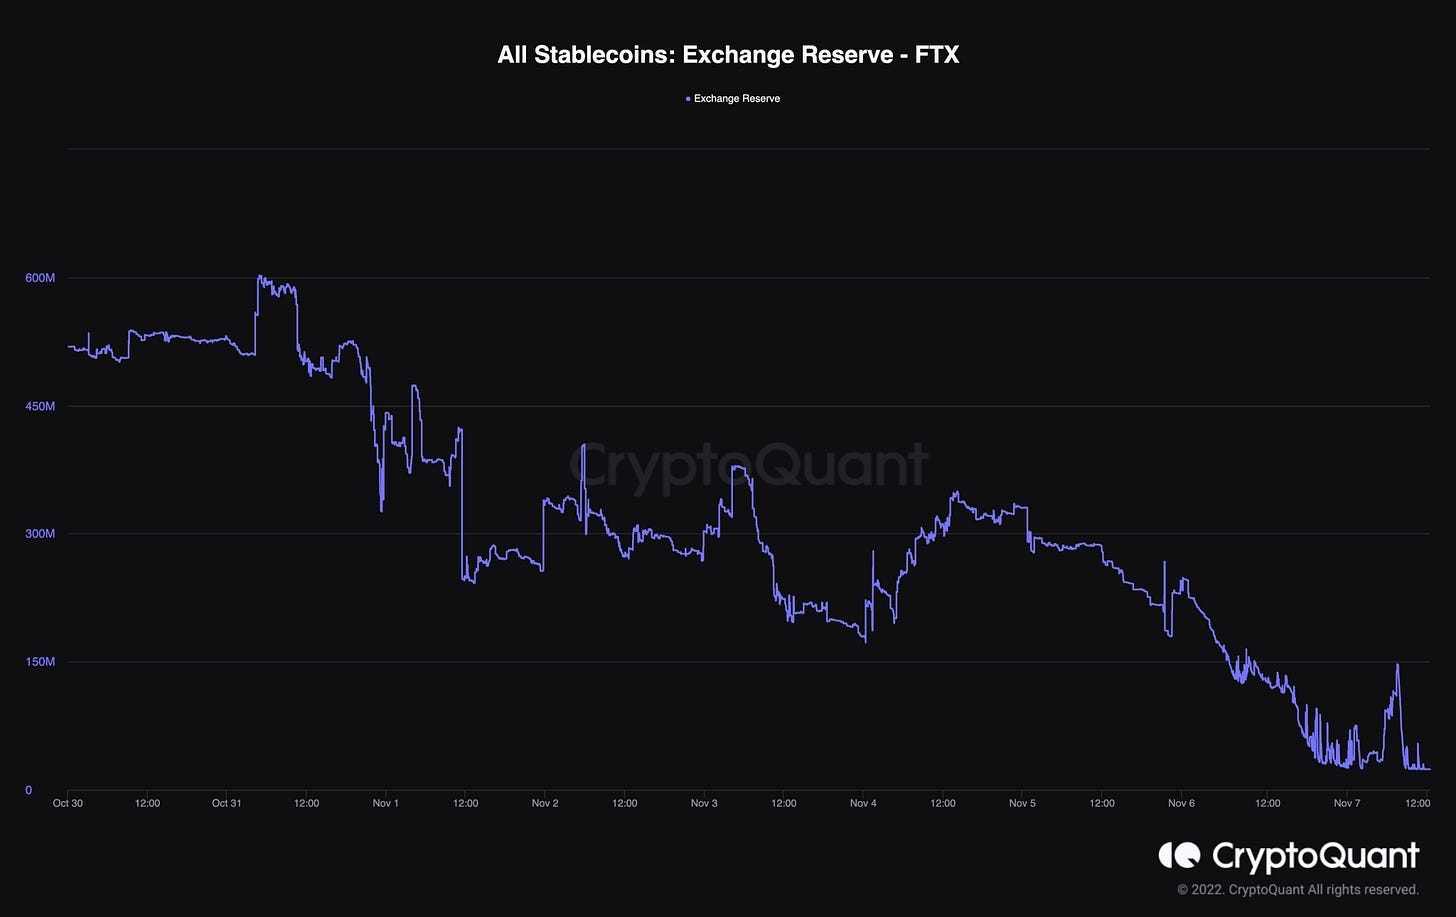
Just prior to Alameda's balance sheet leaking on November 2, FTX's stablecoin reserves began to plummet. Once the balance sheet came out, this decline accelerated, until nearly all of FTX’s $600 million stablecoin holdings were gone.
The next chart below shows how FTX’s total BTC holdings had been sharply declining since the Luna collapse of this past spring. Which is when Alameda was alleged to have become insolvent and received loans from FTX.
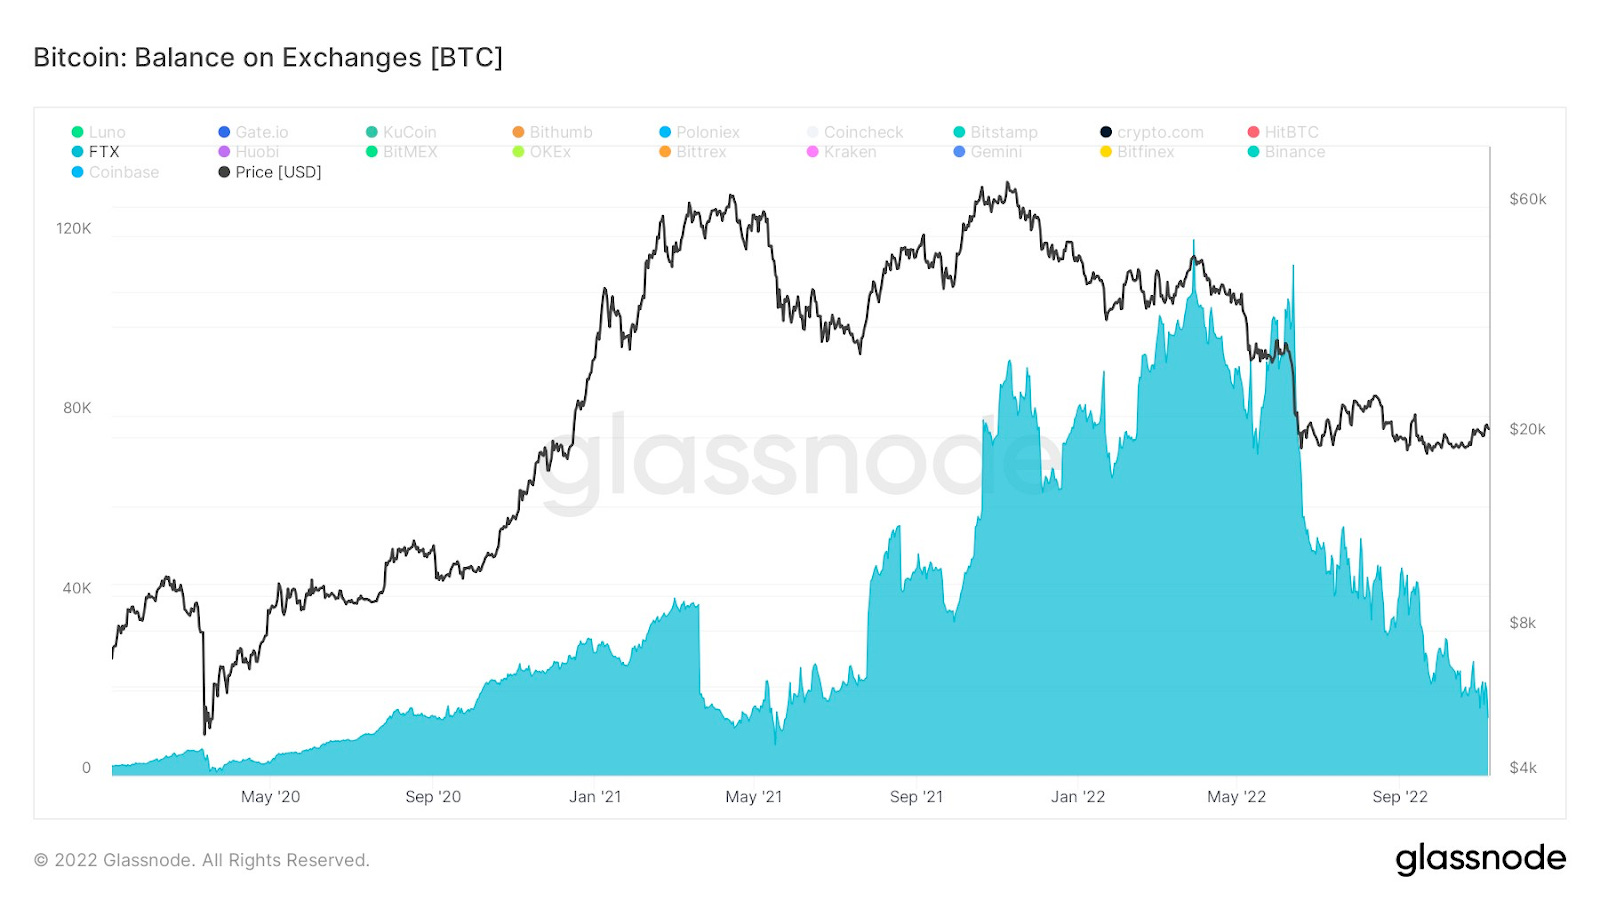
We can conclude that extremely abnormal behavior was taking place on FTX in the months leading up to last week’s crash. This slow bleed graduated into a full-blown mass exodus after Alameda’s balance sheet was revealed.
And while none of these data points alone was enough to base decisions on, all of them flashing at the same time signaled that where there is smoke, there is fire. It was time to evacuate, protect assets, and prepare for the worst.
Then, the storm hit.
In short, it left BTC’s chart looking like a disaster site worthy of its own FEMA camp.
Worse yet, we have no way of knowing just how far the unwinding of FTX’s Ponzi scheme will ripple, or who else has been hiding risk. Odds are we will encounter more and more forced sellers as price probes lower.
At the time of writing, things seem bleak. Which begs the question - is there any hope for the future?
The Effort to Rebuild
Fixing price charts as badly damaged as those of BTC and the rest of crypto is no small task. It takes years of dedication and perseverance to rebuild after a storm destroys your community.
In my experience, it wasn’t until nearly 18 months after Sandy hit that the boardwalk reopened for business, and even then, it remained a work-in-progress for quite some time.
Expect a similar lengthy road for the eventual recovery of crypto.
It won’t happen overnight, it won't happen in the time frame you want it to, but it will happen.
For every passing speculator such as FTX and Three Arrows Capital, there are quality stewards of the space who protect its longevity.
Not unlike what we talked about a couple weeks back with evergreen versus deciduous miners, same goes for long-term investors versus speculators.
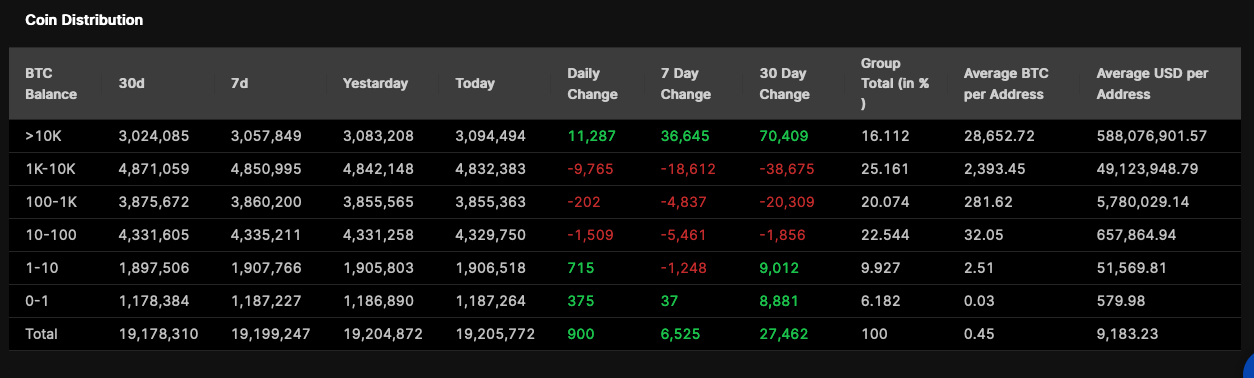
We saw an example of this on display during the crash. Megawhales (those owning more than 10,000 BTC / $500 million) became buyers and prevented prices from full implosion.
These trend numbers are staggering. Over the past 30 days, megawhales have absorbed the selling of all other holding classes, and net accumulated over 70,000 BTC, with extreme upticks happening over the past week.
Now that’s some serious conviction.
(By the way, you can now track and follow along with this holding metric live on the TARA NFT dashboard.)
Another encouraging sign has been open interest dropping as price has fallen. This could be signaling that overleveraged longs have begun getting wiped, and short sellers see this as an area of value to buy back into their position.
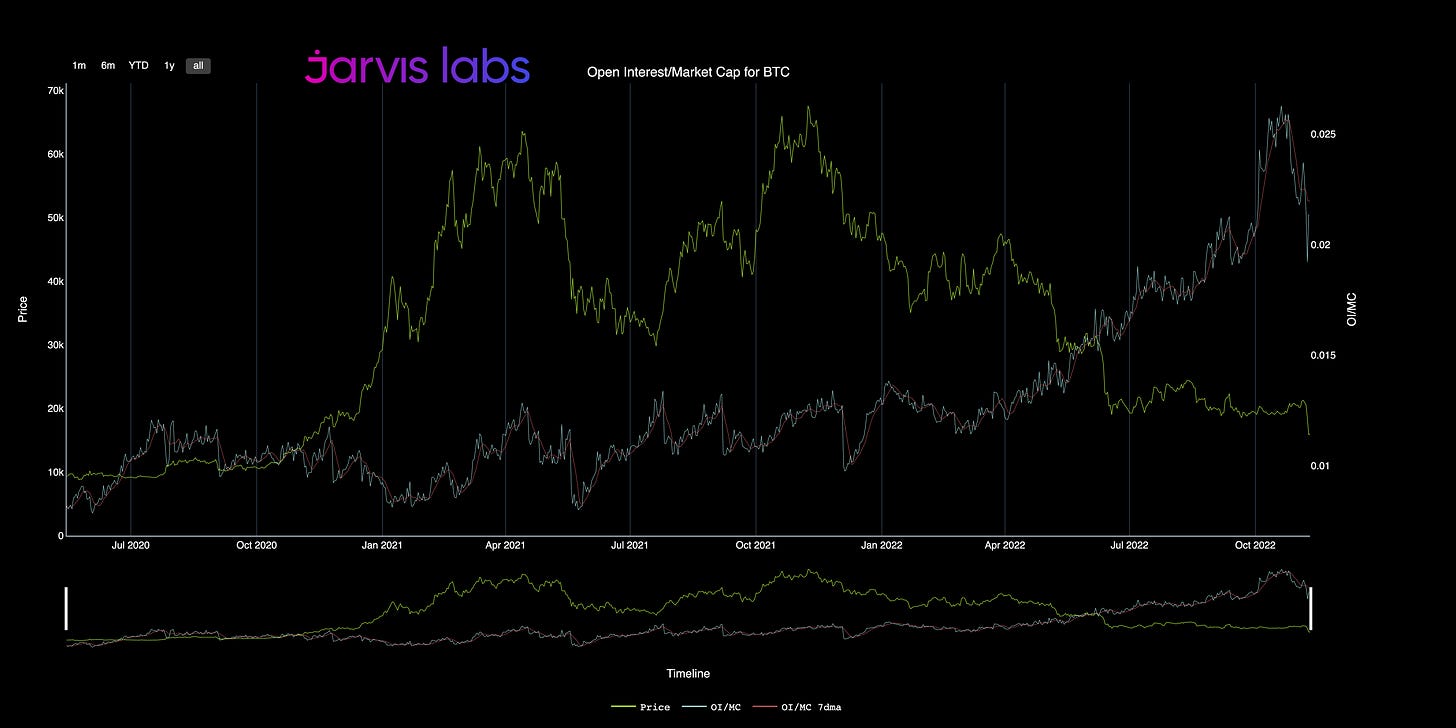
Though these indicators tell us that we’re nowhere near the bottom yet, it’s reason for optimism that the market is working its way into finding a healthy equilibrium.
This clearing out of overleveraged speculators will continue to be a painful, but necessary rehabilitation for the industry. In time, I believe we will see our communities rebuilt and flourishing once again, not unlike those along the shores of New Jersey…
Everything dies baby that’s a fact,
But maybe everything that dies someday comes back….
- Bruce Springsteen, “Atlantic City”
What do you guys think? Comment below or message me on Twitter @JLabsJanitor!
Your friend,
JJ


