The Wooly Bully Vibe
How Jerome Powell and the Federal Reserve Succeed


Welcome to what we call Single Origin. It’s a monthly write-up from each analyst that focuses on one topic. These are more long-form theses that each analyst will spend time unpacking.
We’ll publish these each Monday moving forward. So each week, you can expect a Single Origin, a Blend, and a Filtered edition of your favorite Espresso.
Enjoy!
It’ll be painful if I pick the wrong side.
That’s what you say to yourself as you look at what can best be described as a giant seesaw.
But it’s not the type of seesaw you played on as a kid. In those days, having just two people on the seesaw quickly got boring, so you and your friends would pile onto either side.
The fun came from not knowing when the seesaw would suddenly change direction and fling you and your friends into the air, and onto the ground, as more and more people climbed on.
Sure, you’re risking a bruise and a scrape… But it’s easily dismissed during the long boring days of summer.
But what if that risk was not just a small bruise or cut that can be cured with a kiss from Mom?
What if it’s your life savings…
Welcome to what the market has become. A seesaw where participants are gathering on either side of this adult-themed apparatus.
And as each day passes, it seems like the seesaw continues to add more and more mass on either side. Meaning once one side begins to heavily outweigh the other, the momentum will launch the other side of the seesaw into a dangerous position.
Each person, entity, and even financial product will be scrambling for safety.
These thoughts continue to bounce throughout your and also my mid-curved brains.
Yet, the question remains…
Do you get on the seesaw? And if so, short or long?
Today, let's get into this question by trying to gauge what is happening at the center of all markets, the Federal Reserve of the United States.
The State of Macro
Let’s rewind a bit…
Last year, rates rose at an unprecedented rate. Beginning in March 2022, the federal funds rate range climbed 500 basis points (bps) over the next 14 months, to the current range of 5–5.25%.
Then to start this year, we began discussing when rates will start to come down.
Which means we are no longer discussing 100 bps rate changes from meeting to meeting. That alone is a major change. A pivot in Fed policy.
Now, for those who might remember, about a year and a half ago I wrote a three-part series called “Macro Cycles.” The main analysis was how various markets reacted to the federal funds rate cycle.
The cycle is simple… Rates are low and then begin to rise. They then stop rising, and soon come back down. It’s a simple way to interpret the Fed’s actions for many decades now.
This four-stage cycle can then be broken down a bit further by looking at it through the lens of Eurodollars, Treasury yields, and inflation.
What I’d like us to do today is just re-evaluate where we are in this cycle. And what the current fight for the Fed is as it looks to stop raising rates. Because if it’s unsuccessful, then rates will likely come right back down.
To begin, let’s just bring up a chart of the federal funds rate and the S&P 500 over the past three decades, with these four parts of the cycle labeled:
- White boxes: low interest rates, very bullish market
- Yellow boxes: rising rates, sideways market
- Green boxes: high interest rates, very bullish market
- Red boxes: falling rates, very bearish market
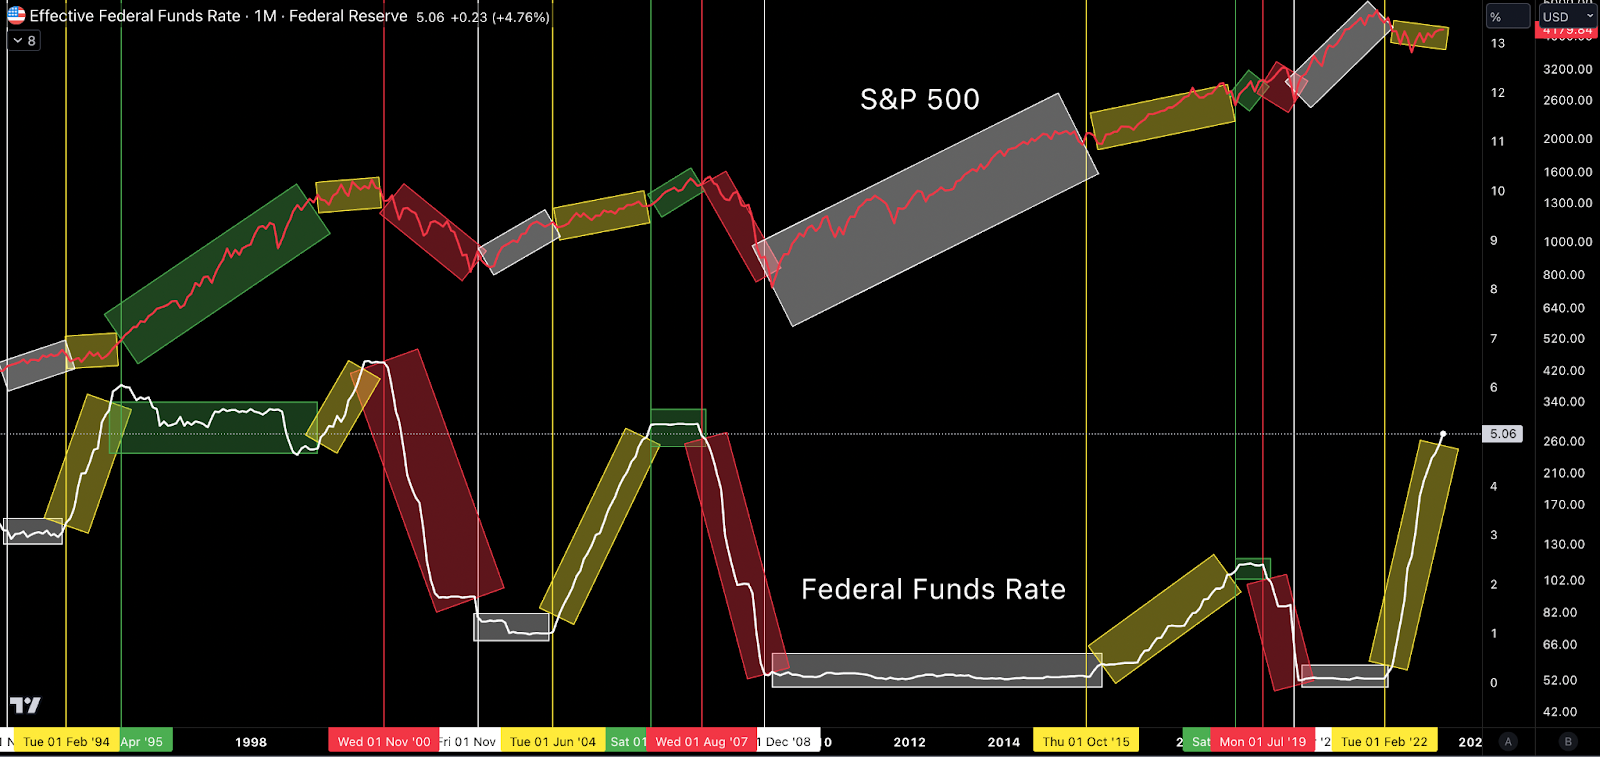
After you sit on this chart above for a bit, I hope you come away with a similar view…
The transition from rising rates to simply rates that stay elevated and steady is in fact good for market prices.
This feels almost at odds with many of the doomers populating your timeline. These are the analysts that say that the recession is here, Airbnb revenue rates will trigger cascading bankruptcies in retail housing, and commercial real estate is coming to a head.
And to be honest here, those doomers all have valid points. Commercial real estate and corporate debt look like a ticking time bomb.
Which is what I mean when I say the market feels very binary. Either it’s up to the moon, or a fatal crash. A seesaw with several tons of weight on either side ready to give way. It’s not a game for the faint of heart.
And with rates set to stop rising and sit steady, based upon our chart above, things look good.
But are they? Well, let’s do a quick recap and then dive into what Jerome Powell is preparing to go to battle with as he sits in his office shadowboxing Mr. Inflation.
Bully
Rates are rising. Great. And once they stop rising…
Ay, wooly bully
Watch it now, watch it
Here he comes, here he comes
Watch it now, he get 'cha
No need to second-guess the meaning of anything, just get up and dance. It reminds me of the song “Wooly Bully.” Nobody really knows what it’s about. Apparently it’s just a song that is about a cat, and the beat is supposed to get you to dance.
So maybe we should just stop thinking so much. “Just vibe,” as I’m sure Kyla Scanlon would say, while reminding us that the current macro outlook for the U.S. is actually not so bad. Q1 2023 GDP rose 2%, well above estimates.
Which is in part why if rates stop rising, maybe we’ll just realize things will be allowed to normalize a bit. Capital will get allocated with a bit more logic instead of fear.
The part driving this mindset is what the market thinks the cost of capital will be in the nine months to come… Which is to say what the federal funds rate will be.
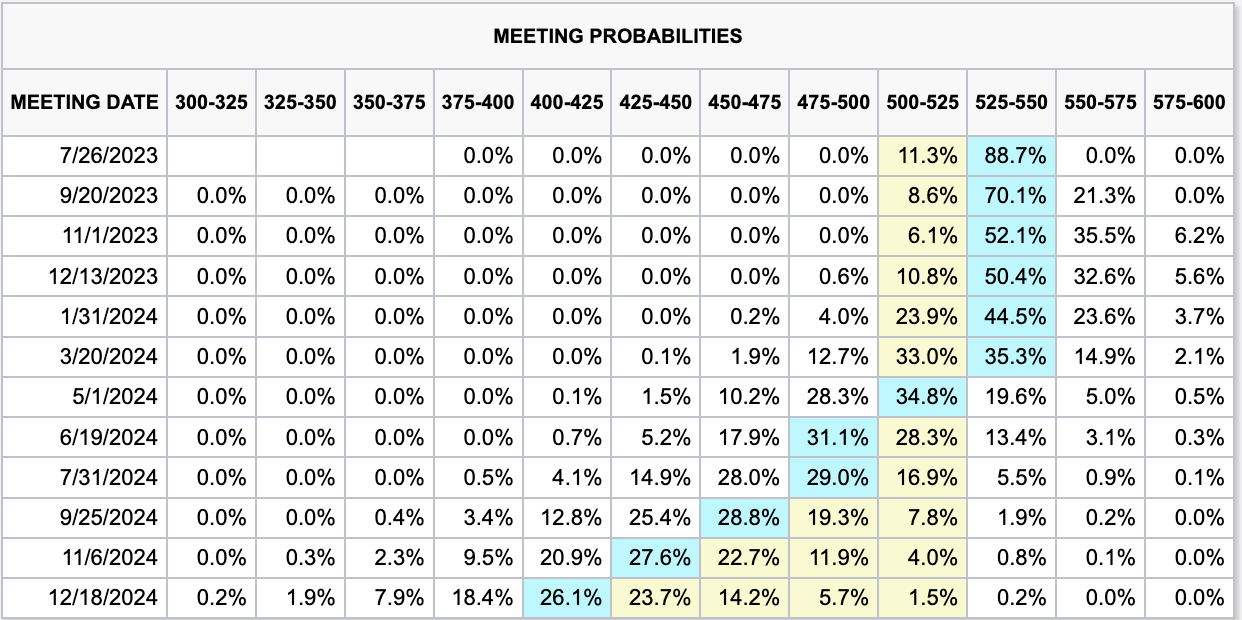
We can see that in the table below, which shows what the market thinks the FED will set rates at in the future. Without getting too into the weeds here, just note how the blue squares (the highest probabilities) go straight down into March 2024. It’s a sign that the market thinks rates are settling in here at this high level for a while.
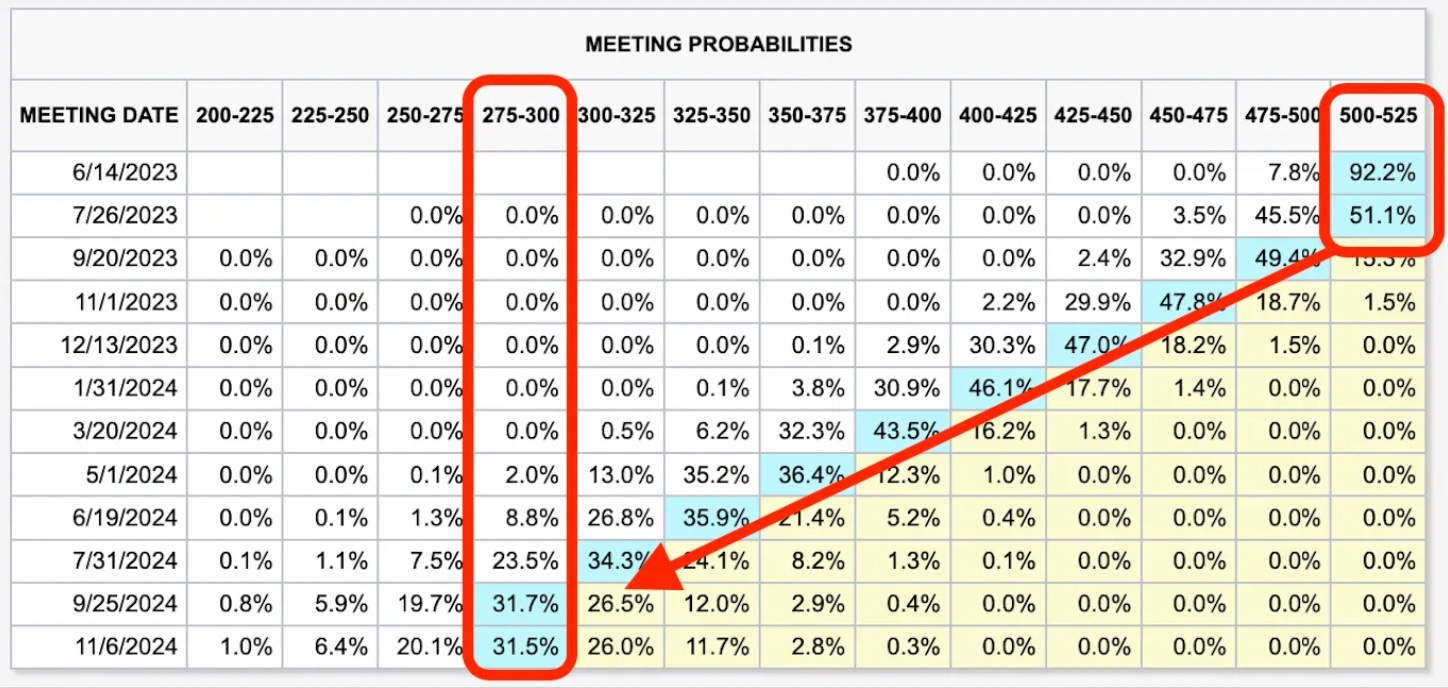
This is in contrast to what we saw in January. The table below is the probability table from seven months ago.
As you can see, the market thought the Fed would raise a few more times, say “oh shit,” and reel it back in.
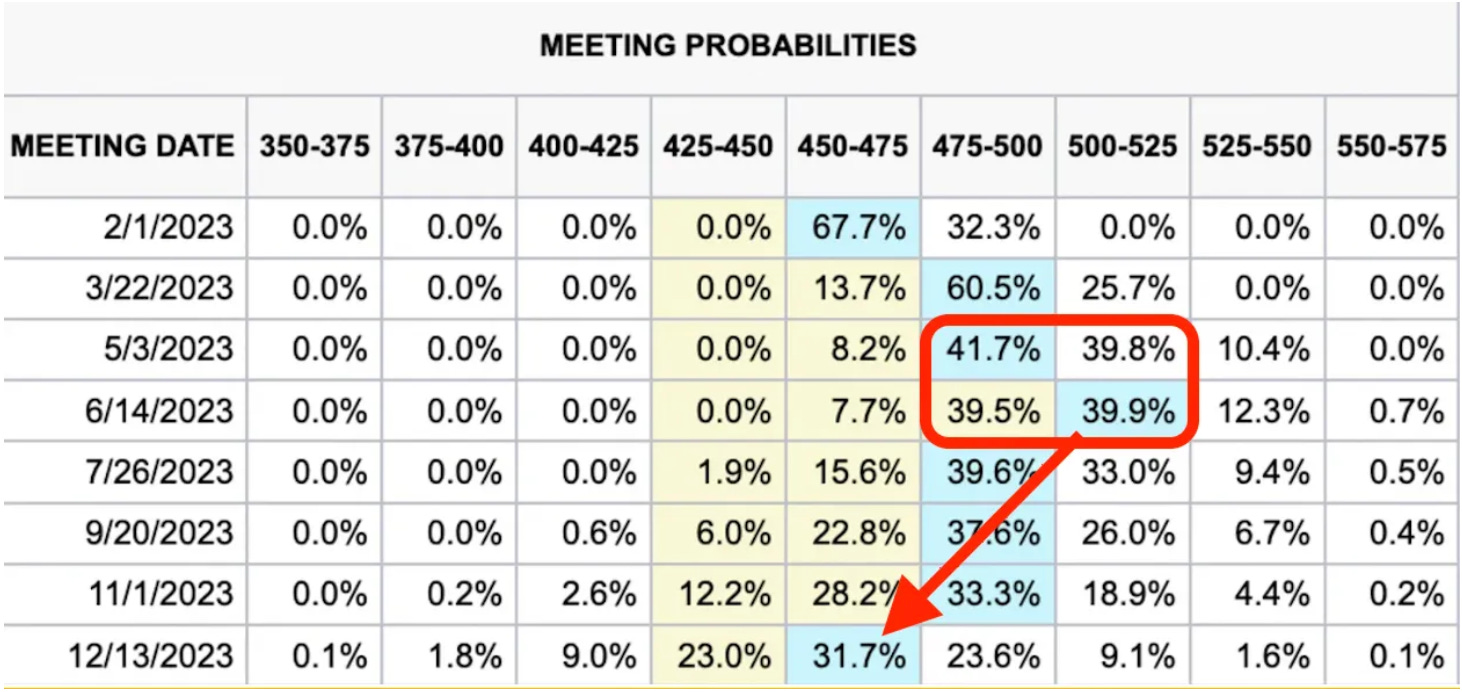
The same could be said in May of this year. Here’s a table from back then suggesting the Fed will go ahead and try the next 25 bps hike, and immediately reverse course.
But now, the probabilities are suggesting rates are staying elevated for longer. Don’t go too deep into the interpretation here, just realize that the economy is starting to vibe with the higher rates.
We are all starting to untense from feeling like everything is on the brink of utter collapse.
And this change in comfort levels and expectation is exactly what Powell needs to go ahead and attempt to thread the needle.
The Flip
Back in January of this year, I made mention of what looks to be the gameplan for Powell. He was aiming to push the front end of the yield curve as high as he could without everything collapsing.
Then, once it was high enough, with a sudden jerk lower, the far side of the curve would rise higher. It would be a cure for the truly maddening dislocation taking place with the U.S. Treasury yield curve inversion.
To better illustrate this concept, I had our state-of-the-art graphics team put this image together. The solid black line represents the current yield curve inversion, but if Powell pulls off this maneuver, it will normalize into the dotted line, a normal yield curve.
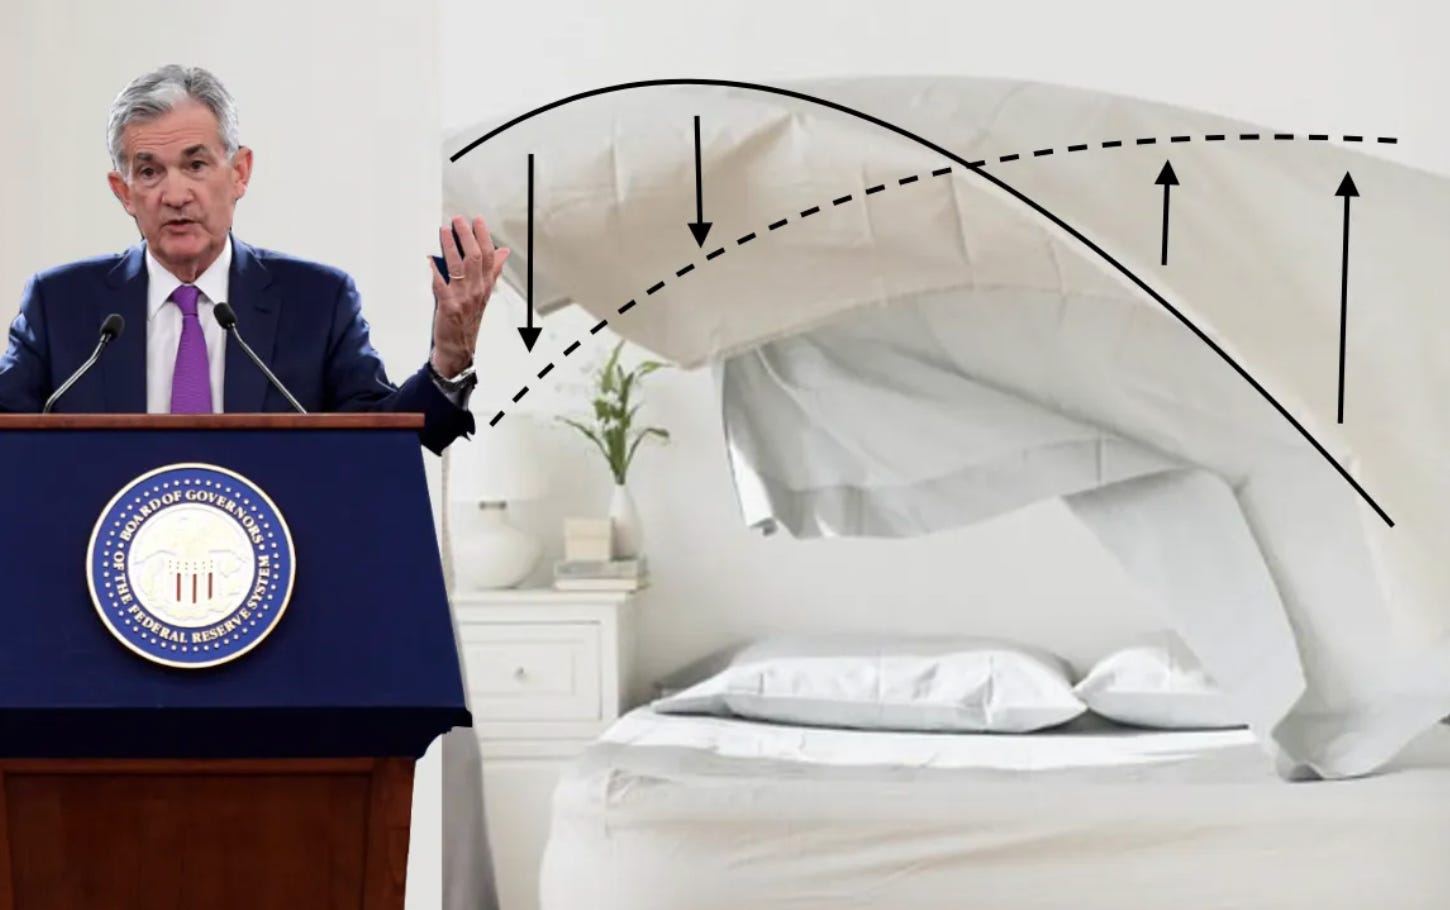
I still think this maneuver is on tap for the second half of the year.
In order to pull it off, Jerome needs a little help from the white-haired penguin sitting at the U.S. Treasury, Janet Yellen.
The U.S. government holds debt auctions almost every day of the week it seems. It’s an addiction.
Most of the auctions are for durations between 4- and 26-week Treasurys. Meaning the debt gets repaid fairly fast.
This is in stark contrast to 30-year debt, which is auctioned off during the first week of each month.
Now, the Treasury needs to continue to issue these short-term debt instruments. The rates on these instruments help drive the cost of borrowing in the economy.
The federal funds rate sits at 5–5.25%. If we pair what the Fed’s rate is with what the rates are for other Fed activities in the chart below, we can see these rates are all pretty similar over time.
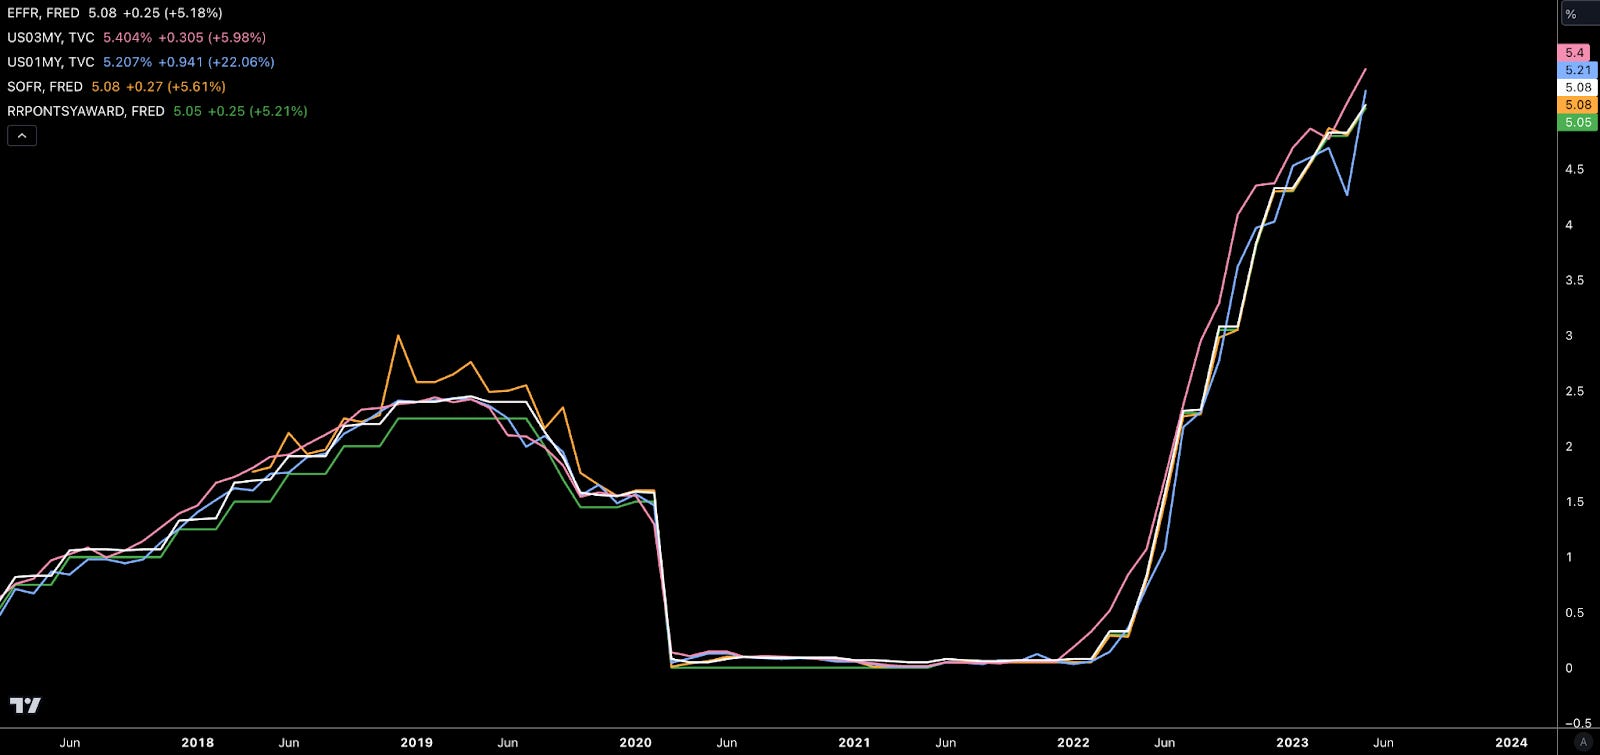
Which makes sense. If 1-month U.S. Treasurys suddenly started to yield 3%, capital would likely flow into these other facilities to earn higher interest rates.
This ebb and flow around similar rates keeps things relatively in check.
But when we look at the 30-year Treasury, it’s below 4%. That’s in stark contrast to the chart above where all rates are above 5%.
While this speaks to a few things – such as the market being unsure whether rates will be at 0% or 10% in a year – it doesn’t mean it can’t be fixed.
As demand for debt goes up, the issuer doesn’t need to offer as high of a rate. They can go ahead and borrow money for less.
On the flip side, if the issuer doles out too much debt, they will need to pay a higher interest rate on that debt. This is like getting a mortgage on your house. The more debt you take on, the higher rate the bank will come at you with. Intuitive enough.
Well, right now the U.S. government is not issuing much long-term debt. This means demand for that debt is outstripping the current supply. Which in turn, drives the yields down.
Here is the CME Group’s latest notes for the June 30-year Treasury auction results to back this up.
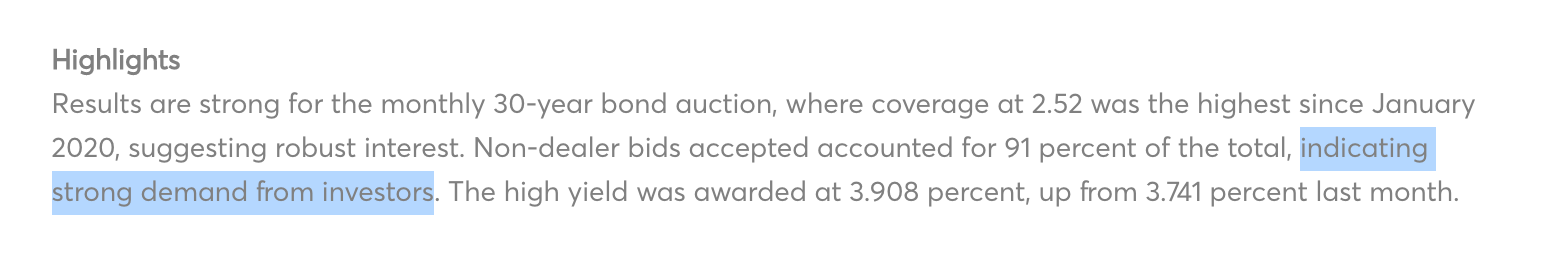
The demand is healthy for long-term debt. That 2.52 bid-to-cover ratio in that quote above is very good. Anything above a low 2 is considered healthy.
Not to mention, there is also more than $2 trillion sitting in the repo market. This is dry powder that the Fed is using as a tool. The market drops capital in the repo, earns a sizable and secure yield, and sits happy.
Once the Fed tells that capital to go elsewhere, it’ll likely go to the next form of secure and pristine capital… U.S. Treasurys.
The issue here is that the market wants short-term debt. Mainly because the rates have been rising for what almost feels like an eternity now… But in reality, it has only happened for like 16 months.
So if the Fed told the dry powder in repo to go elsewhere, it’ll seek short-term Treasurys. That’s because in a rising yield environment, capital seeks short-term debt in order to lock in the higher rates that are coming soon.
Remember the demand and interest rate thing mentioned before?
If a flood of demand enters short-term Treasurys, the rates will drive lower. Meaning the whole cost of capital issue will rear its ugly head. Which is why Jerome needs to be the first to make the move.
The old bedsheet flip. Jerome drops the rates ever so slightly, and now it’s ok for some repo money to hit the Treasury market since Jerome is signaling to the market he is no longer raising rates.
And if this is paired up alongside some rhetoric about rates staying flat for a certain period of time… Then expect 30-year Treasurys to become “hot.”
Again, can’t let too much demand hit those Treasurys, otherwise yields will drop hard. It requires a very methodical sequence. And with $2 trillion of demand ready at the helm, you can see why more debt is needed.
This is the maneuver I expect to see in the second half of 2023. And we should be able to spot it coming…
Thank you for reading Espresso. This post is public so feel free to share it.
The Cue
The Jackson Hole Economic Symposium, a meeting where central bankers from around the world gather to talk shop, is happening in August. This is likely a good forum for the Fed to explain its playbook moving forward.
My guess is much of this playbook will be cloaked in words like “economic productivity,” “funding de-globalization,” “anti-fragile economies,” and other $5 terms that hint at funding “stuff” domestically.
Don’t get fooled here. It’s just fancy talk for a massive dose of debt. Aka, a heavy slathering of 30-year Treasurys are coming to the menu.
To facilitate such strength, Jerome will give the economy a bit of a jolt through a small cut, and capital can be allocated more logically for longer periods of time.
Aka yield curve normalization.
This fight is coming.
But the fact the Fed and Powell have come this far is impressive. They have unleashed several economic shocks, and somehow the S&P 500 is trading above an index-level of 3000, a level where it traded prior to the 2020 pandemic. While many of us like to cheer at Powell and the Fed’s failures and incompetence, we should give some credit that they’ve made it this far.
And if they can successfully normalize the curve and keep rates elevated, that’s impressive.
Of course, there are hidden depth charges in the economy that can blow at any moment. These include commercial real estate, corporate debt, and retail debt. Even national debt-to-GDP.
These are things that don’t look ready to sustain longer periods of higher rates.
They are areas ripe for concern.
And when we talk about how the economy feels like it is bound for a binary outcome of up only or doom… This is why.
On the one hand, we can see how yield curve normalization would be a positive for the economy.
One area that would benefit greatly here is crypto. The idea of higher productivity through automation – similar to what smart contracts offer – is the sort of thing that would place crypto on the map.
Pair it up with a Bitcoin ETF approval… This would paint the sector in a favorable light. It would be a global green light for money managers to go ahead and allocate to our corner of the world.
But getting there won’t be easy. The feeling of the seesaw will only continue. And if I had to speculate on what is coming…
The economy will start to vibe, we will all start saying “Wooly Bully”… And as the dance moves swing the seesaw off its axis, the game will end.
But we’ve got time. Enjoy the music while you can.
Until next time…
Your Pulse on Crypto,
Ben Lilly


