The Twin Brothers Behind Inflation
Macro Update: Which Metric Is Better, CPI or PCE?


See if you recognize any of these names…
Hunter Johansson. Michael Kutcher. Sami Malek.
Any of them ring a bell? Probably not. But you’ve likely heard of their twins.
Hunter is the twin brother of Oscar-nominated actress Scarlett. Michael and Sami are the twin brothers of actors Ashton Kutcher and Rami Malek, respectively.
I am certain that while growing up, we’ve all had opportunities to know someone who has a twin brother or sister.
But imagine having a celebrity twin. I cannot picture the pressure of trying to match their achievements or living under their shadow.
I bring this up because there’s a parallel in the markets right now.
The Consumer Price Index (CPI) is one of the most popular measures of inflation, making it one of the most scrutinized economic indicators over the past 12 months.
It also has a twin. This doppelganger is a less flashy, lesser-known indicator. But when it releases new data, the media and press don’t flaunt headlines and the world does not wait with bated breath, like they do with CPI.
However, it holds its own weight when it comes to influencing the interest rate policy in the U.S.
Please say hello to Personal Consumption Expenditure, also known as PCE.
PCE also measures inflation like its twin. Both are indicators that the U.S. government uses to gauge inflationary pressure and set policies accordingly.
But they have some subtle differences in how they’re calculated. That’s why the last CPI measurement two weeks ago showed inflation rose 6.4% year-over-year, while Friday’s PCE print came out to 5.4%.
Inflation has been one of the most concerning matters for the world in the past year. Hence, it is not a surprise to see that there’s been quite a bit of attention on CPI.
But as we’ll show you today, PCE is worth paying just as much attention. And with some recent changes to how CPI is calculated, monitoring both will be crucial in understanding the current inflationary picture in the U.S.
So now is a good time to do a quick walkthrough on the differences between CPI and PCE.
Let us start off with the indicator that the Federal Reserve (FED) uses.
Jay Powell’s “Official” Indicator
Contrary to popular belief, the “official” indicator that Fed Chair Jerome Powell and Company use for gauging the level of inflation and setting interest rates is PCE, not CPI.
Generally, the FED did use CPI prior to 2000. But gradually, it started to emphasize PCE, and in 2012, it made PCE the preferred inflation indicator.
We put the word “official” in quotes because while PCE is the indicator that the FED bases its interest rate decisions on, it would be remiss of the FED to ignore the impact of CPI.
While it’s unclear how much of an impact CPI has on the FED’s decisions, given another government behemoth uses CPI (more on that in the next section), we can conclude that CPI probably does have a significant impact.
Having said that, the inflation figure that investors should focus on when it comes trying to figure out whether the FED will pivot from raising interest rates is PCE, not CPI.
PCE is calculated by the Bureau of Economic Analysis (BEA) under the Department of Commerce. It is formulated with the Fisher Ideal index formula, and it targets the entire population in the U.S. (both urban and rural).
The data to calculate PCE comes from the National Income and Product Accounts (NIPA). This data measures what businesses and enterprises sell to customers.
PCE also accounts for expenditures paid by third parties such as charities, non-profit organizations, government agencies, and companies on behalf of consumers. This creates a larger amount of total spending from a broader span of categories. The combination of data from a wider variety of sources and a broader scope provides a bigger data pool to accommodate for variances.
Which is very different from the Consumer Price Index.
The Market’s Monthly Super Bowl
Make no mistake. The most popular economic indicator to gauge inflation is CPI.
For the past 12 months, on the day of the latest CPI number release, the nervousness, tension, agony, and sense of anticipation is so thick that one can cut it like a cake.
It is almost like the Super Bowl for the financial market.
And for good measure. Because the CPI number alone can move the market.
A higher-than-expected CPI reading means one can hear the financial markets panicking and screaming as if Dante’s Inferno had just arrived. But a lower-than-expected CPI number is greeted with glee and euphoria, along with the chest-pumping of financial pundits eager to talk about how the market defeated the FED and will force it to pivot soon.
But more importantly, the Treasury uses the CPI number as its preferred indicator to gauge inflation. Furthermore, Treasury Inflation-Protected Securities (TIPS) use CPI to determine the amount of interest bond holders receive.
Just like PCE, CPI is calculated by a U.S. government department. The Bureau of Labor Statistics (BLS), under the Department of Labor, is responsible for publishing the CPI figure. But BLS uses the Laspeyres formula for its calculation, and it only applies to the urban population (which is roughly 93% of the entire U.S. population).
Another difference is that while PCE uses business-led data to measure inflation, CPI uses a consumer-driven data set known as Consumer Expenditure Surveys (CE). CE measures what consumers buy from a business and pay out-of-pocket directly. Due to the nature of CE and the fact that it measures the cost of goods directly from out-of-pocket expenses, the data is more reactive.
In a sense, we can say that CPI is a bit more sensitive to immediate inflationary pressure as opposed to PCE.
So what are some other ways that PCE compares to CPI?
Not Quite Identical Twins
Despite their shared purpose of measuring inflation, the differences between PCE and CPI are quite significant.
Below, we have a chart of CPI and PCE with their components as well as their weightings. The CPI component weighting is the newest version after it was revised by the BLS in January 2023.
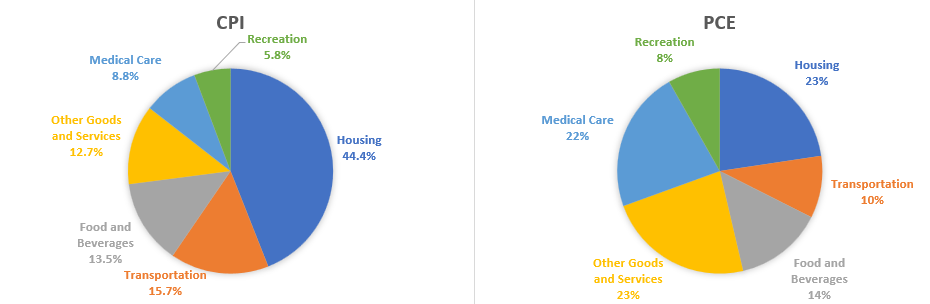
As evidenced by the charts above, the component weightings vary widely between PCE and CPI. This is one of the main factors that set CPI and PCE apart.
For instance, the difference in housing’s weighting is quite drastic. But as we mentioned in our update “Hit’em Where It Hurts,” once all the non-relevant components are stripped away, the true weighting of housing is roughly 13.407% for CPI. This figure is not as obscenely far off from the PCE calculation of 23%.
On the other hand, medical care is a much more significant factor in PCE compared to CPI. So different trends in the economy will have different effects on PCE and CPI.
Because of its formula, PCE’s inflation figures tend to run a bit lower. The chart below demonstrates the gap between PCE and CPI. PCE (blue line) is always one percentage point lower than CPI (orange line).
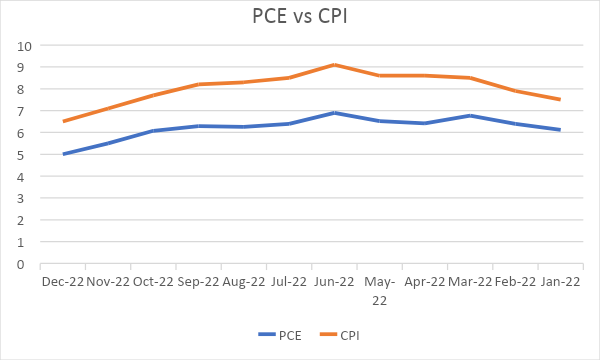
This difference has to do with substitution bias and how quickly the data can become outdated.
The CE data used by CPI is collected through surveys and phone calls to consumers. It is a more accurate depiction of how much consumers are spending out-of-pocket. It also provides more timely feedback on what the immediate inflationary pressure is.
However, the NIPA data that PCE uses casts a wider net as we mentioned above. It reflects the spending habits of households by what businesses are selling to the households. And it provides a more comprehensive dataset because it also includes third-party spending.
So PCE measures inflation of the entire nation as a whole, instead of solely retail consumers.
Also, since the data is collected from the sellers and not the buyers, spending data on more private purchases – such as cigarettes, alcohols, condoms, lubricants, etc. – tends to be more accurately reported.
That said, due to the nature of its formulation, PCE contains substitution bias. It will occasionally replace the prices of some items with cheaper ones. This is critical because it can shift the inflation figure lower.
For example, in the protein category, if beef is too expensive and consumers start buying pork or chicken instead, PCE will replace the price of beef with the prices of pork or chicken, instead of comparing beef prices from one period to the next. This built-in bias certainly drives the number lower.
The other factor is that PCE uses a one-year period for its calculation whereas the old formula for CPI uses a two-year cumulative average as a denominator. This also gives PCE an edge, as it can reflect the immediate change in the inflation figures.
This is a double-edged sword. The higher the denominator, the smaller the measuring increment. The shortened period and the substitution bias give PCE a lower inflation rate and a smoother curve.
It does not, however, reflect the immediate, out-of-pocket burden for the consumer as a whole. This is where CPI shines.
But a change is coming.
The New Look of CPI
The Bureau of Labor Statistics sent a mild shockwave through the market when it recently announced it will tweak the calculation to CPI.
The weighting components of CPI get adjusted every year. So that is not a big surprise. But going forward, instead of using a two-year average as a base for calculating inflation increments, it will be using a one-year period.
The most dramatic impact of this modification is that it will make the CPI number lower.
So for this year, instead of using a two-year average which includes 2020, the new calculation uses 2021 data solely. This will reduce the year-over-year (YoY) data that measures the month-to-month change of inflation. For instance, there are speculations that the January 2023 CPI data should really be 6.7%, instead of the 6.4% that was reported, going by the new base for calculation.
Moving forward, we can expect to see the gap between CPI and PCE on the chart above narrowing.
The new calculation will make CPI a bit more consistent with PCE. Of course, using a shortened time frame as the base, it also adds in some of the substitution biases that were not reflected from the previous calculation.
This will align the FED’s benchmark closer to the U.S. Treasury’s. The reduction in inconsistency removes the potential for confusion from the FED’s rate decision with the CPI and PCE number mimicking each other instead of a differential as we are seeing currently.
It also provides the FED with more wiggle room should the FED decide to take a more dovish stance later on.
Thank you for reading Espresso. This post is public so feel free to share it.
Which One Is Better?
Neither metric is perfect. There are pros and cons for both indicators.
Because PCE has more substitution bias built in, it begs the question of how accurately it measures inflation across the board.
For instance, say a family spends $100 on 10 pounds of beef per month. The price of beef rises to $20/pound. Since the family can only buy five pounds with $100, they buy chicken instead.
Chicken is at $10/pound, so that is 10 pounds of chicken for $100. Great! No inflation here because the family substituted 10 pounds of beef protein with 10 pounds of chicken protein.
But what if chicken was only $5/pound the month before? So instead of 20 pounds of chicken, the family swapped and substituted for only 10 pounds of chicken.
With this data, the chicken price inflation will not be accounted for because it is a substitution for beef. PCE does not really capture the entire scope of the immediate impact of inflation.
CPI will depict this more accurately; however, it can be a problem on its own as well.
This is because CPI will catch any transitory stimulus or factors that cause inflation, and that will be reflected in its number. While it’s useful to have an indicator that is sensitive to immediate changes, that might not be the best tool for policymakers.
Should an event that causes short-term inflation (like supply chains getting disrupted) occur, it would be unwise for central banks to make interest rate decisions based on data that is momentary.
Perhaps this is why the FED chose to use PCE as its preferential inflation indicator.
Regardless of which indicator is used, the out-of-pocket experience remains the same as inflation keeps rising – pain.
Yours truly,
TD


