The Next Volatility Boom
The next volatility boom.


Another worthless week.
It's at trend that's started since Bitcoin option’s market volatility peaked, just as price crested $74,000 back in mid-March.
And the recent options expiry (opex) was no exception.
As we see below, despite the strong sell off to start this past week, price rose 7.5% in less than two days to move perfectly back into the max pain range just prior to last night’s expiration.
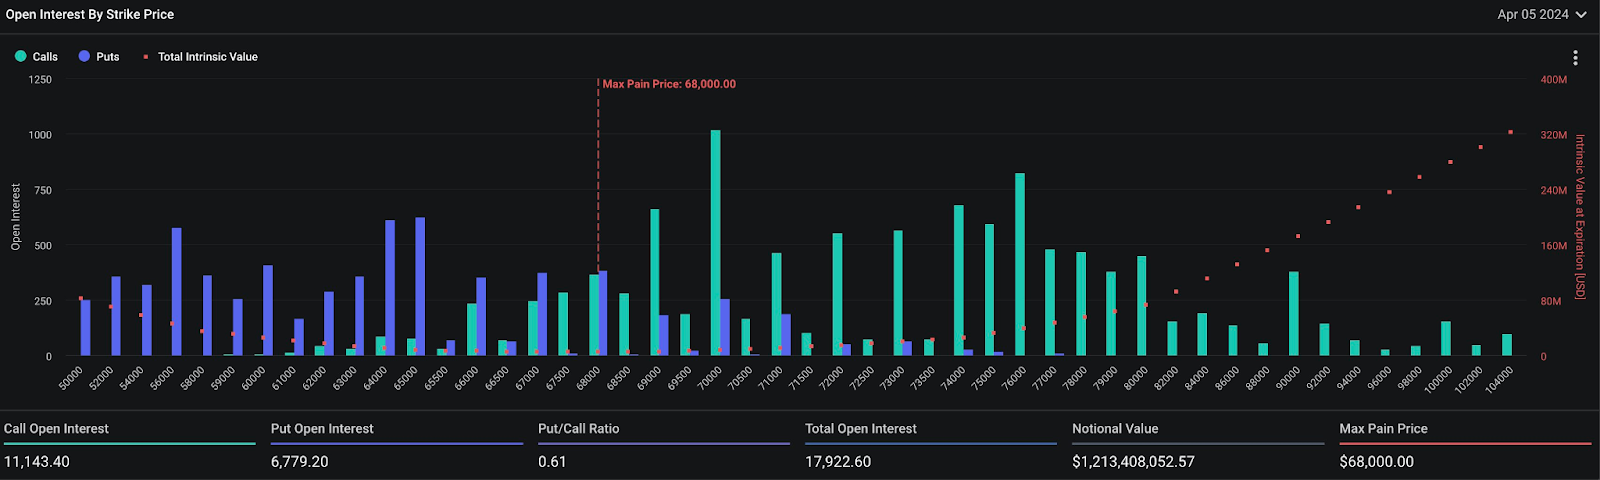
Forgive me for repeating myself, but the house wins again.
You can think of these past few weeks like options sellers extracting revenge against volatility buyers for the chaos they caused during the mid-February to early-March run-up.
During this chaotic period, we witnessed gamma squeeze after gamma squeeze - a move that forces market makers to hedge in a manner that drives price higher. This in turn drove up volatility since market makers were willing to hedge themselves at any cost.
This is the stretch where options sellers, or “the house”, found themselves on the losing side of the market.
But you know the house won’t lose for long.
Now that price has stabilized in a range of crab style price action, they’re clawing back those losses and extracting profits for themselves in the form of sold premiums. You can think of the losers here as traders too anxious for the next big price change. And now options sellers are happily pocketing the premium.
This is a dynamic we pointed out two weeks back when the tide first began to change, and it bears repeating that you need to know which regime you’re in. Right now there is no doubt we find ourselves in the thick of a volatility crush.
Comparing the current implied volatility term structure to one from March, we can see this IV crush visualized. Looking at this comparison helps us see how quickly the slope changed from the high volatility breakout a month ago, to now.
During the week of March 11th, we were witnessing IV levels over 100. The cost of call option premiums that accompanied that move was a signal that the pace of the rally was unlikely to last.
The March IV chart is below. Go ahead and look at the left side of the IV chart, and compare it to the second Term Structure chart lower on this page. Notice how the 80+ IV is now nearly 50. That’s the IV crush.
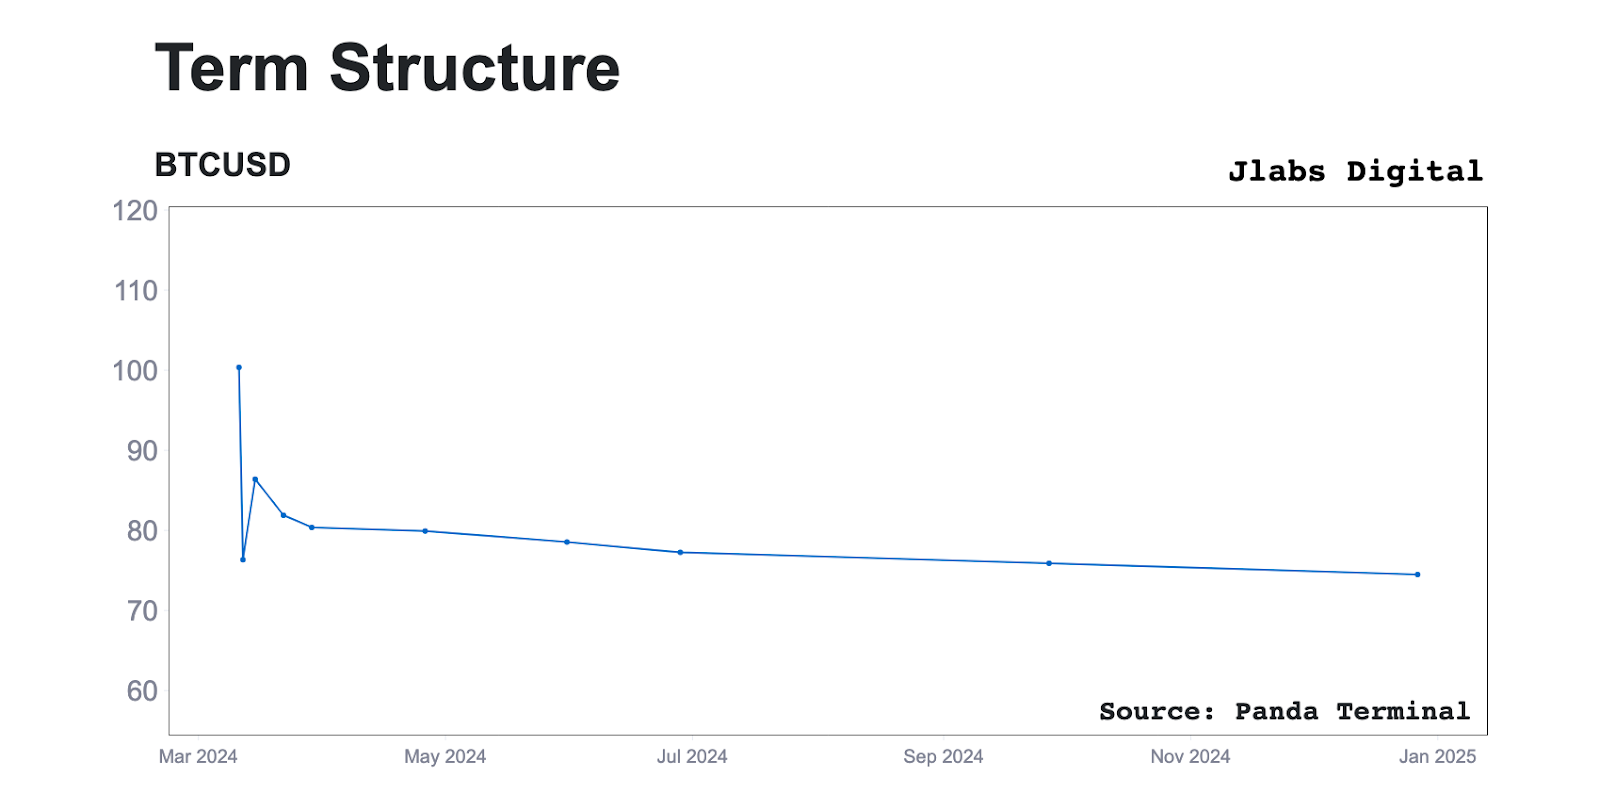
You might remember us pointing out how lucrative the opportunity to harvest yield on April expiry calls at that time was. This comparison really showcases it.
As we look to current conditions, this period of volatility compression has now lasted a month. So let’s try to find clues as to when the tide could shift again and return us back towards a high volatility environment.
If we have a look at the current shape of the term structure chart below, we see an upward slope forming as we head toward the long awaited halving event. IV rises from around 50% on April 8th to nearly 70% by April 29th.
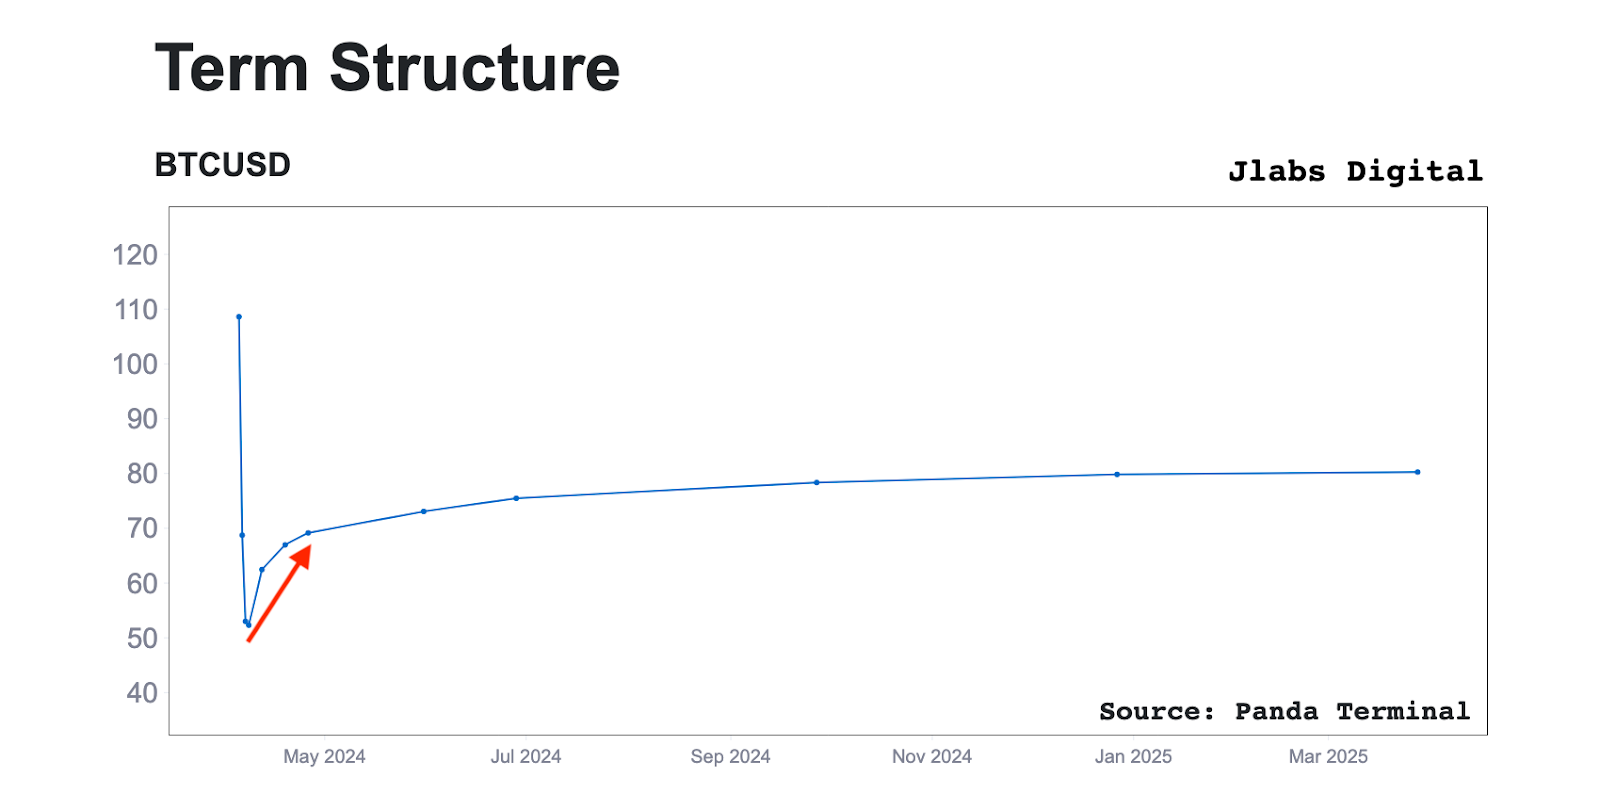
Much like the upward slope that began to form in February, we can take this as a signal that the current period of volatility suppression may be nearing its end.
With that in mind, be weary if holding too many short volatility positions into the coming weeks.
As we’ve learned time and time again this year, the options market’s pendulum tends to swing rather abruptly and erase paper gains just as quickly as it provides them.
Until next time…
Watching the tape,
J.J.


