Curved Alpha
Options Update: 9 Feb 2024


Hi all, Ben here.
Today our senior analyst JJ, who covers the options market, has a quick insight into what the market is signaling. You’ll really want to read it.
I’ve been head down getting a few projects finished up. I’ll likely still be rather quiet until we are ready to roll them out. But don’t worry, I’ll deliver a few updates and insights from the team as I can.
More soon, in the meantime…
Enjoy JJ… And your weekend!
In the 4th quarter of 2023 we witnessed quite the frenzy when it came to the Bitcoin options market.
As we see on the BVIV (Bitcoin’s implied volatility index chart, which again measures the market’s expectations of future volatility) chart below, implied volatility was, with the exception of August’s flash crash spike in volatility, consistently very low for a long period of time.
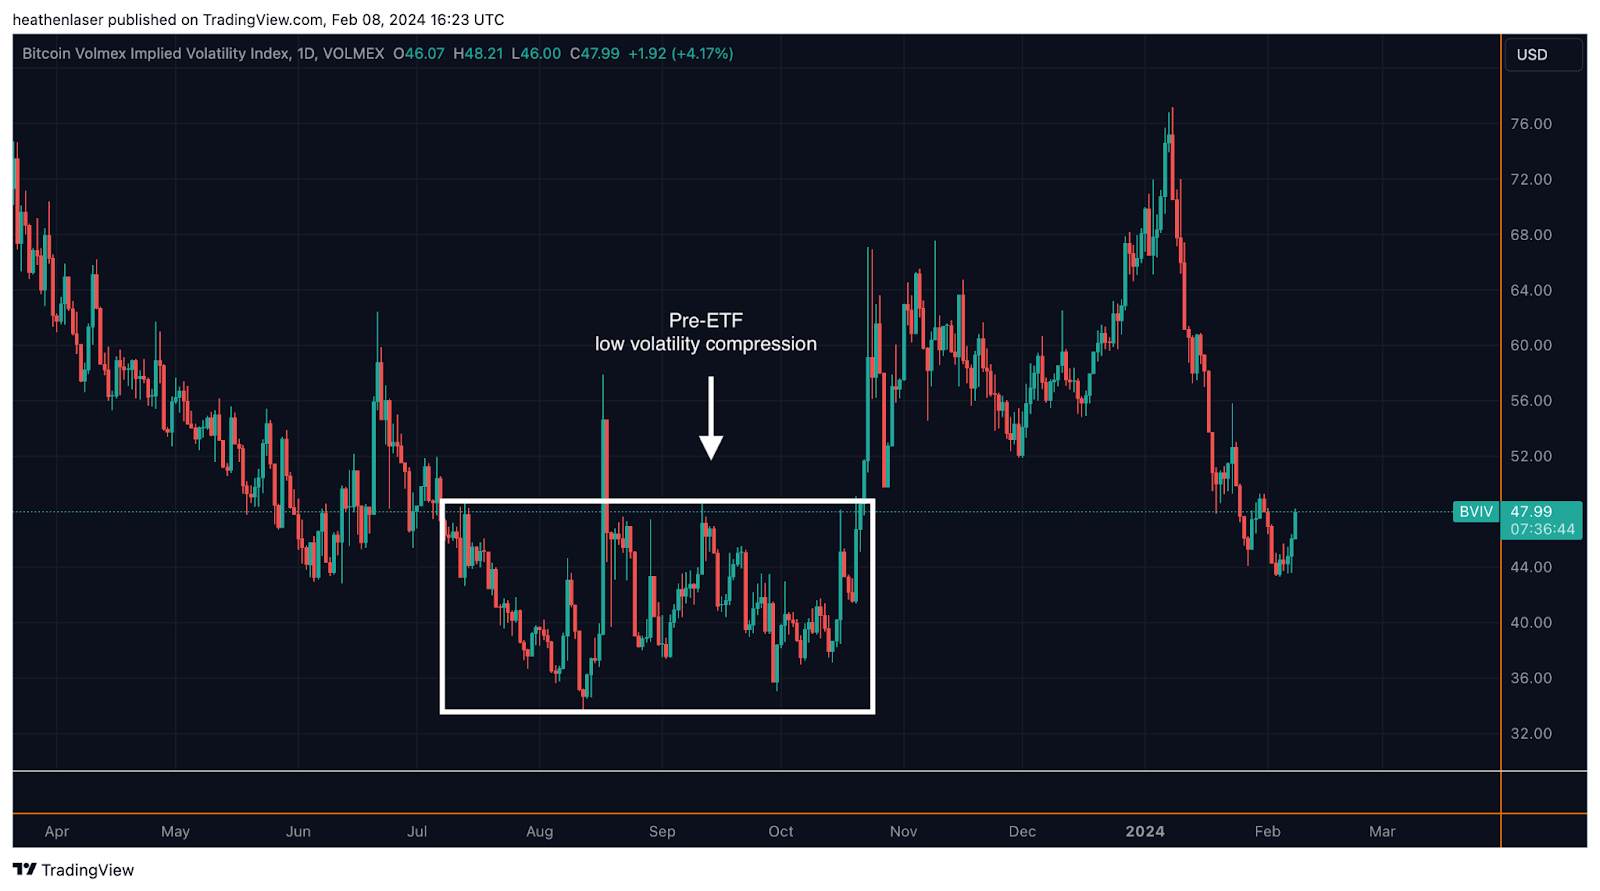
This meant that the options market as a whole was under-estimating and under-prepared for the massive leg up that came October-January as price rose from the $26,000 region to nearly $50,000 by ETF launch.
As a result, the options market had to rapidly reprice itself in a short amount of time in order to prepare for the volatility the spot ETF launch could bring about.
This sudden demand for options led to another miscalculation which sent implied volatility for January options expiry sky rocketing in a disproportionate manner to later dated options.
We see this on the IV term structure chart below, which shows us that prior to ETF January options were trading with an IV score of over 90, while options expiring later in the year were carrying an IV premium closer to 60.
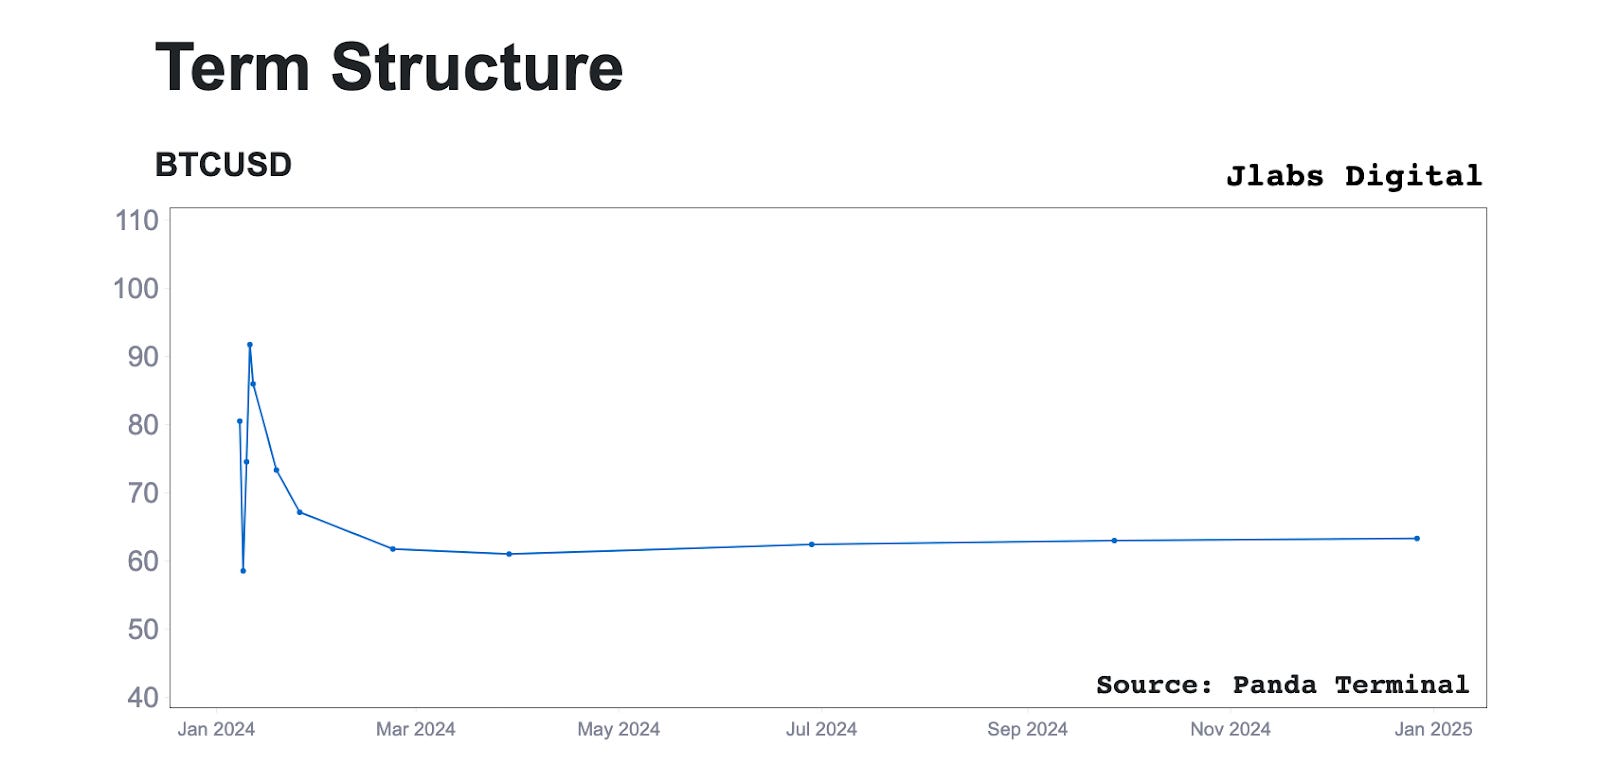
This inverted slope meant FOMO demand for short dated options was driving near-term volatility prices up and causing it to trade at a steep-premium vs longer dated volatility, which presented a lucrative opportunity that option sellers took advantage of to sell costly premiums prior to the realized IV plummet which followed the ETF launch.
This setup created conditions to suppress volatility.
Interestingly, when we compare the past IV term structure to the one we see the opposite structure now taking place.
Taking a look at BTC’s current IV term structure chart below, we see a notable spike in volatility expectations between the February 23rd expiry and the end Q1 expiry on March 29th, with BTC IV surging by almost 30% from 33 to over 42.
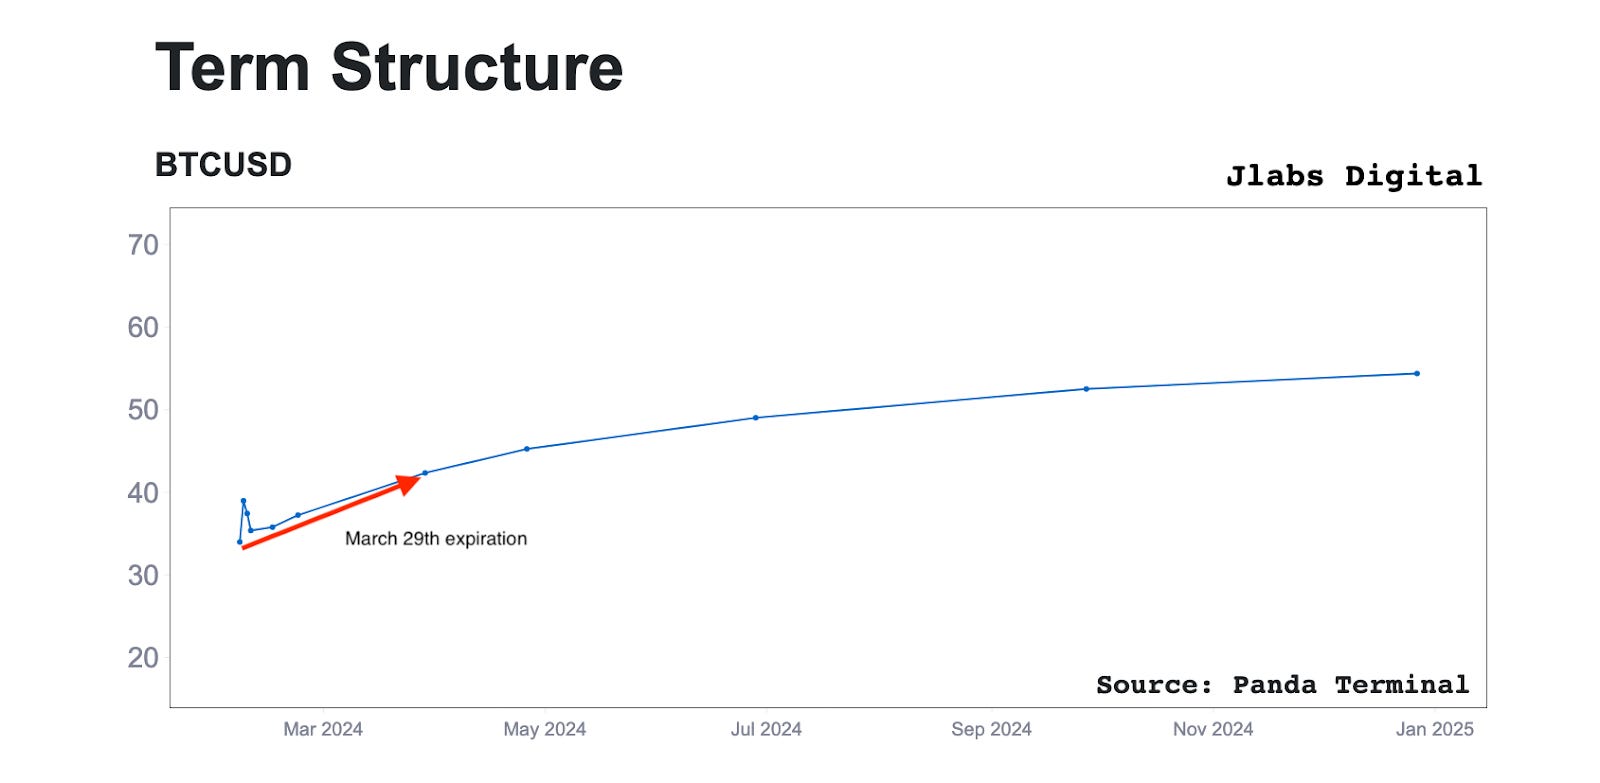
And as we look out further towards the end of 2024, the IV term structure climbs to almost 55 by December.
This transition from a negative sloping curve in January to the positive sloping curve we see today reflects that the options market is now better prepared for future volatility into the end of Q1 and later this year, than it was at the end of 2023.
This represents an opportunity in the market to profit from near term volatility. It’s the opposite of the setup right after the ETF launched.
Which means we have a potential signal that our current period of low, compressed volatility levels may be nearing its end and a spike in BVIV may come as soon as March, which implies that price could soon expand beyond its current range of $39,000-$45,000.
Whether this manifests as a squeeze towards new year-to-date highs above $50,000 or a drop towards the $37,000 region remains to be seen, but I expect we’ll see some directional clues start to show up over the next few weeks.
Watching the tape,
JJ
P.S. - Here’s some content from the team this week as seen on xChanging Good.
Newest Options Educational Video:
February 6 Market Discussion:
February 8 Market Discussion:


