The Missing Bucket
Market Update: Accumulation stats are rising, but here's what we really need.


Keep Calm and Carry On…
Welcome to British government propaganda.
British officials plastered this slogan on posters across the country to boost morale amongst its people on the eve of World War II.
It fit well with the Brit ethos: stoic and unflappable.
But more importantly, it helped keep citizens from panicking. And gave that subtle encouragement to carry on life as usual in the face of inescapable adversity.
And as the dust settles from the absolute carnage of the last couple months, it seems the cryptocurrency market could use a similar slogan. Perhaps we call it: Finding Vibe.
That’s because we haven’t quite found our familiar price rhythm. The one that beats to liquidity hunts and sweeps. These dramatic sequences are the vibe.
And the quietness that has engulfed markets of late are hinting at a return. For those that read the July 9 Espresso issue, you know what I’m talking about. But until we see the bigger pockets of liquidity swept to the upside we will feel off cadence.
So for now we keep calm. And as we carry on, let’s focus on what we can… What hints can we decipher from the current market structure so that when price does begin to return to a normal sequence, we will be ready.
The Subtle Shift in Structure
The bottom of market cycles can take considerable time to form. The longer they form, the stronger their rallies can be once price emerges from its depressed state.
This line of thinking is one way in which many in crypto cope. Luckily, there is some truth to it. Just look back to April 1st in 2018 or after the long drawn out bottom before the 2017 rally.
These sequences can create unstoppable power in the market. And right now, we may be carving out a bottom that is of the variety that propels us to new highs.
But that’s getting way ahead of ourselves. After all, price is down about 70% from its high and finds itself range bound between $19k and $21k.
So instead of calling $100k price targets, let’s focus on where we sit now. What is the current structure. And how might opportunity present itself?
To hone in on that, let’s view the current situation as needing two strong influences. The first is an ideal setup in terms of the market gaining confidence in structure. The items that fall into this bucket are the liquidity sweeps we mentioned last update, the flow of tokens in and out of exchanges, and overall holding behavior. You can think of this as the market stopping a leak.
It’s how sellers begin to lose strength and allow buyers to become the main influencers again. It takes time of course, which is why we stay calm and not get overly excited on smaller moves.
Now, one way in which we can see this subtle shift from sellers to buyers is via exchange netflows.
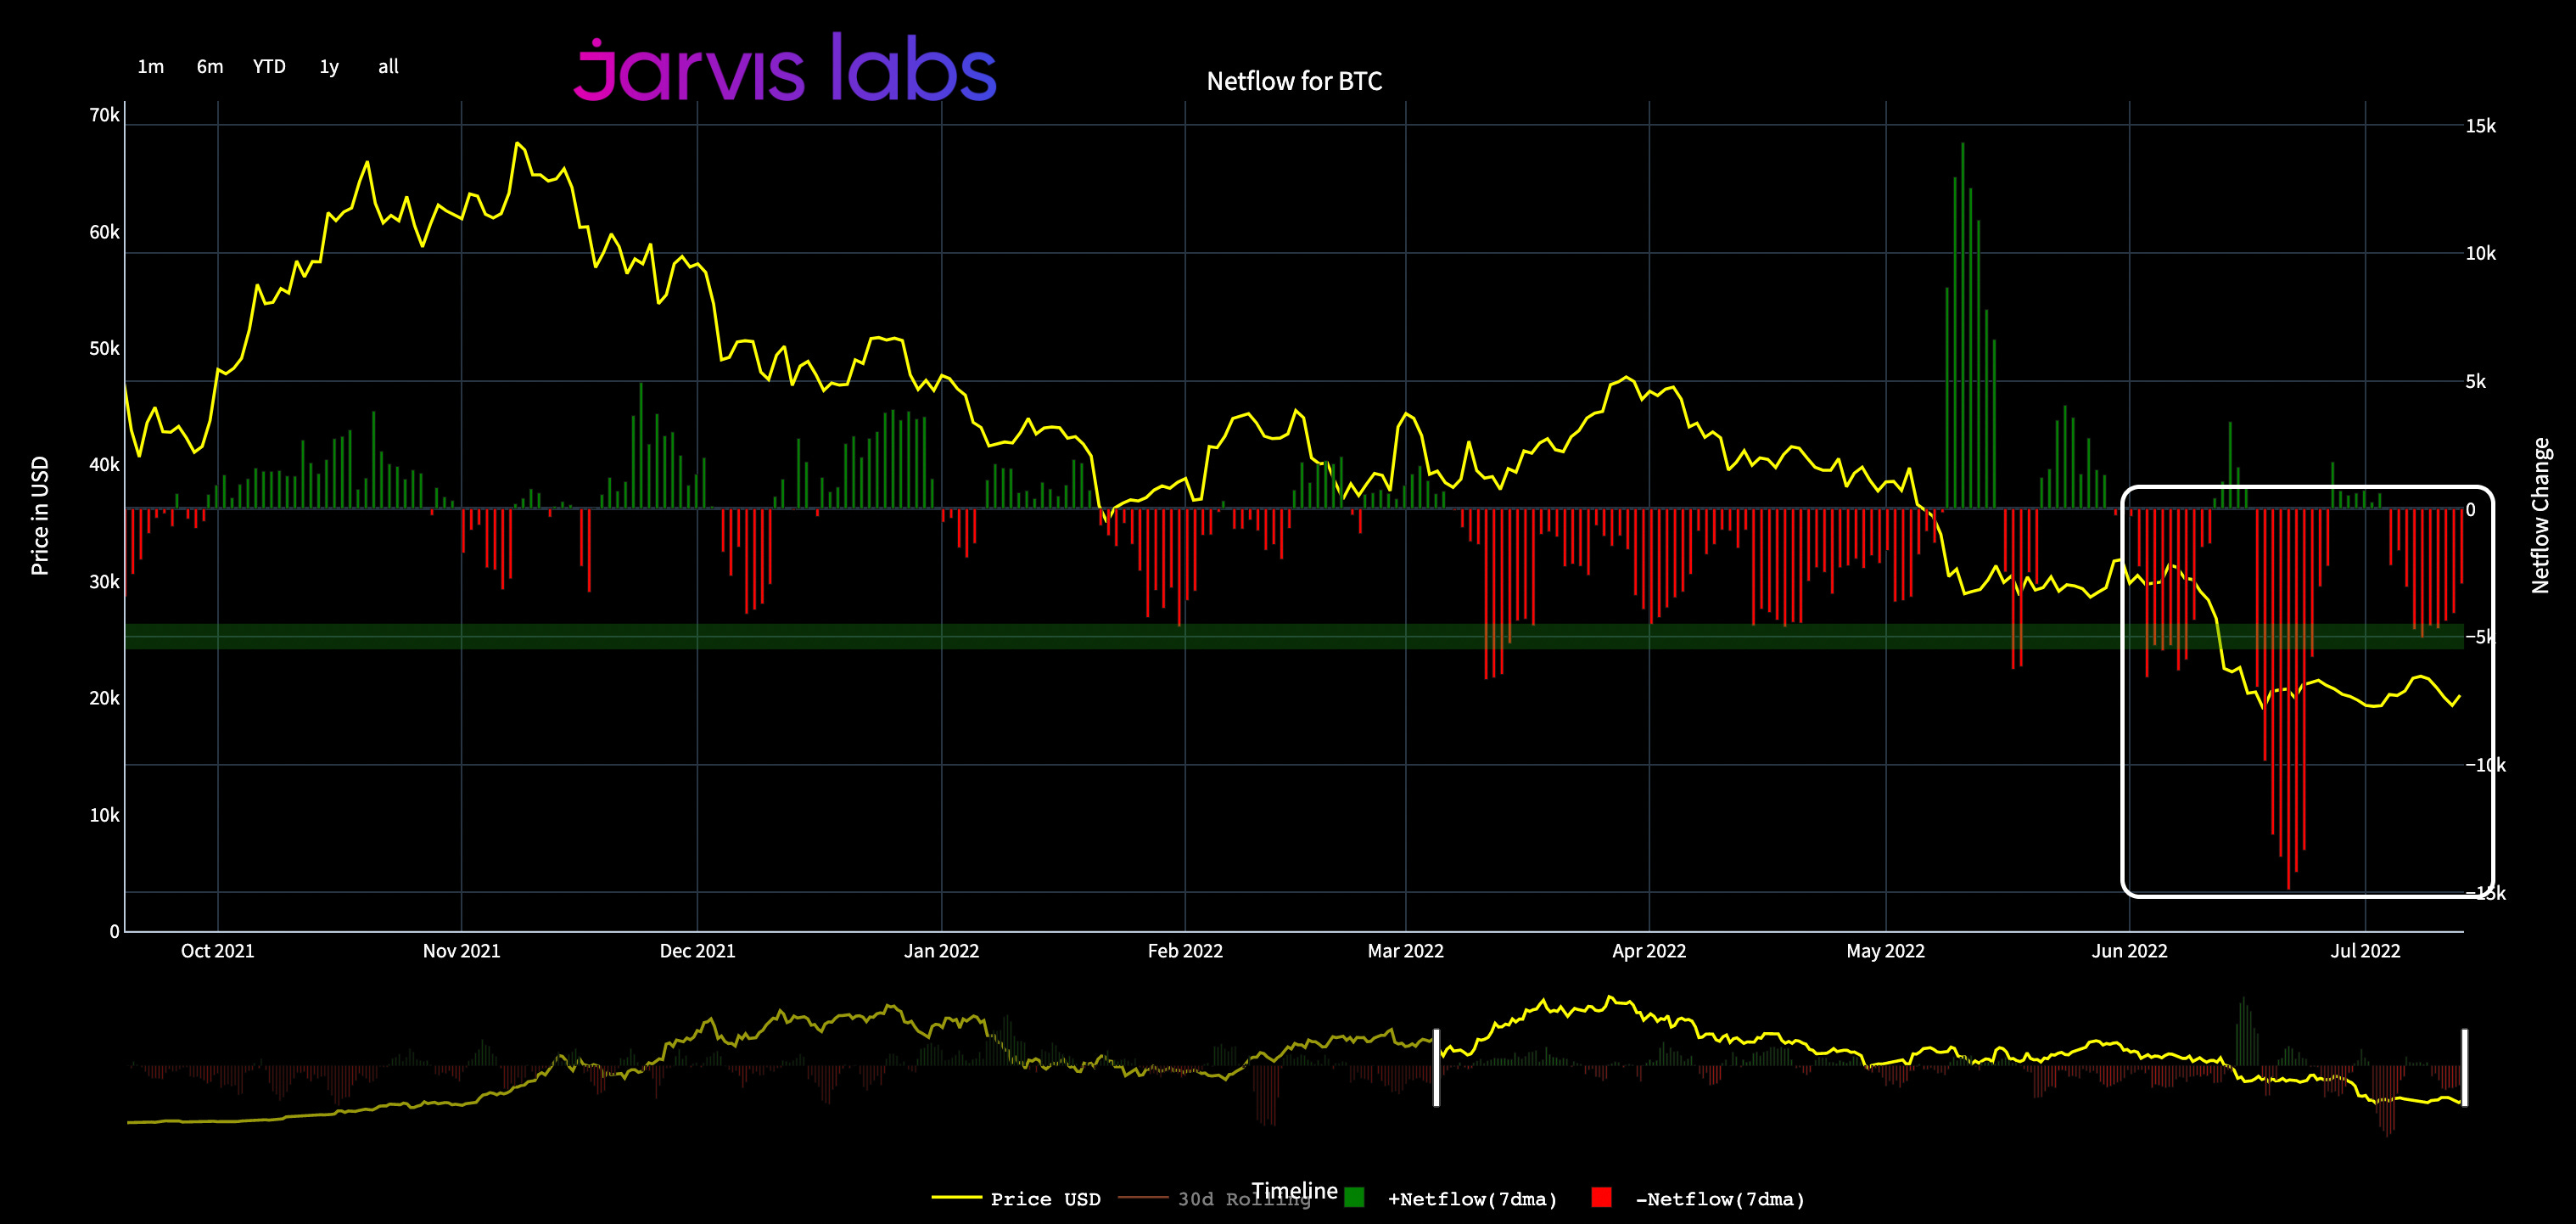
Exchange netflows measure the difference between the BTC sent to exchanges versus BTC leaving exchanges. When more BTC or crypto enter the exchange, it’s a positive netflow. When more BTC leave the exchanges, it’s a negative netflow… Meaning for price to go up, we want to see a negative netflow as this assumes there are less bitcoin sitting on exchanges to sell.
As you can see in the chart below, this measure oscillates from negative to positive. What we want to focus on are when things begin to look one sided. The red bars in the white box below show negative netflows being one sided as of late.
The larger green bars just before the white box were the forced selling events from May and June.
This implies the general trend is showing sellers are running out of ammo.
But this is just one feather in the cap.
Another feather that tells a similar story is one that focuses on larger ETH holder wallets. This stat depicts exhaustion from sellers, as well as the recent forced selling event having stabilized.
Specifically, the sell off from the Luna Terra and Three Arrow Capital (3AC) saga has once again slowed. ETH holdings by the largest wallets are staying constant as seen in the red box below.
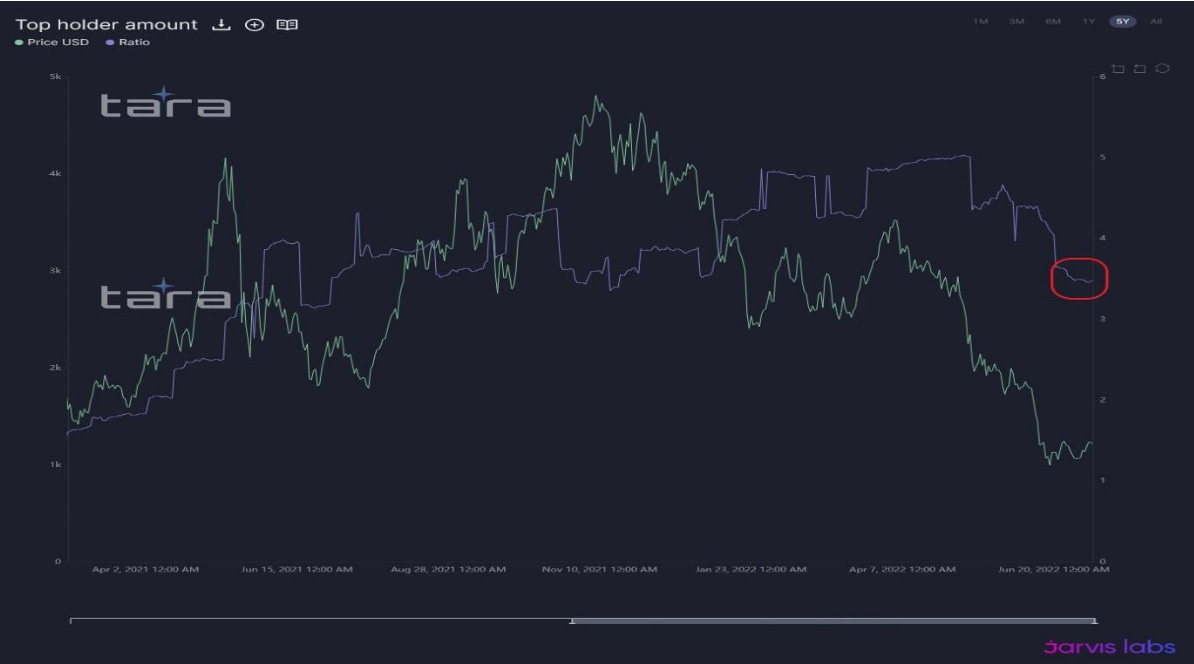
These two charts highlight the fact selling is slowing and the market may have found some solid ground.
In reality, we likely already know this. That’s because headline news stories are slowing. Less drama seems to be unfolding through Twitter. And overall, traders are getting rest again.
Now, this feeling of solid ground might not be permanent. Meaning new lows could take place in the weeks to come. But one thing to take note is that the pummeling the market took was so bad that many metrics are hitting very significant lows. And these lows suggest that current prices are at a discount.
One example of this is the market-value-to realized value (MVRV) measure. It is used to help determine market tops and bottom. It does this by measuring the difference between the asset’s market cap and the realized cap.
To explain this differently… let’s assume the total number of BTC in existence is 100.
Assuming the price today is at $20,000 per BTC, then the market cap equals $2 million. If we then assume that all buyers purchased their BTC at an average price of $5,000, then the realized cap would be $500,000.
Taking it a step further, if we take $2m and divide it by $500k, we get a MVRV of 4. This implies that there is quite a large profit margin for the BTC holders. This would signal much of the market is in profit and price is likely at a high.
On the flip side, if the MVRV ratio is 0.5, then most of the BTC holders are out of profit and it may signal a market bottom.
Today’s MVRV reading is below 0.9. To put that into context, the high in 2021 was 4. And the last time MVRV was below a reading of 1.0 was March 2020. Before that it was early 2019. Meaning this reading is historically low.
But despite how depressed this onchain metric is, what we want to see is accumulation. Without accumulation, then any sold supply hits the market without buyers.
The chart below gives us a breakdown on any accumulation trends taking place. In the latest range there was some decent accumulation taking place. This metric is viewed using seven days of data (not moving average as others do - less signal that way).
In the white box below we see there was some decent accumulation that took place…
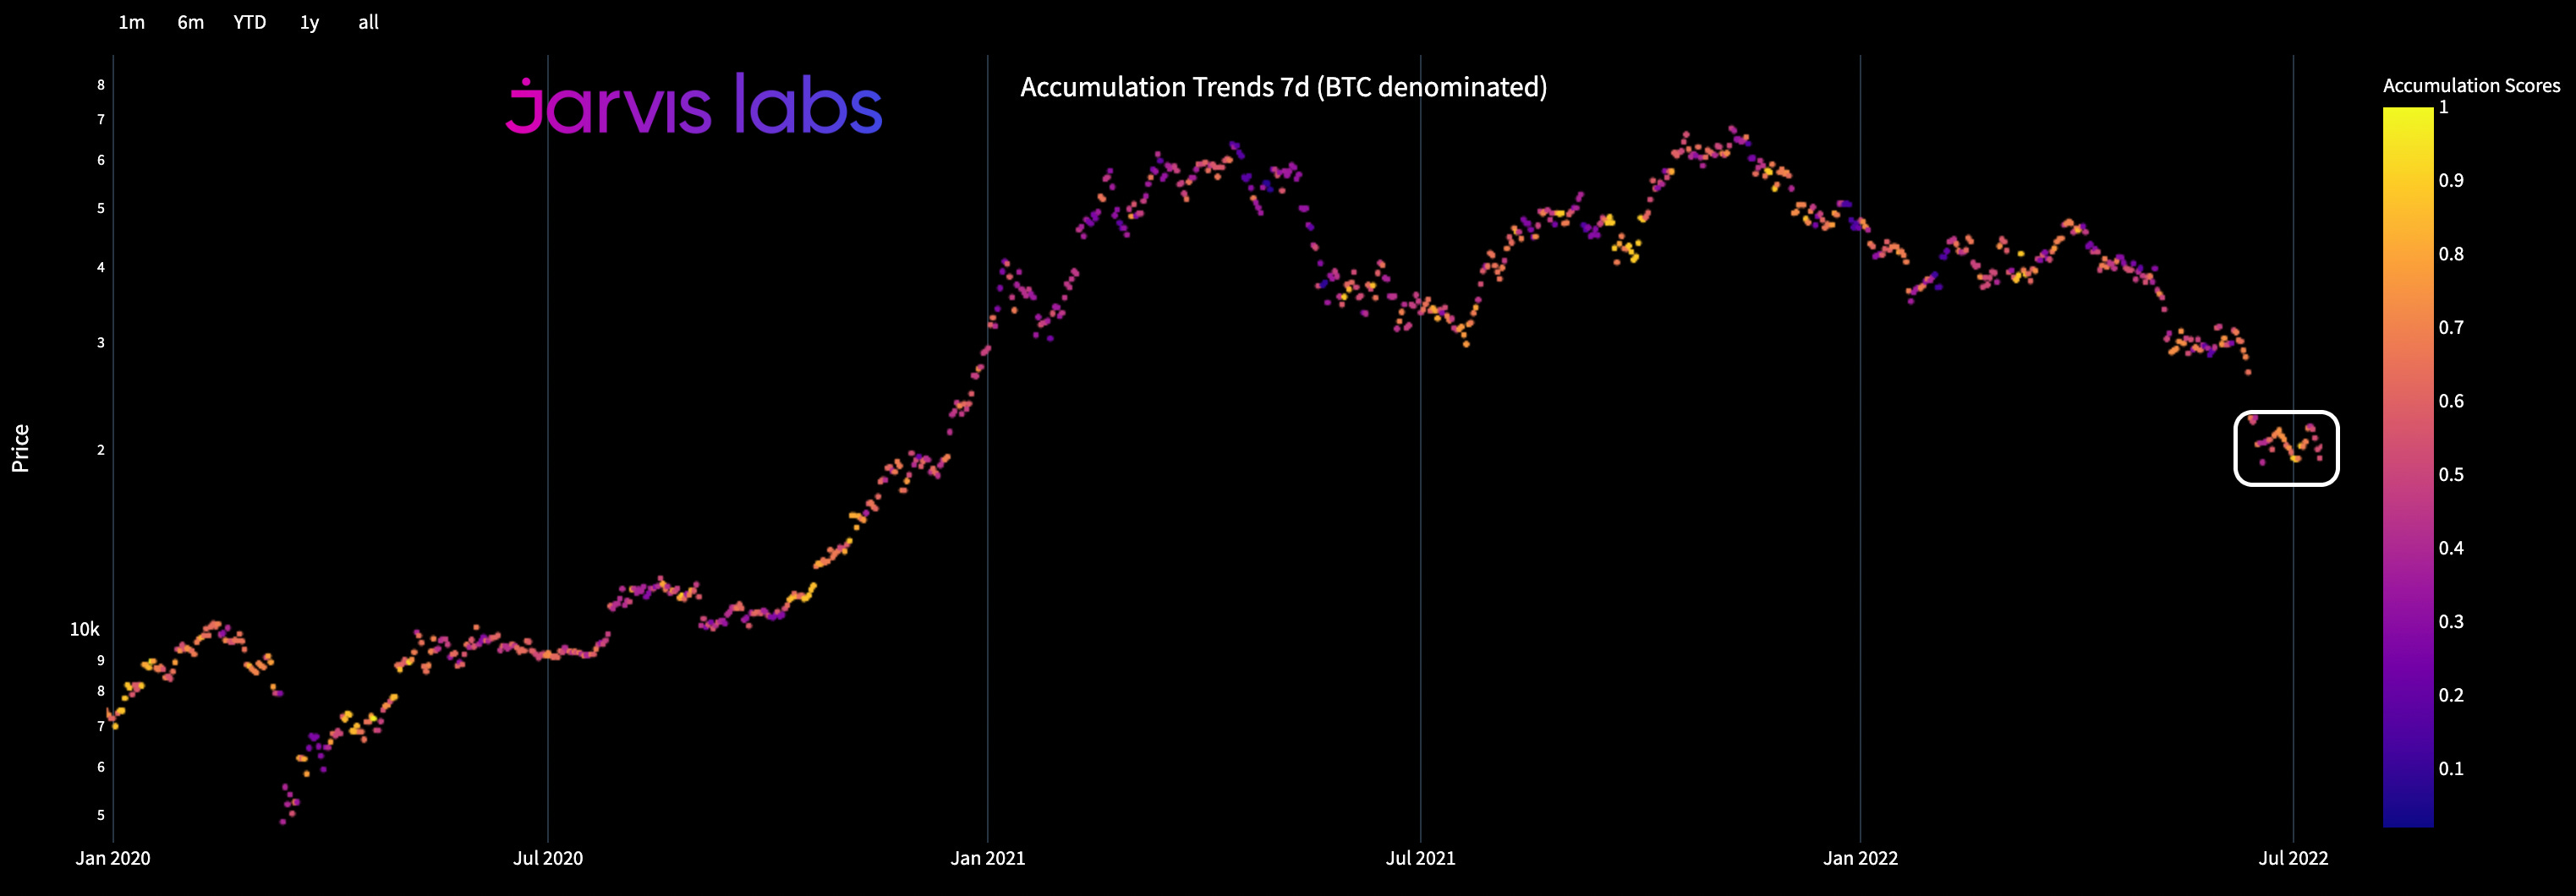
And this would suggest we may have arrived at a bottom.
But let’s be honest, it’s never that easy.
The Needed Catalyst
There are still some negative factors at play in the market. And to say it differently… The market lacks a spark.
These long drawn out bottoms that form after a major event like this can take time. And as the market structure slowly shifts, we find that the shift is only one bucket of the two we need.
The second bucket is the momentum. And to move large markets requires large players that can create the catalyst for price to move higher.
Which brings us to the the unfortunate part…
We find there is suppressed demand from big whales. The on-chain distribution chart below is showing that mega whales (wallets with 10K BTC or more) along with baby whales (wallets with 100-1k BTC) are starting to accumulate this week. But the most important whale demographic (wallets with 1k-10k BTC) are still distributing.
In fact, the 30-Day Change metric in the red box is still overwhelmingly leaning towards selling.
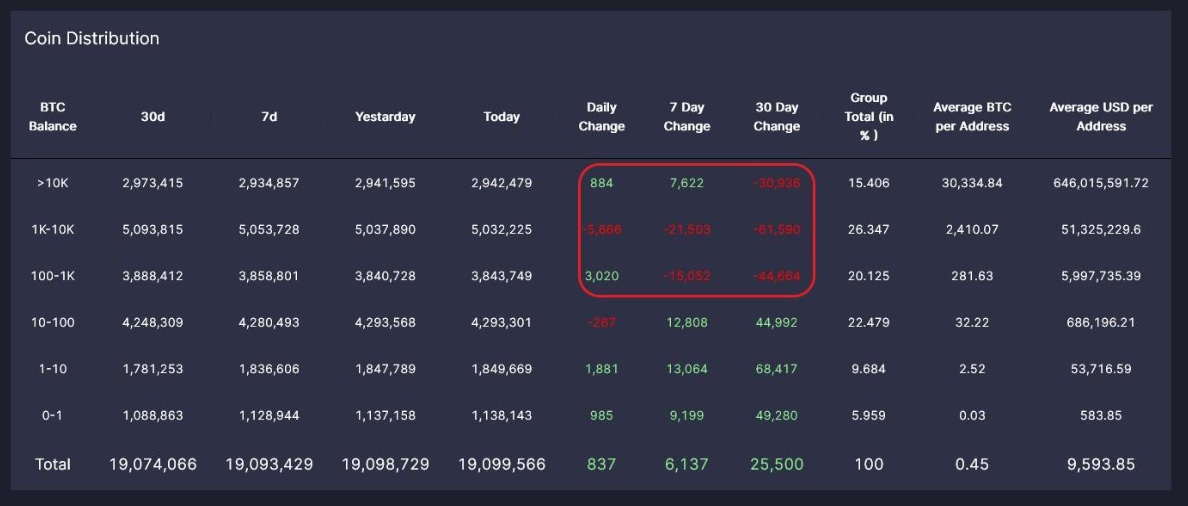
At first glance this might seem like it runs counter to our accumulation chart from earlier.
But the fact is, when we look at the change in whale holdings over a longer period of time, we see this fact is actually worse than we expected.
The chart below shows us the change in holdings by whales. The higher the colored dots go, the more positive accumulation taking place. The lower it goes, the more selling… The color change reflects the price. We want these dots to trend up.
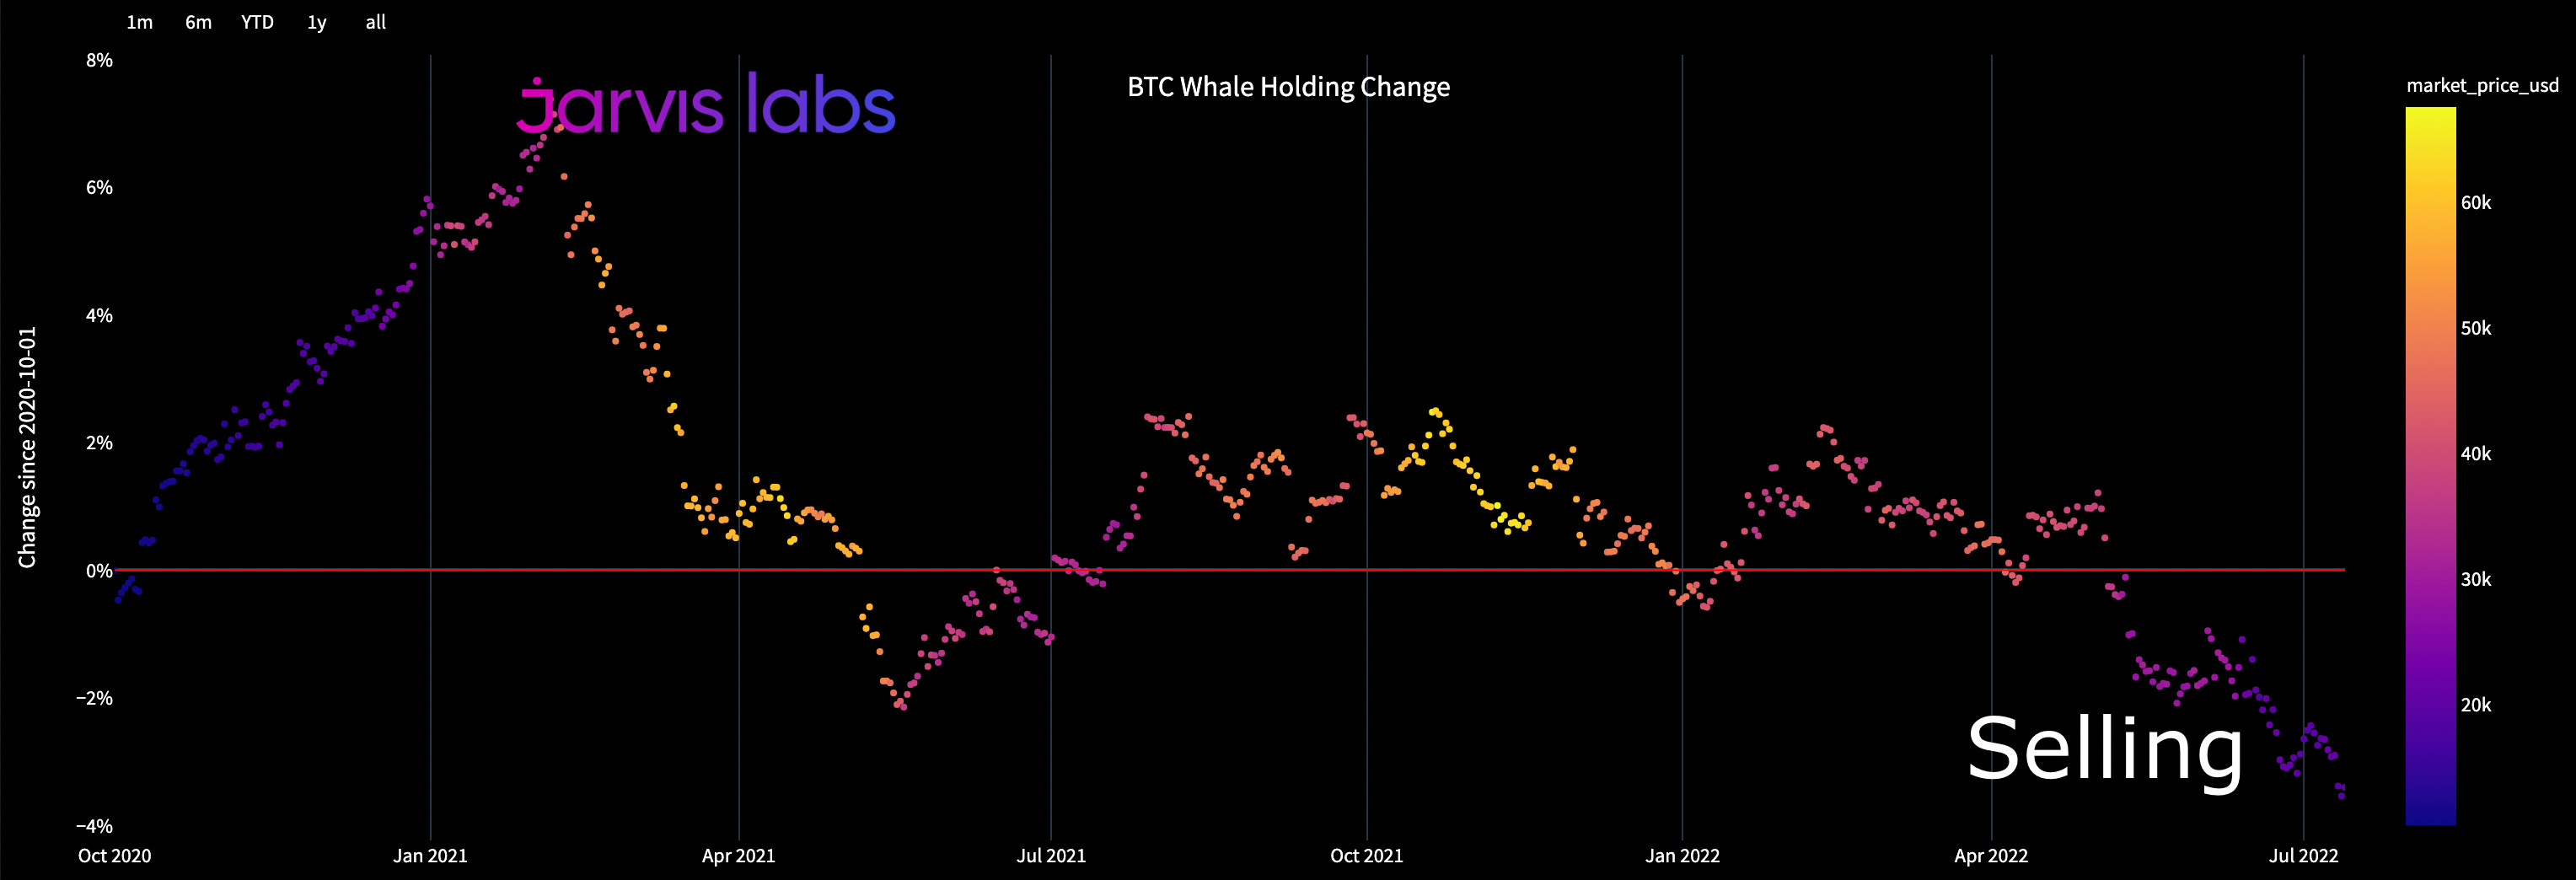
This hints at the fact that whales likely stepped in to slow down the tumbling price. But that’s it. It’s not indicative of a more sustained buying pressure.
Not what we really want to see.
And until these metrics suggest a change, then a potential catalyst sits elsewhere.
My guess…
Until the macro economic headwinds slow down, we won’t see stats like accumulation or whale holdings change in any significant and bullish manner. Which means we simply focus on how the market shifts in the next week or so, and whether we get those liquidity sweeps to the upside. If so, maybe we vibe again.
Until next week…
Your Pulse on Crypto,
Ben Lilly
P.S. - Just a couple of days left until we close the door on lifetime memberships. It has been over a year since we closed down lifetime offerings, so take advantage while you still can. Take care.


