The Market is Changing
Market Update

$1.19 million dollars on every First of July.
This is how much a man named Bobby Bonilla receives once per year… Until 2035.
He’s been at it since 2011.
The U.S. Major League Baseball All-Star was wise in how he hashed out a deal at the twilight of his playing days. Him and his agent worked out a deferred salary plan with the New York Mets. Instead of the Mets buying out Bonilla’s salary immediately, the Mets agreed to pay Bonilla’s $5.9 million dollars left on his contract from 2011 to 2035.
Split up over the course of 24 years, this doesn’t quite add up to $1.19 million. That’s because his pay factored in an annual 8% interest adjustment per year from 2000 to 2011.
Bonilla’s last at-bat for the Mets was in 1999. After 11 years, thanks to the power of compounding, that $5.9 million ballooned to $29.8 million. Divide that amount by 25 years… $1.19 million per year.
This payout now takes place each July 1st, and has earned the name Bobby Bonilla Day.
But one might wonder: Why did Mets’ owner agree to such one-sided deal…
Enter stage right, a Ponzi scheme.
Fred Wilpon, then owner of the Mets was receiving 12-14% interest payment annually from his $700 million nest egg. The egg was being held by Bernie Madoff, King Ponzi himself. This is why Wilpon felt an 8% interest adjustment still offered him a spread to still make money on.
That is until the Great Financial Crisis of 2008.
We all know how Madoff’s Ponzi scheme went down. Wilpon and hundreds of other Madoff’s investors got annihilated as the fraud incinerated.
Seems that 12-14% interest payments were no longer sustainable… Sound familiar yet?
The current macro conditions caused a ripple effect that triggered massive sell-offs with risk-on assets. This exposed Ponzi-like schemes within the cryptocurrency industry with meltdowns like Terra Luna.
The lucrative return of 20% annually promised by Anchor, Luna Terra’s DeFi protocol, never became sustainable. The idea that Luna’s transaction activity would rise and help sustain this yield never took place.
If anything, incentivizing users to lock-up tokens made this logic even harder to realize.
Since the contagion, we’ve seen many entities go belly up and declare insolvency. This chain effect has led to forced selling across the board.
And what we will hit on today is how this forced selling is showing the first signs of letting up. And what this means as we go into the weekend.
So grab some peanuts, a hotdog, and a drink as we explore these two topics further.
A Change in Sweeps
Forced selling started to unfold about two months ago. Since then, the market has literally gone one direction.
To the Earth’s core.
What our team finds most interesting in this price action is that BTC and ETH never had success in sweeping liquidity to the upside. To better explain what I mean, let me show you what we’re talking about…
Here is a liquidity map from late-May. This map filters for trade orders we label as having significance, and plots where those liquidation price points likely reside. (side note: Liquidity maps are not available for sale. We use them internally for algorithms that get fed into the AI, meaning it’s just one factor among many that go into the system’s decision.)
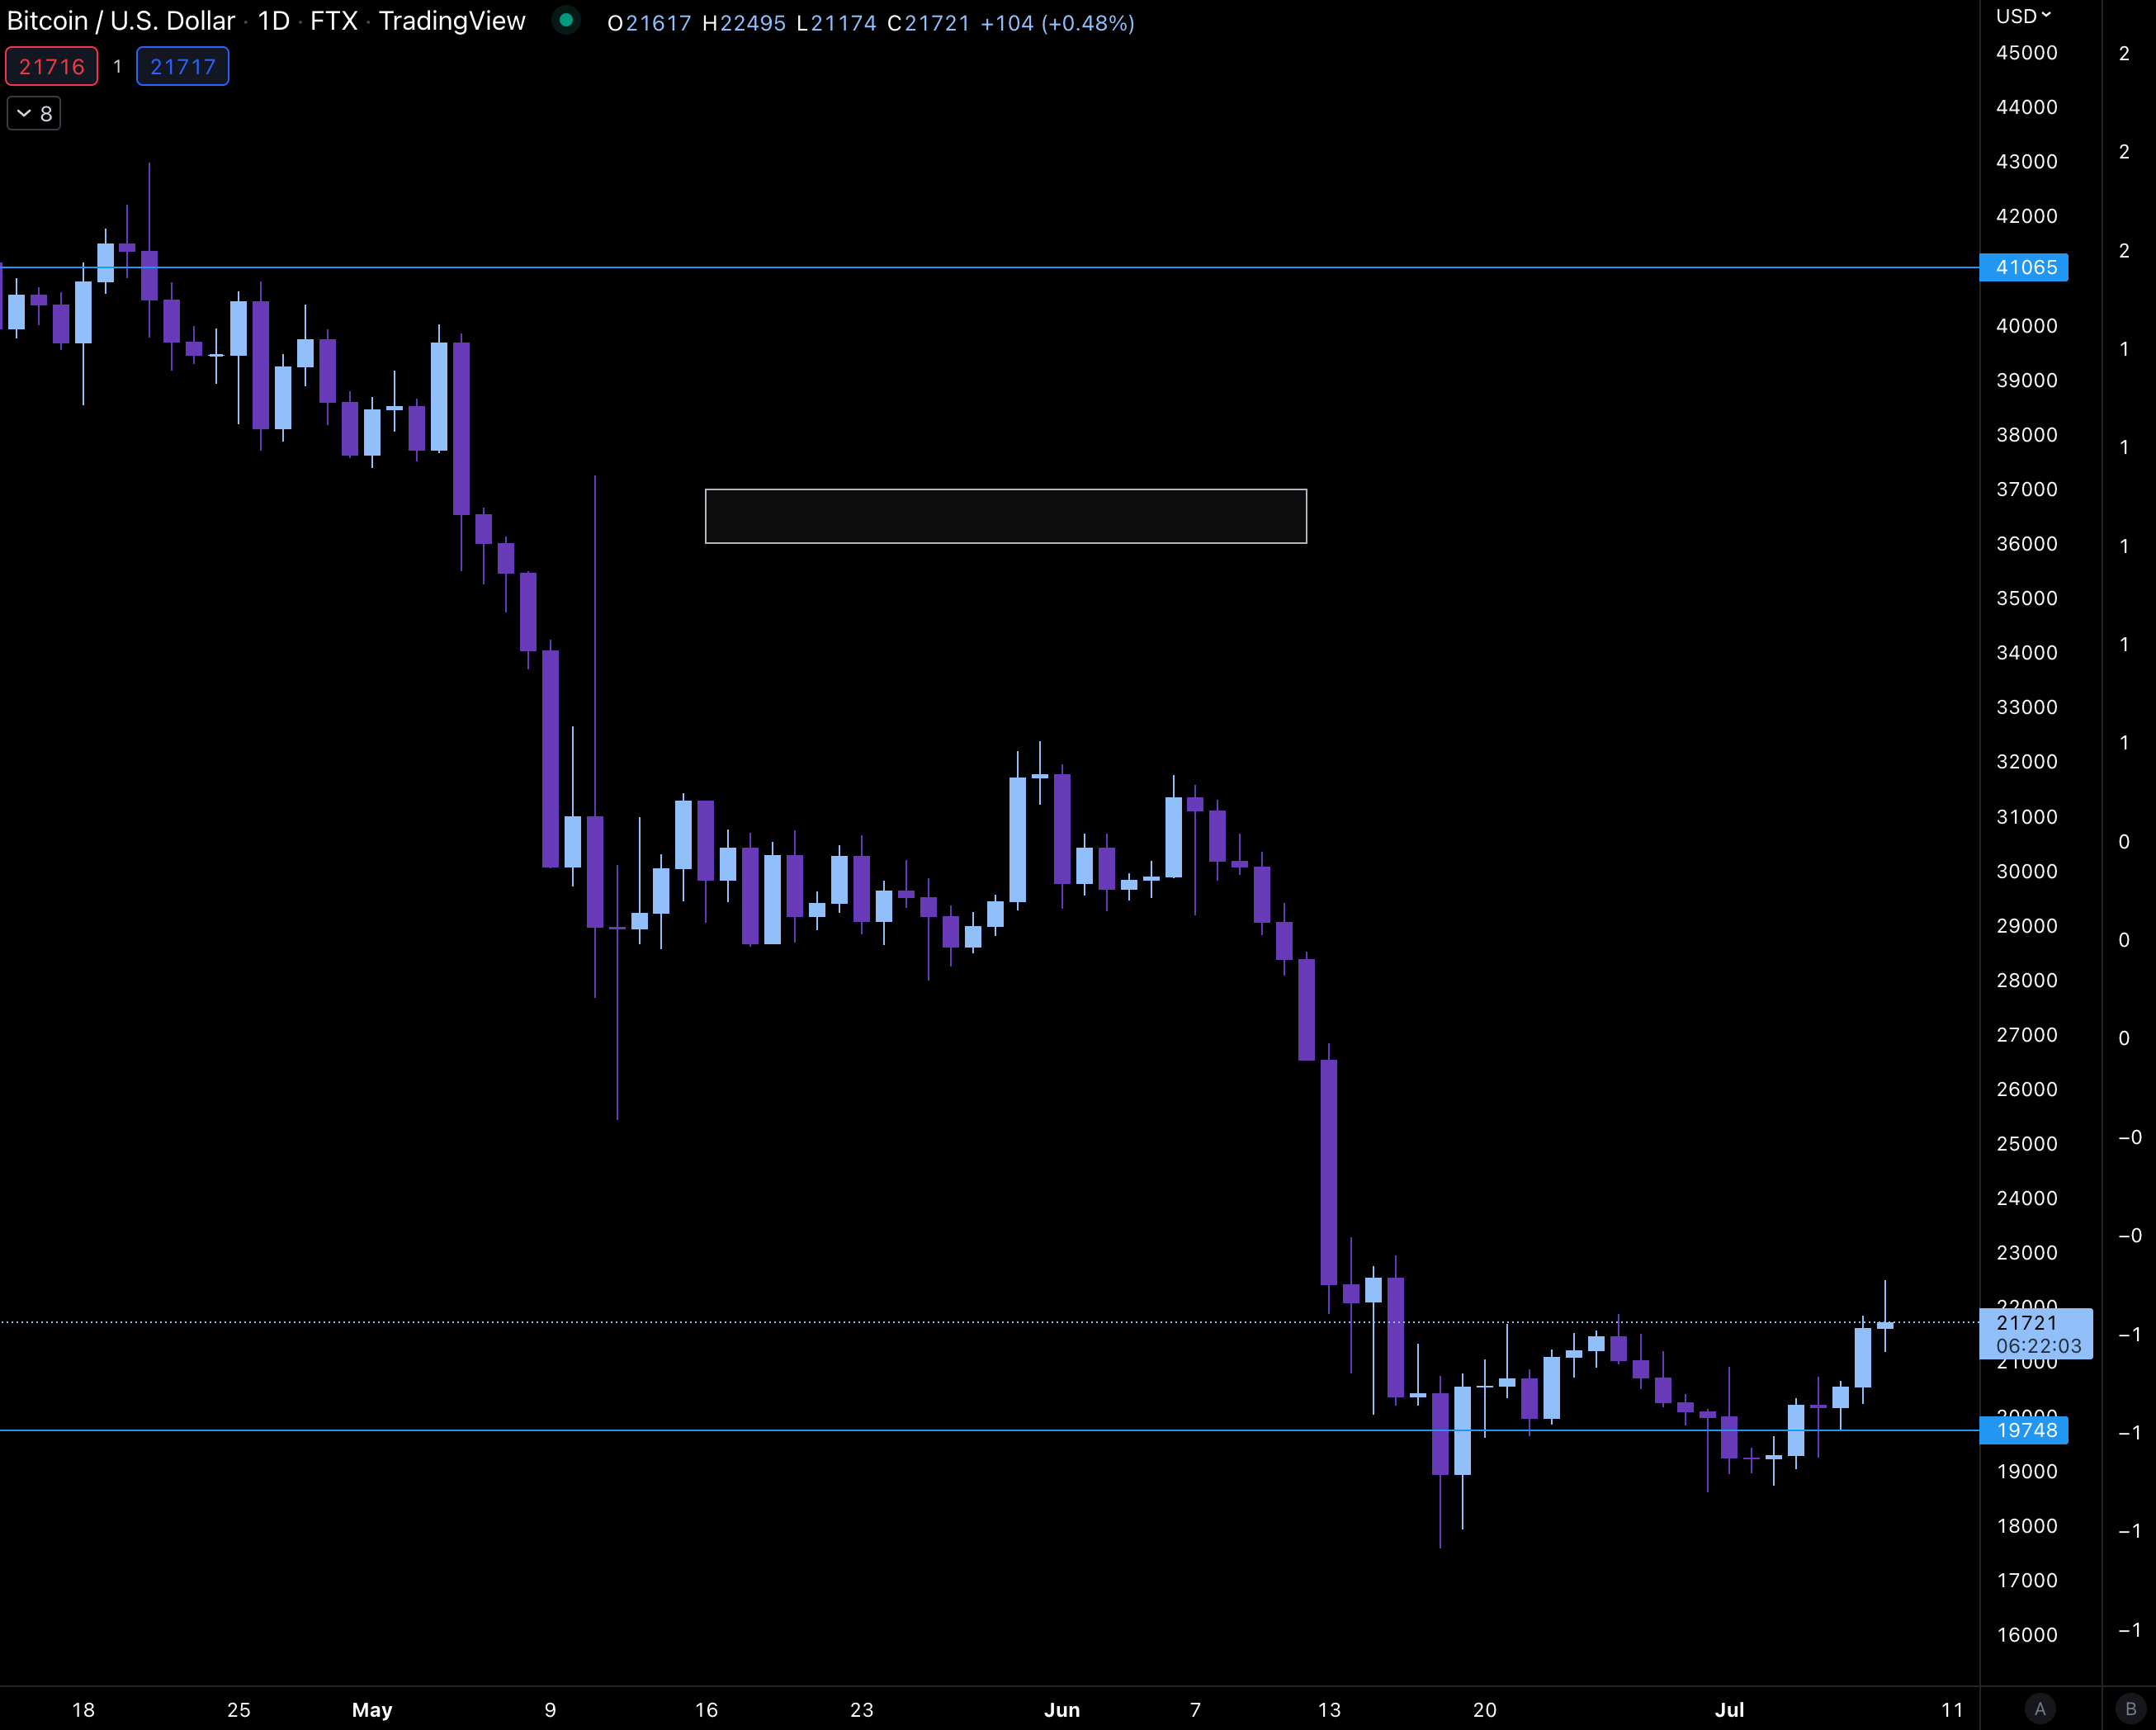
As you can see, there was considerable liquidity forming around $36k level as price broke down in mid-May.

Price never came close to taking that out. The white box in the chart below shows where the liquidity area sat, and how price never threatened it.
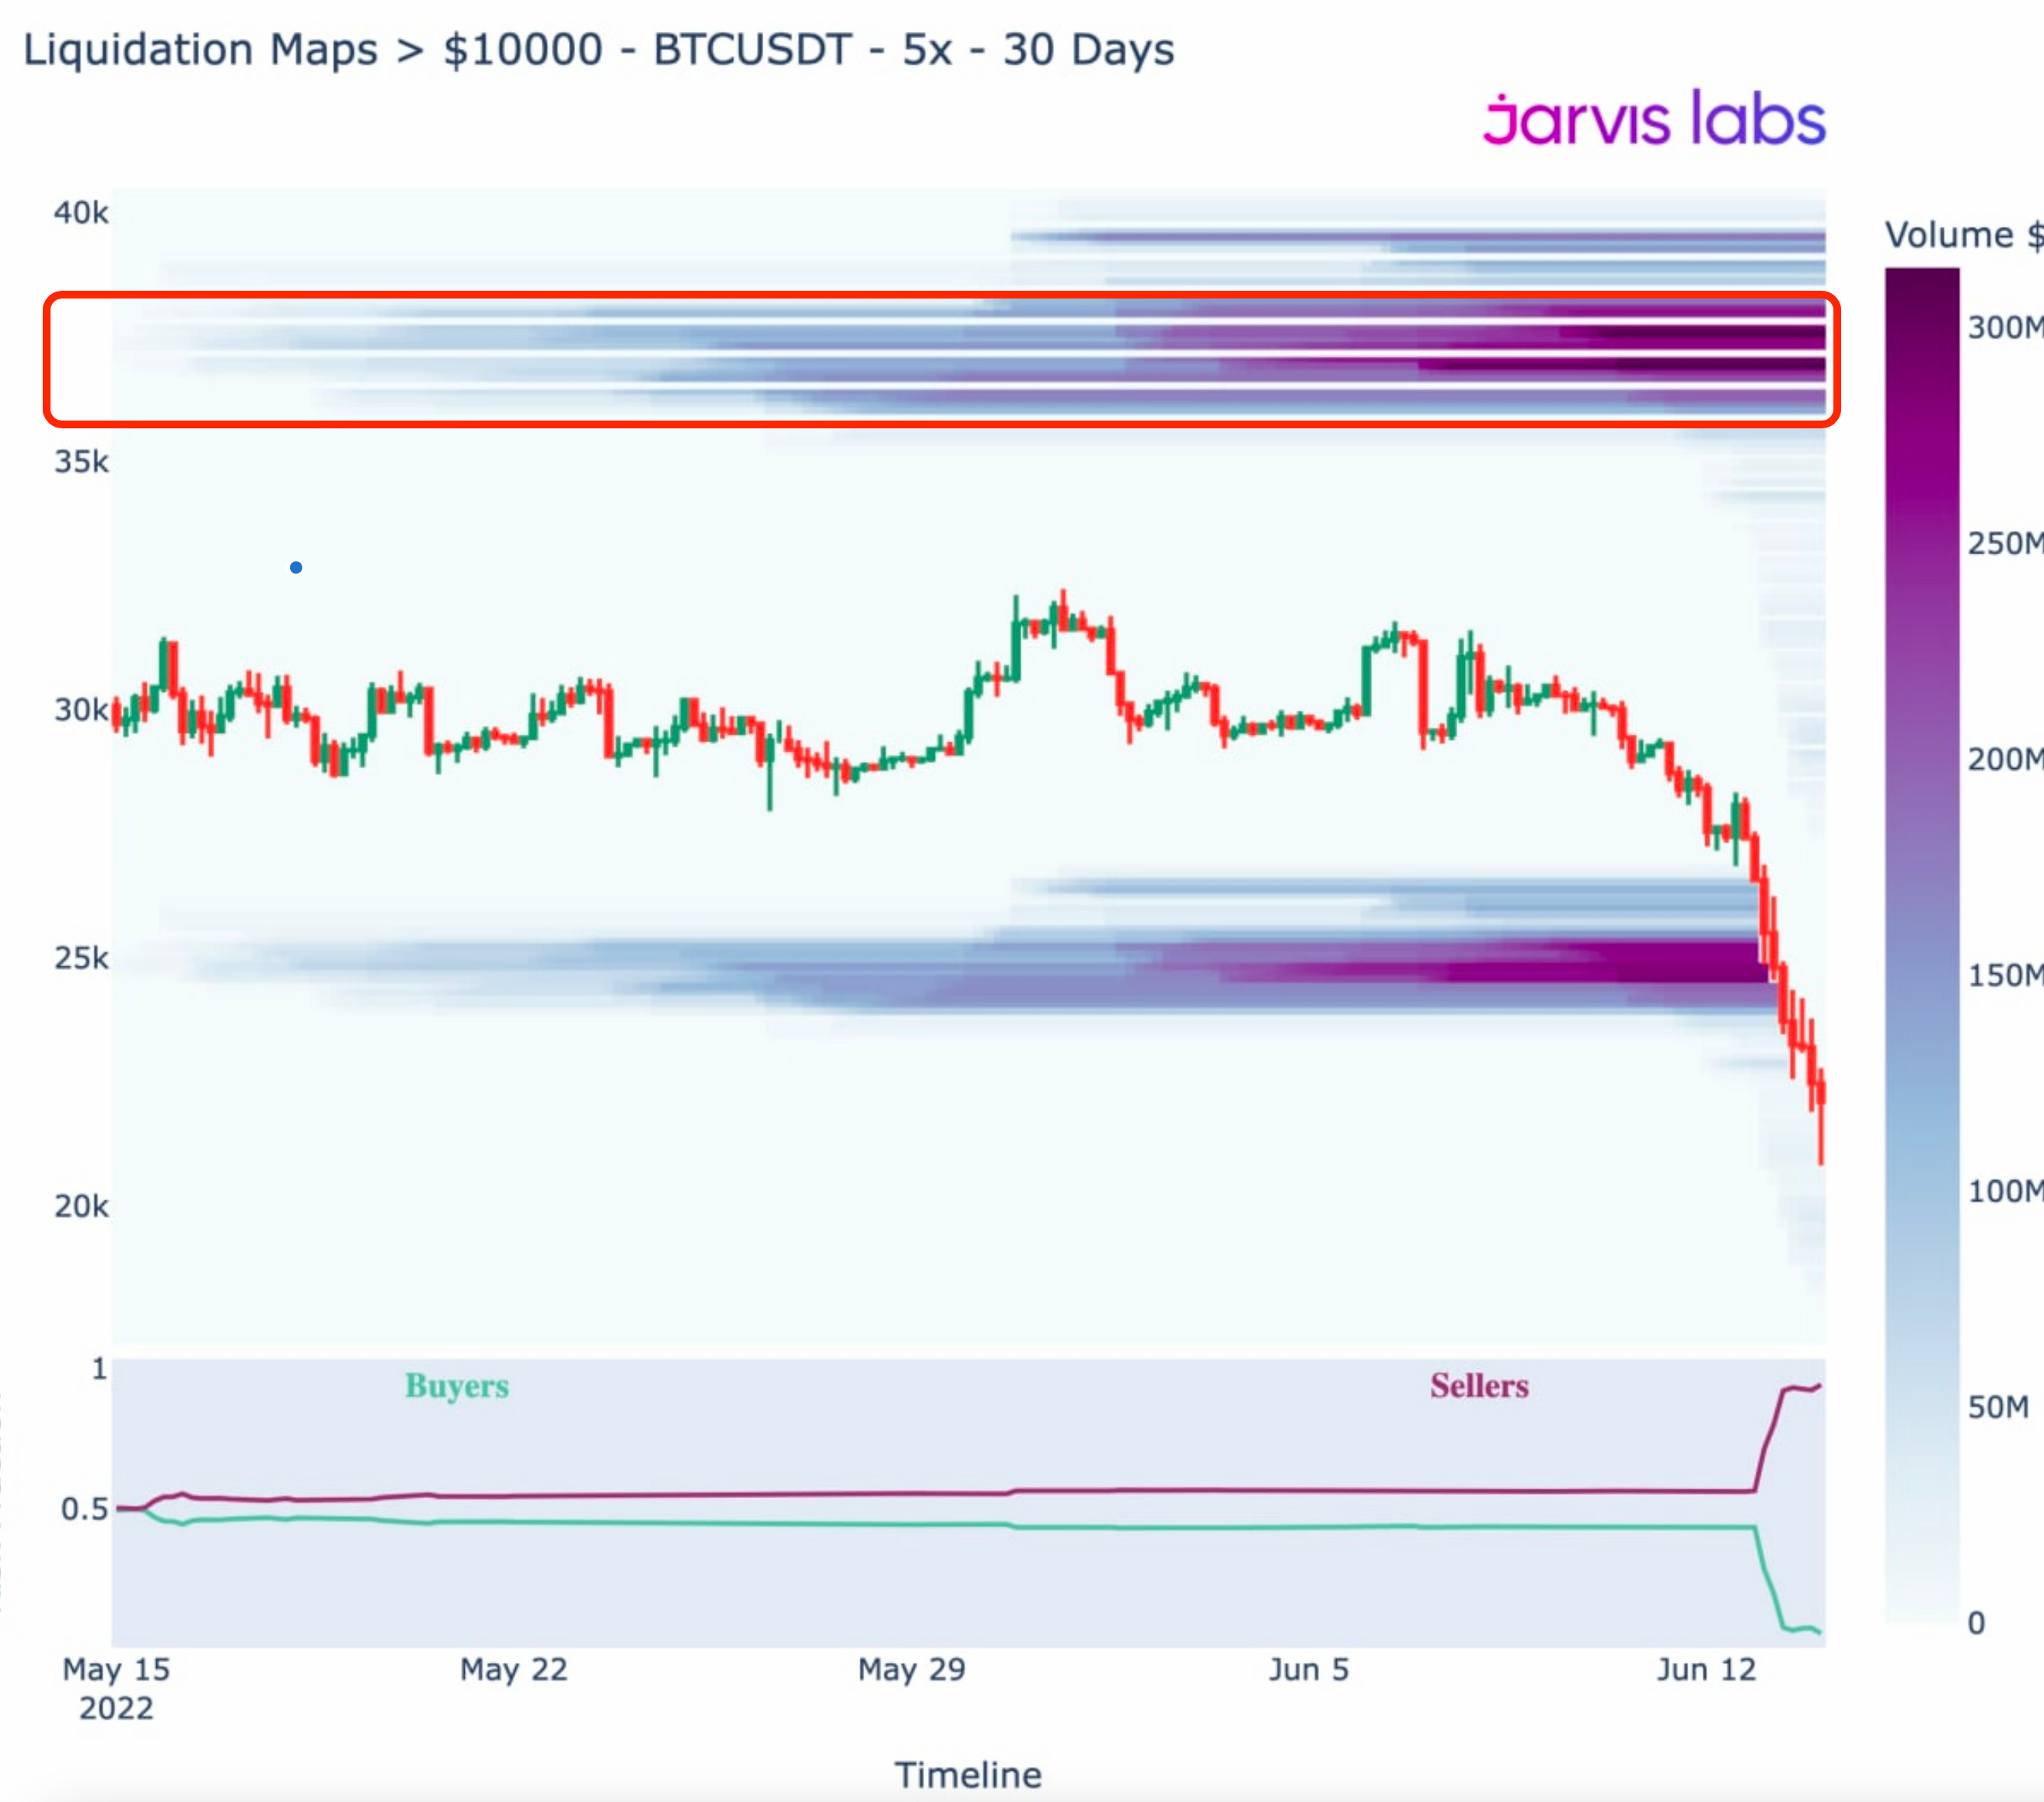
In mid-June we witnessed another significant leg down as Celsius became headline news. We saw something similar unfold during this stretch as well.
Just before the June selloff, the liquidity pools that sat around that same level as before only got larger. Meaning a major market maker or somebody needing to reduce their exposure would want to maximize their returns and sell execution by selling into this area. That would be normal market behavior
But as you can see below, price never came close… More forced selling.
In fact, here is that same chart, but a bit more zoomed and also honing in on higher leveraged positions… This helps us see just how forced the selling really was that took place. Price never flirted with the liquidity to the upside.
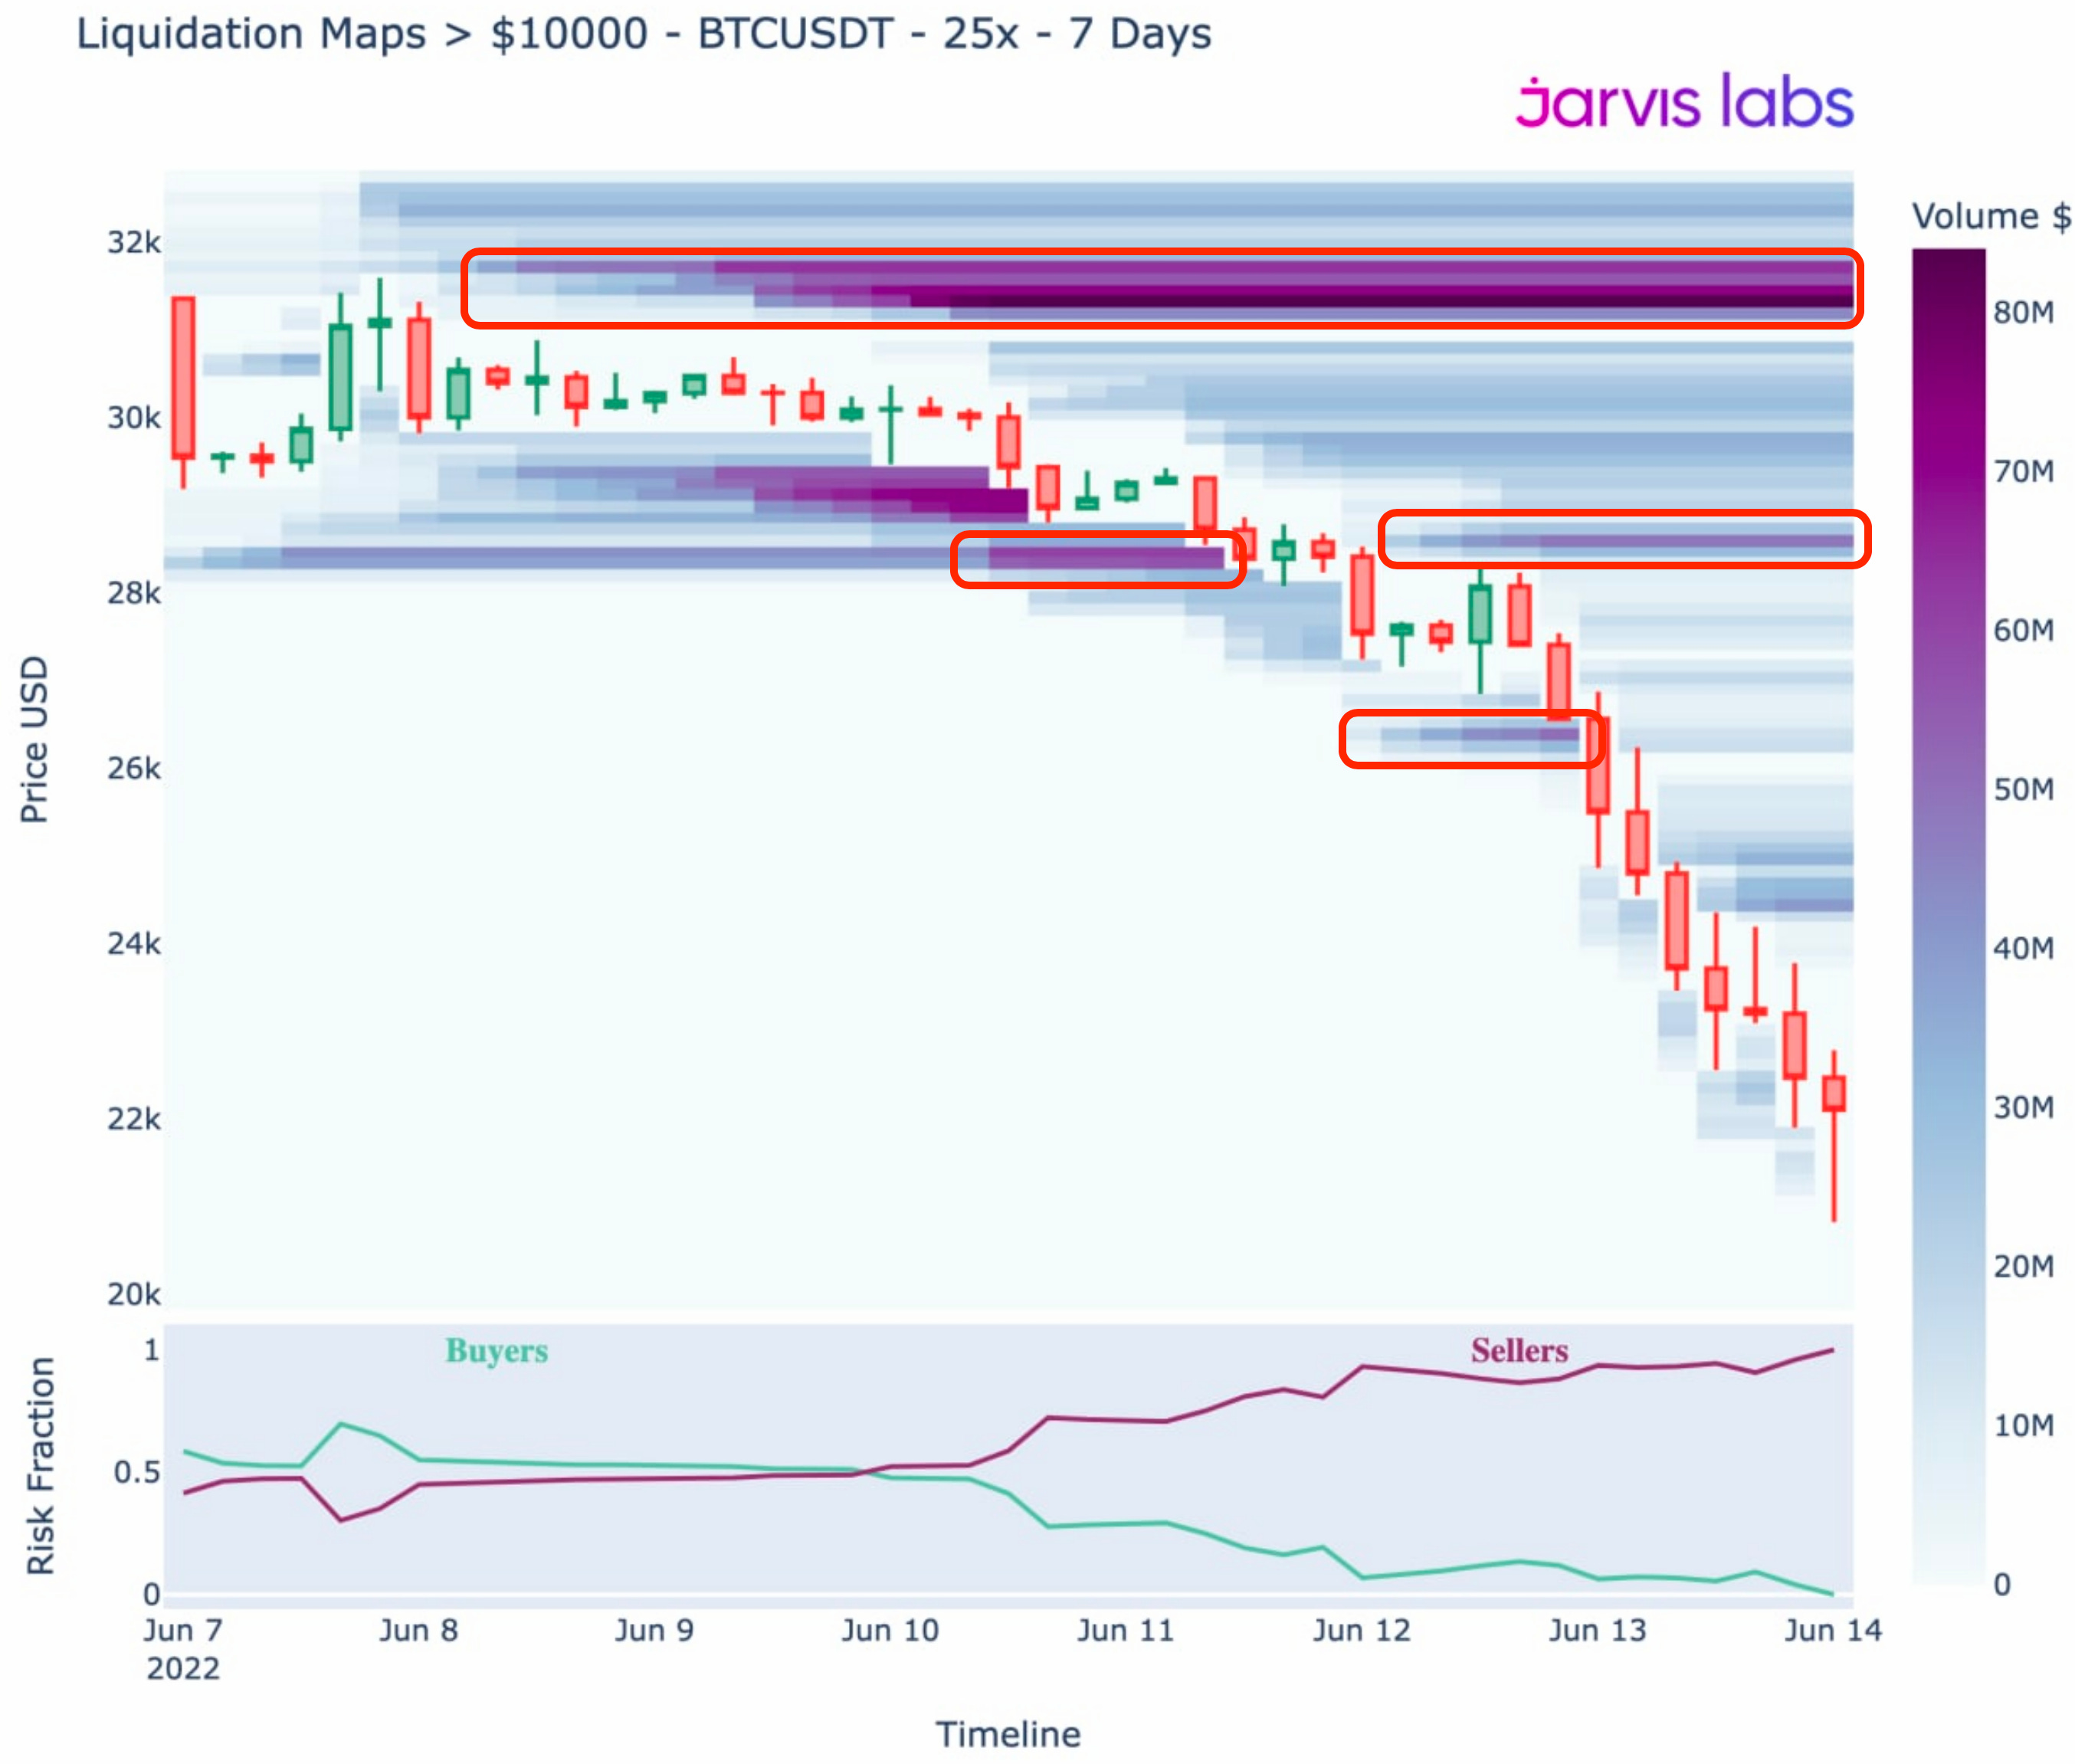
The ponzi-like schemes that were getting exposed due to macro economic headwinds created a selling environment that has really never existed.
In the second half of 2018, traders who were active then likely remember the liquidity sweeps that took place on a weekly basis. It was a non-stop liquidity hunt for months. Bart Simpson memes were born in this environment.
But now, it’s different. It is consistent unloading without trying to maximize on execution. If anything, it’s a race to the exit to see who can get out first.
Thankfully, headline news that creates forced selling is slowing down… So now the question on most trader’s minds are likely along the lines of, is it finally over?
Today’s Market
We are beginning to see early signs that this type of mad rush to the exit is changing. Using our zoomed out liquidity map, we can get a look at where the pools sit to the upside.
In the chart below, you can see there is significantly more purple bands that are also darker in cooler. This essentially means there’s much more liquidity in this region versus the downside. The “Risk Fraction” at the bottom of the chart showcases this one-sided state as well.

Now as we move into the weekend, the main question is whether or not bitcoin tries to touch this area around $25k.
To provide us with a hint of whether or not this sweep to the upside is likely, here is a more zoomed in picture on the more highly leveraged liquidity. This lets us see how price is behaving as of late.
As we can see, two significant pools were taken out to the upside.
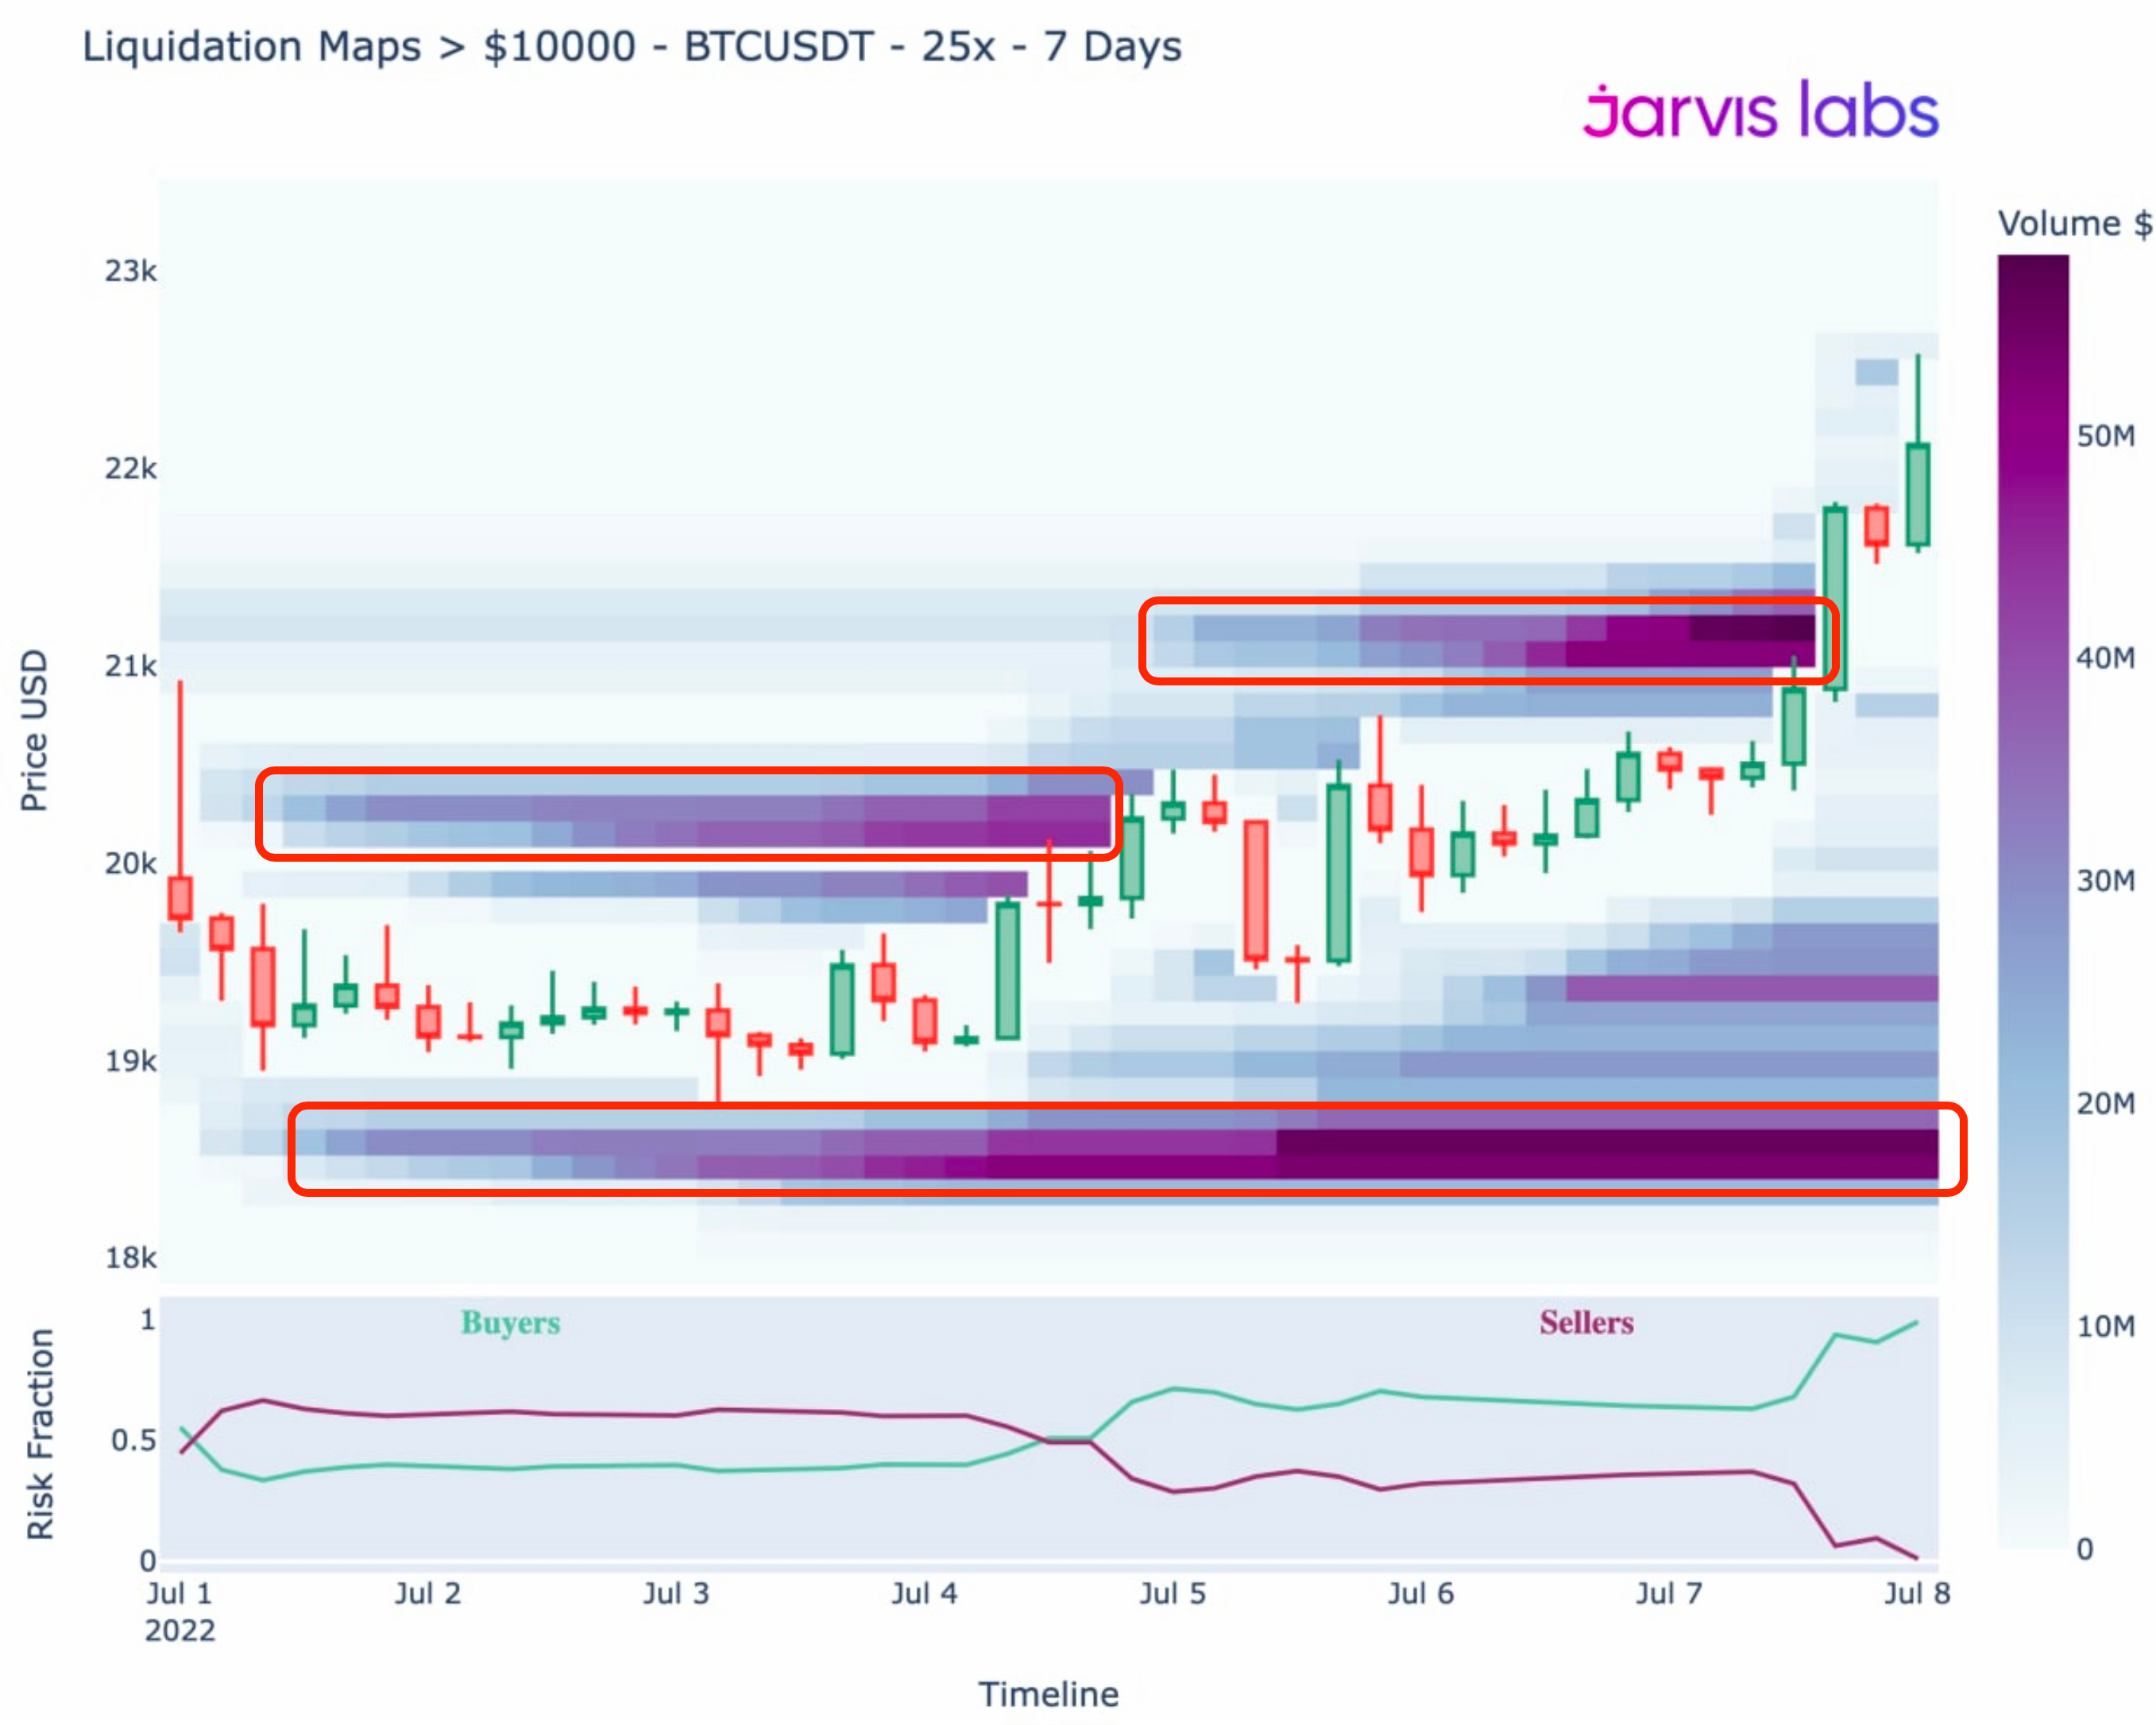
This is one of the first signs that price is beginning to behave a bit differently. And suggests that a sweep to the $25k price area looks possible.
The caveat here is that for price to threaten that level, no more skeletons can get exposed within the cryptocurrency market, otherwise more forced selling can be triggered.
But chances are declining as many entities now move to legal proceedings. This means it can be months to years before the dust settles and assets get re-distributed to creditors and depositors.
Mt. Gox for instance (yes, that’s another can of worms) has spent most of bitcoin’s life in the courts. Things like this don’t just wrap up quickly. Which is a way to say, now that the courts are getting involved in bankruptcy proceedings, these entities are no longer there to provide additional selling pressure.
This leads us to macro economic headwinds. And for now, we can leave this part out. If price begins to encroach on the $25k price level, then we can start considering whether or not any type of rally can be sustained to the upside given the state of the global financial system.
So for now, we can likely end it there and see how price reacts over the next few days. Hopefully next time we can have that conversation.
Thanks again for joining us today. We are excited to be ramping up Espresso. There are so many things we have to share with you in the coming months. Our silence over the last six to seven months is in part due to us having our heads down building. And now that we can take a minute to breath, we look to reconnect with all of you.
Have a great weekend, until next week…
Your Pulse on Crypto,
Ben Lilly
P.S. - For subscribers that already have access to our AI software, in light of our four year anniversary, we are opening up the lifetime subscription offer until the end of next week.


