The Divine Dichotomy
Macro Update: A glimpse into the continuous upticking inflation

Bali.
Island of Gods.
Known as a sleepy little resort island for the Indonesians and people in the know.
It started to garner international fame from the surfing movie “The Endless Summer 2” back in 1994. Then came Elizabeth Gilbert’s famed, self-help, travel biography of “Eat, Pray, Love” in 2006… Which in 2010 turned into a $204.6 million box office hit starring Julia Roberts.
The sequence of events kicked off a trend.
Tourists from every corner of the world made Bali a must-see destination. People arrived in droves with maps marking the locations Julia Roberts made famous.
My quiet and relaxing paradise was lost.
Despite the unfortunate popularity, there is something magical about this place that keeps bringing me back.
It’s the people and the spirituality.
I find it an intriguing dichotomy. Indonesia is home to the most Muslim’s of any country in the world. Meanwhile, the Indonesian island of Bali’s religion is Hindu.
And while these influences play out wherever I go, I’m strongly reminded of Kali… One of the most revered and feared deities in the Hindu religion.
The reason being is Kali is the embodiment of both destruction and creation. The dichotomy of good and bad all within one.
Similar to what has been gracing the headlines of late… Inflation.
Just as Kali is often misunderstood, inflation lately has been maligned as public enemy number one.
The August CPI number was revealed on earlier this month at a higher than expected figure of 8.3%. The financial markets went into a free fall. Not only was the 75 basis point rate hike expectation solidified, but market participants were also weighing the potential of a 100 basis point hike.
The 75bps rate hike got locked in earlier this week. But with the ominous threat of inflation still rearing its ugly head from month to month, let’s take a moment to look at the Kali of inflation. The good and the bad.
The Good
Every government in the world wants good inflation.
You read that right.
Every government wants inflation measured in easy to digest dosages. After all, too much of a good thing can have adverse effects.
In this context, “good inflation” is caused by increasing demand because of thriving business and economic activity.
When an economy is booming and doing well, people receive higher incomes. This in turn makes people spend more on goods and services that in turn boost the economy.
This strong demand ramps up production. And to meet this higher level production, more people are hired.
It’s a positive feedback loop that leads to inflation. And it’s the type of positive feedback loop that raises the standard of living for everyone.
This increased spending and churning of money is the M2 velocity that we mentioned in the article “Hit Em Where it Hurts” on September 9, 2022.
It’s that “V” variable in that P = MV / Q equation Lilly keeps referencing. As V rises, the price level goes up - inflation.
For the US government and the Federal Reserve (FED), the measured dosage of inflation they are seeking for is 2%.
In the chart below, the yellow box encapsulates the period of time in the past 10 years that the FED considered to be a time period of appropriate dosage. The red box in particular shows that from 2014 to 2016, the Consumer Price Index (CPI) was barely peeking through into the positive territory, and actually below this ideal amount.
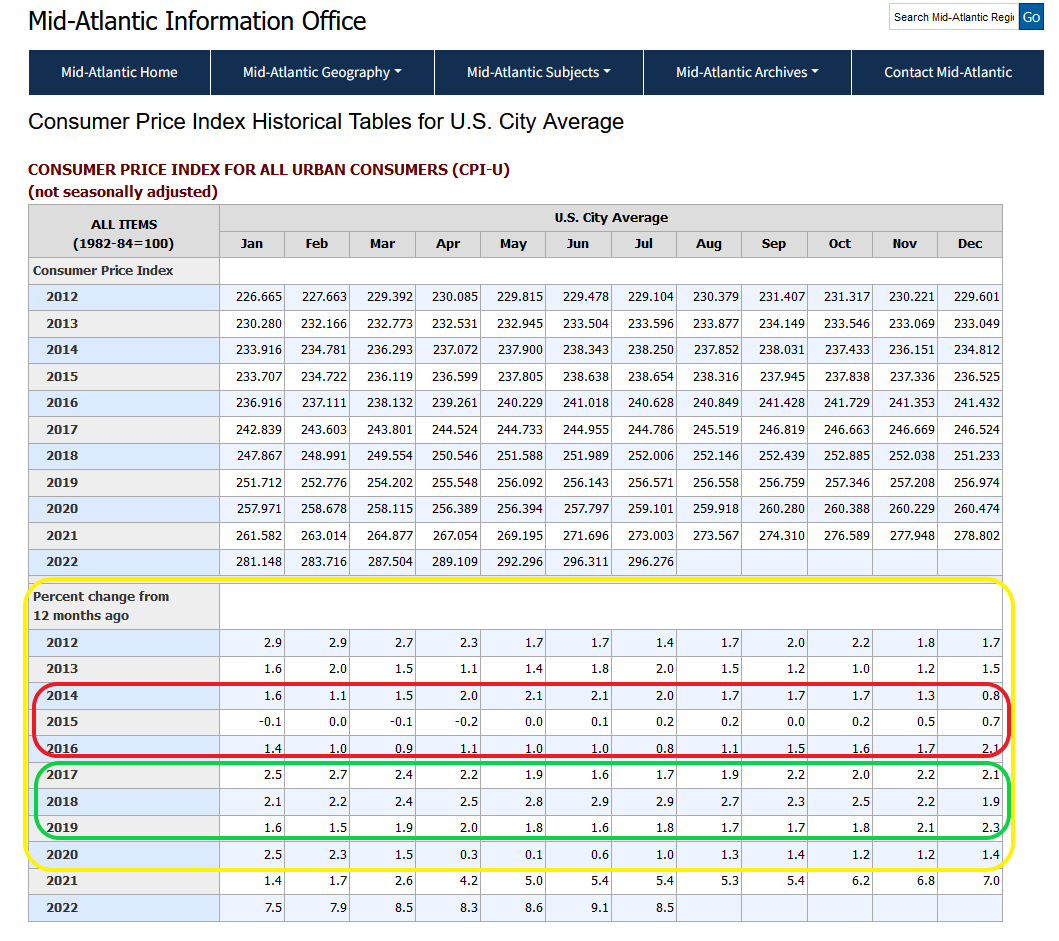
Consumer Price Index Historical Tables for U.S. City Average: U.S. Bureau of Labor Statistics
This lower than desired helping of inflation is not what the FED wants to see. Which is exactly why the FED kept the interest rate near zero. It tried to boost spending in the economy via quantitative easing (QE). It was an attempt to spark the economy.
This QE play to boost demand is a page straight out of John Maynard Keynes’ playbook.
This should Keynesian mindset should sound familiar as the last two FED chairpersons, Ben Bernanke and Janet Yellen, were both trained Keynesian economists.
John Maynard Keynes disciples are all known to be demand-side economists. And it’s in part why the Federal Funds Rate remained at nearly zero from 2008 to nearly 2016.
We can see that below in the red box. It highlights the Federal Funds Rate sitting near zero. This coincides with red box above where CPI numbers were “too low”.

Now, I’d like to shift our attention to the green boxes in both charts.
The green box in the first chart encircles the CPI figures from 2016 to 2019. The economy was doing well and the CPI numbers reflected the desired expectation from the FED. The green box in the second chart shows the FED’s action in correspondence to the economy running somewhat hot… It gradually began to hike rates.
This is a reactionary response to interest rates getting above the healthy dosage of inflation. And while this inflation is still around 2%, it is the good variety.
Let’s quickly hit on the bad to better understand the double faced nature of inflation.
The Bad
What we are currently experiencing globally is inflation that is caused by what is commonly known as cost-push inflation. Generally, cost-push inflation occurs when there is a disruption that increases supply costs.
Quite a few factors can contribute to this supply side inflation.
Factors such as: Natural disaster, geopolitical tensions, a lack of infrastructure, infrastructure deficiency, misaligned government policies, and few others.
It can best be generalized as an uptick in the cost of goods that go into producing the end result. And what is important to differentiate is the sticky versus temporary variety of cost-push inflation.
Natural disaster factors are usually temporary. Geopolitical tensions can be both temporary or sticky. A country providing goods that has rising wages is more sticky.
Now, the rise in prices we recently experienced from the COVID-19 pandemic were of the natural disaster variety. Meaning once COVID ended, things should normalize. Which would bring costs back down.
Another example of temporary inflation is that seen in the headlines of Europe. I’m referring to the lack of natural gas supply for the upcoming winter. This is a prime example of cost-push/supply side inflation stemmed from geopolitical tensions.
NATO’s support for Ukraine made Russia shut off the natural gas supply to the NATO countries. This set off a chain reaction of energy price in Western Europe, which has made prices soar. This inflation can be temporary should the conflict between Ukraine and Russia get resolved soon.
The temporary variety of inflation is one that is somewhat expected by policy makers. These are hand waved by politicians and monetary authorities as they stand at the podium.
Inflation becomes an issue when the sticky variety shows up. And what we are seeing now is the sticky variety. Which is what many seem to be missing…
The sticky version of cost-push inflation that I’d like to hit on is the rising production cost of foreign goods from countries that were once considered to have cheap labor and manufacturing costs.
To start off, China is the premier example of cheaper labor costs. Over the last decade it started to transition itself from a cheap labor hub to a value-added provider since 2015. The chart below is the economic output per person in China. As you can see it’s rising fast.
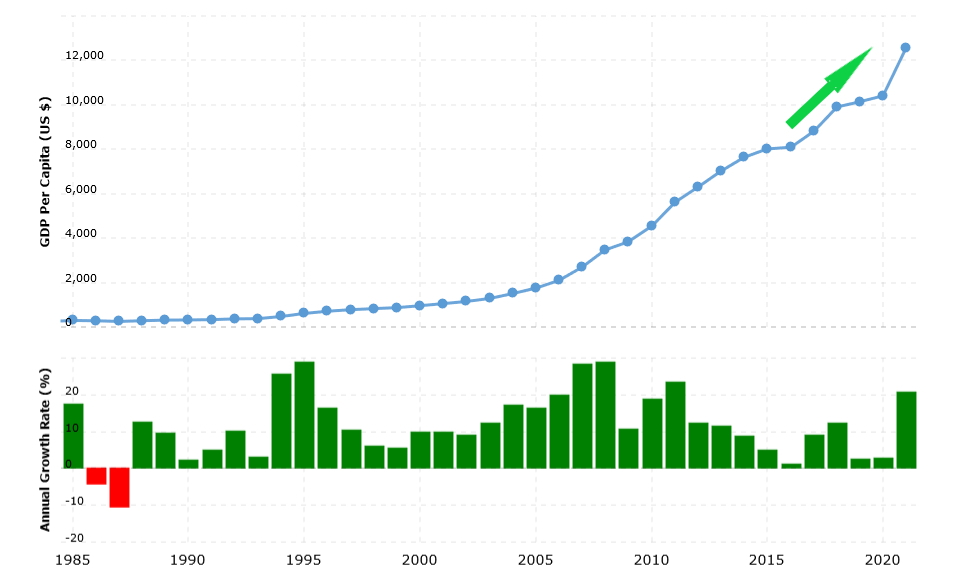
Source: Macrotrends China GDP Per Capita
The rise in China’s labor cost plus the trade war with China in 2019 also helped Vietnam become the new darling for manufacturers. In the chart below, we see a similar story… Rising GDP per person in Vietnam.
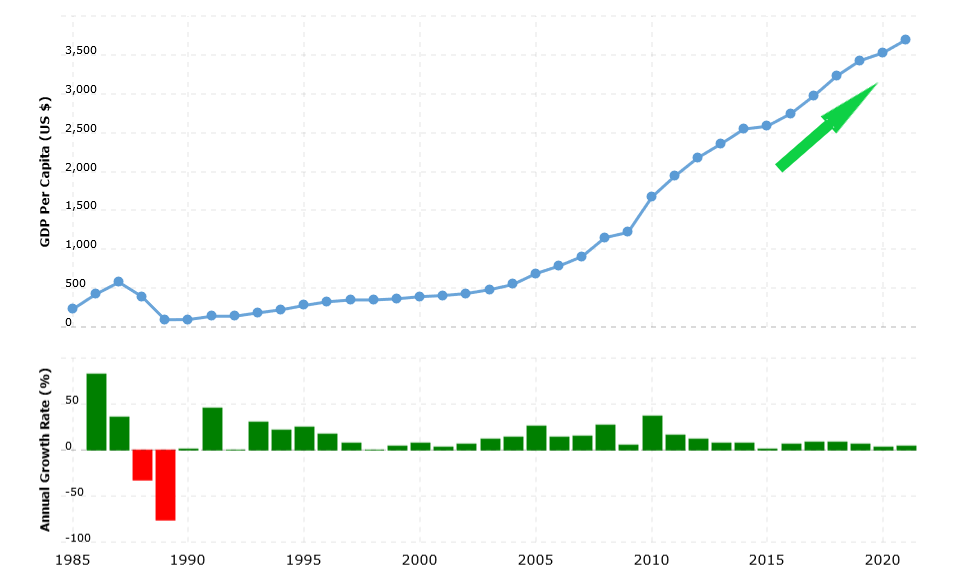
Source: Macrotrends Vietnam GDP Per Capita
Today, Vietnam’s GDP per capita shares almost the same trajectory as China.
Indonesia has long been considered to be a popular alternative as a cheap labor provider besides China and Vietnam. But the politics and the labor laws have always been a bit of a deterrent (story for another time). .
Since I am on the ground, instead of showing a chart, I’d like to provide a bit more color of the cost situation here in Indonesia.
One of my favorite local foods to eat while in Bali is a dish called “nasi babi guling”. It is a plate of savory roast pork meat, skewers, skin, and vegetables on a bed of rice. It is the quintessential Bali local cuisine that one must try.

From the same restaurant that I have frequented for years, the cost of this magnificent delight went from $30,000 IDR the last time I was in Bali (before COVID 19) to $40,000 IDR as of a few days ago.
That is a 33% increase. And this is a local haunt. Definitely no tourist trap.
And just a few days before my arrival, on September 3rd, 2022, Indonesia raised the fuel cost for gasoline/petroleum and diesel by 30%. The taxi that I’ve always used told me that they cannot give me a price quote because they need to figure out how much the new fuel cost will be before they can give me a price.
I ended up paying $350,000 IDR instead of the $250,000 IDR I normally pay. An increase of 40%.
This massive bump in the fuel price sparked numerous protests and riots in Indonesia that hit news outlets recently.
But the point is, the trend in Indonesia was no different than other low cost hubs. The GDP per capita in Indonesia shares almost the same story as China and Vietnam per the chart below.
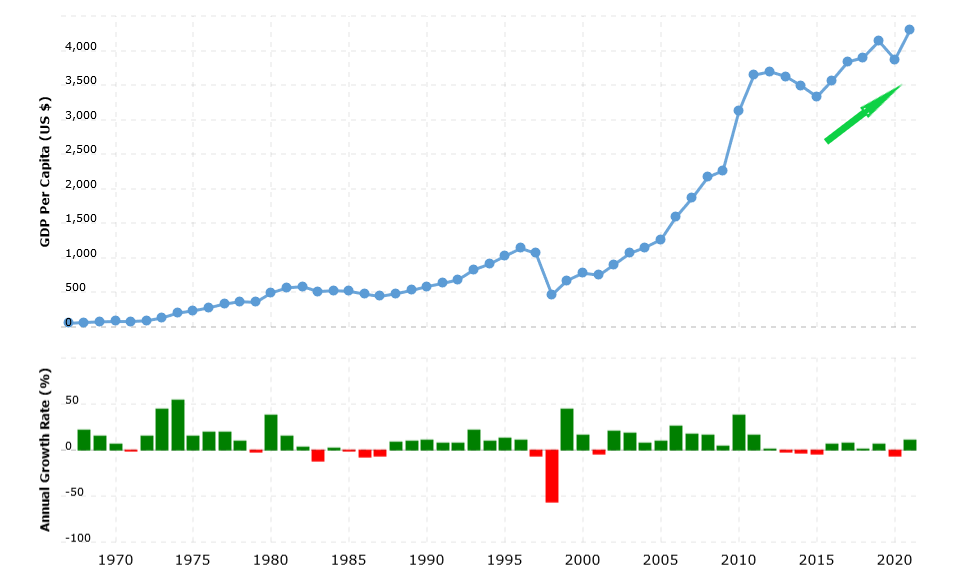
Source: Macrotrends Indonesia GDP Per Capita
What this GDP per capita translates to is rising costs.
Essentially it all starts to add up. All the places that the U.S. and the Western Hemisphere outsourced their manufacturing to… In order to grab cheaper goods to mask their inefficiencies in monetary policies are finally having the bill come due. The bill of high labor costs… Which translates to sticky cost-push inflation.
Translation: The days of sourcing cheaper goods from overseas are numbered.
Looking for Divine Intervention
Now, make no mistake. The FED is in a bind.
They are trying to fight inflation while also attempting to navigate the US (if not the global) economy through the treacherous water of high debts and slow economic growth.
It is not a job I would be looking to apply for… Ever.
But that fact of the matter is, a rising dollar helps alleviate this exact issue. The issue of supply costs. And with a stronger dollar, the ability to more easily pay for exports becomes a reality again.
Whether or not this rise in the U.S. dollar is intentional or not, this is one way inflation can be lowered. And if I had to guess, this is likely intentional.
Which means we really do need to the FED at their word when they say their primary concern is to fight inflation. They are ruthless.
Which means the next question becomes… Is this enough?
While I would enjoy taking some more time to weigh this question… The fact is, Bali’s beach beckons.
If you have a thought on the matter, please drop it in the comments below.
Thank you for your time and thank you for reading.
Wheels up,
TD


