The Coming Tipping Point
Notes from The Lab: Daily user counts and the adoption curve


Kilroy! Kilroy!
After a few seconds of robotic sounds, Mr. Roboto by Styx ends... Giving way to silence.
In what now feels like a habitual occurrence, my prized relic Walkman makes a click… The mixtape is over.
The noticeable silence pulls my attention away from cleaning. Without rewinding the tape nor removing my headphones I reach for one of the books I’ve been thumbing my way through.
Just as I find the dog eared page, somebody lifted up the headphone on my left ear and asked,
“Anything I can help you with JJ?”
It was Mr. Lilly!
Seems I didn’t hear him as entered the room and said hello…
And after my initial shock wore off, we got to talking about markets as we typically do.
He listened to my thoughts and even pushed me a bit on why I thought a certain way on things. One topic he seemed especially curious about was my thoughts on how the number of users per day are rather consistent for crypto right now.
As I finished up my view on what this consistency meant, he broke out a couple of charts from his briefcase.
He proceeded to talk about “tipping points”.
“New technology” he explained, “or behavior change, may take decades for the majority of society to embrace. But the time where it goes from a small percent such as 10-20% to a major portion of more than 75% is measured on the scale of not years, but months. This time period is the tipping point and represents the flip being switched for tech adoption.”
In other words, a possible spark to our Powder Keg of Stablecoins !
He showed me this chart first and explained how everything from basic electric, to the internet and cell phones, were once obscure… only used by very small portions of the population.
Even colored TVs he brought up were invented in the 1955s.. but nearly 40 years later in the early 1990s hotels would advertise colored TVs. He pointed out this showcased when they hit mass adoption as seen in the chart he showed me below.
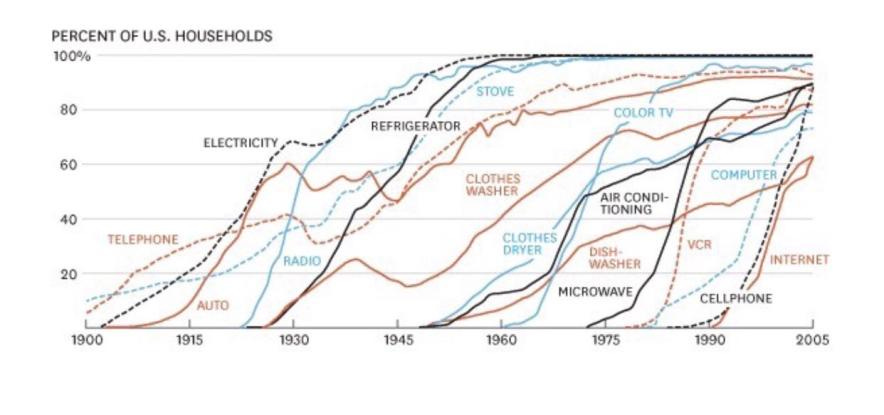
“If it’s always taken years to decades for even the best ideas to catch on, why should we expect the mass adoption of crypto to unfold any differently?” he asked.
He followed it up with a chart of Bitcoin’s daily active user count.
What it measures is the amount of unique users actively exchanging BTC on a day to day basis.
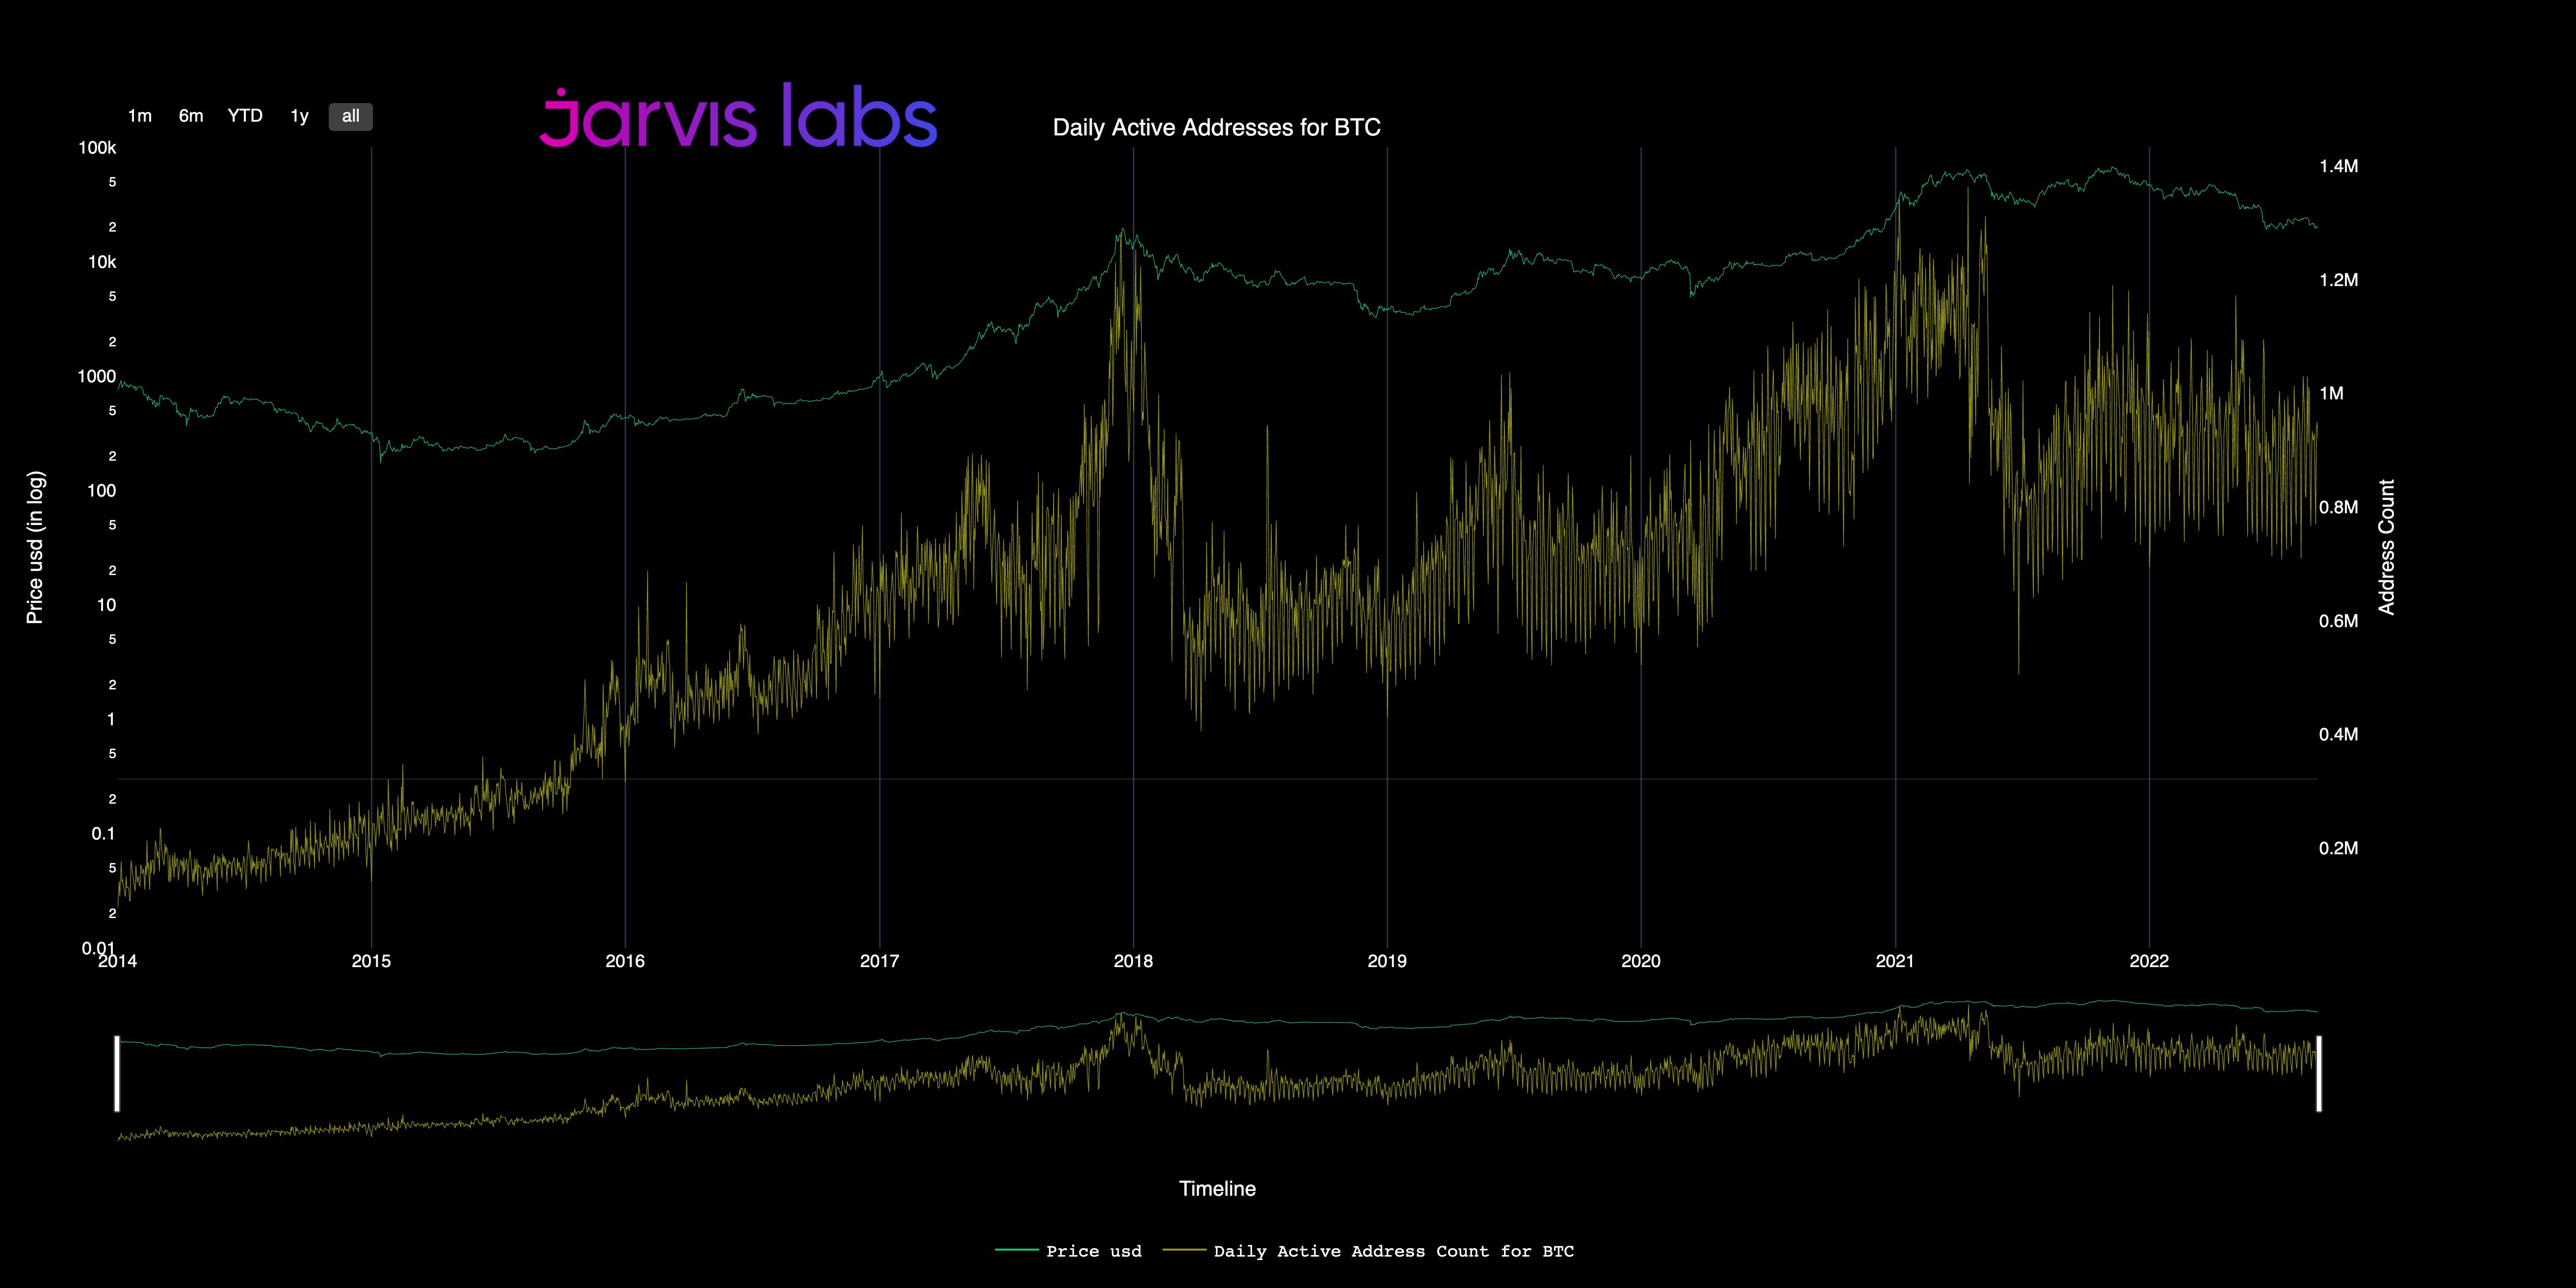
Currently this number hovers between 750k-1 million.
This may seem like a lot, and for BTC it is, but Mr. Lilly told me in the grand scheme of things this number is still below the tipping point. A range that he mentions can take everybody by surprise.
That’s because real adoption like payment solution Venmo has over 50 million active users and PayPal over 429 million!
That makes 750k-1m look like a small drop of rain in an endless ocean.
To help you guys understand this better I tried my best to summarize what Mr. Lilly taught me below.
In the follow note, I’ll discuss Bitcoin’s historical numbers to help gauge what the future has in store for us, and if the next uptick in users might lead to a tipping point of adoption that takes the market by surprise.
Hi everyone, my name is JJ - the night shift janitor here at Jarvis Labs.
Once I started working here I noticed the professors of Jarvis Labs frequently leaving up charts, reports, and even equations on the whiteboard once they finally left in the middle of the night. The stuff seemed pretty important, so I started interpreting these things for myself.
It wasn’t long before I realized it was like trading cheat codes. And lucky for you, my friend is sick of hearing me talk about it.
Every week I will try to share the coolest and most exciting thing I find laying around the halls of Jarvis Labs. I hope you like it and follow me because if I get 1,000 followers on Twitter (@JLabsJanitor) my friend will buy me a pizza.
So be sure to click the subscribe button below to get a weekly “Notes from The Lab” sent to your email.
History
BTC completed its first major bull run in 2013, going from $10 to $1000 within the same year.
This euphoria was followed by one of its notorious crashes, and a long consolidation period of indifference.
Not unlike the times we’re living through now.
In fact, that 2013 price crash was much like 2022’s. Rather than price falling down in a straight line in November, it instead walked itself down in a painfully slow fashion for nearly a year.
All the while price was falling, daily active user numbers continued to consolidate in the 150-250k range.
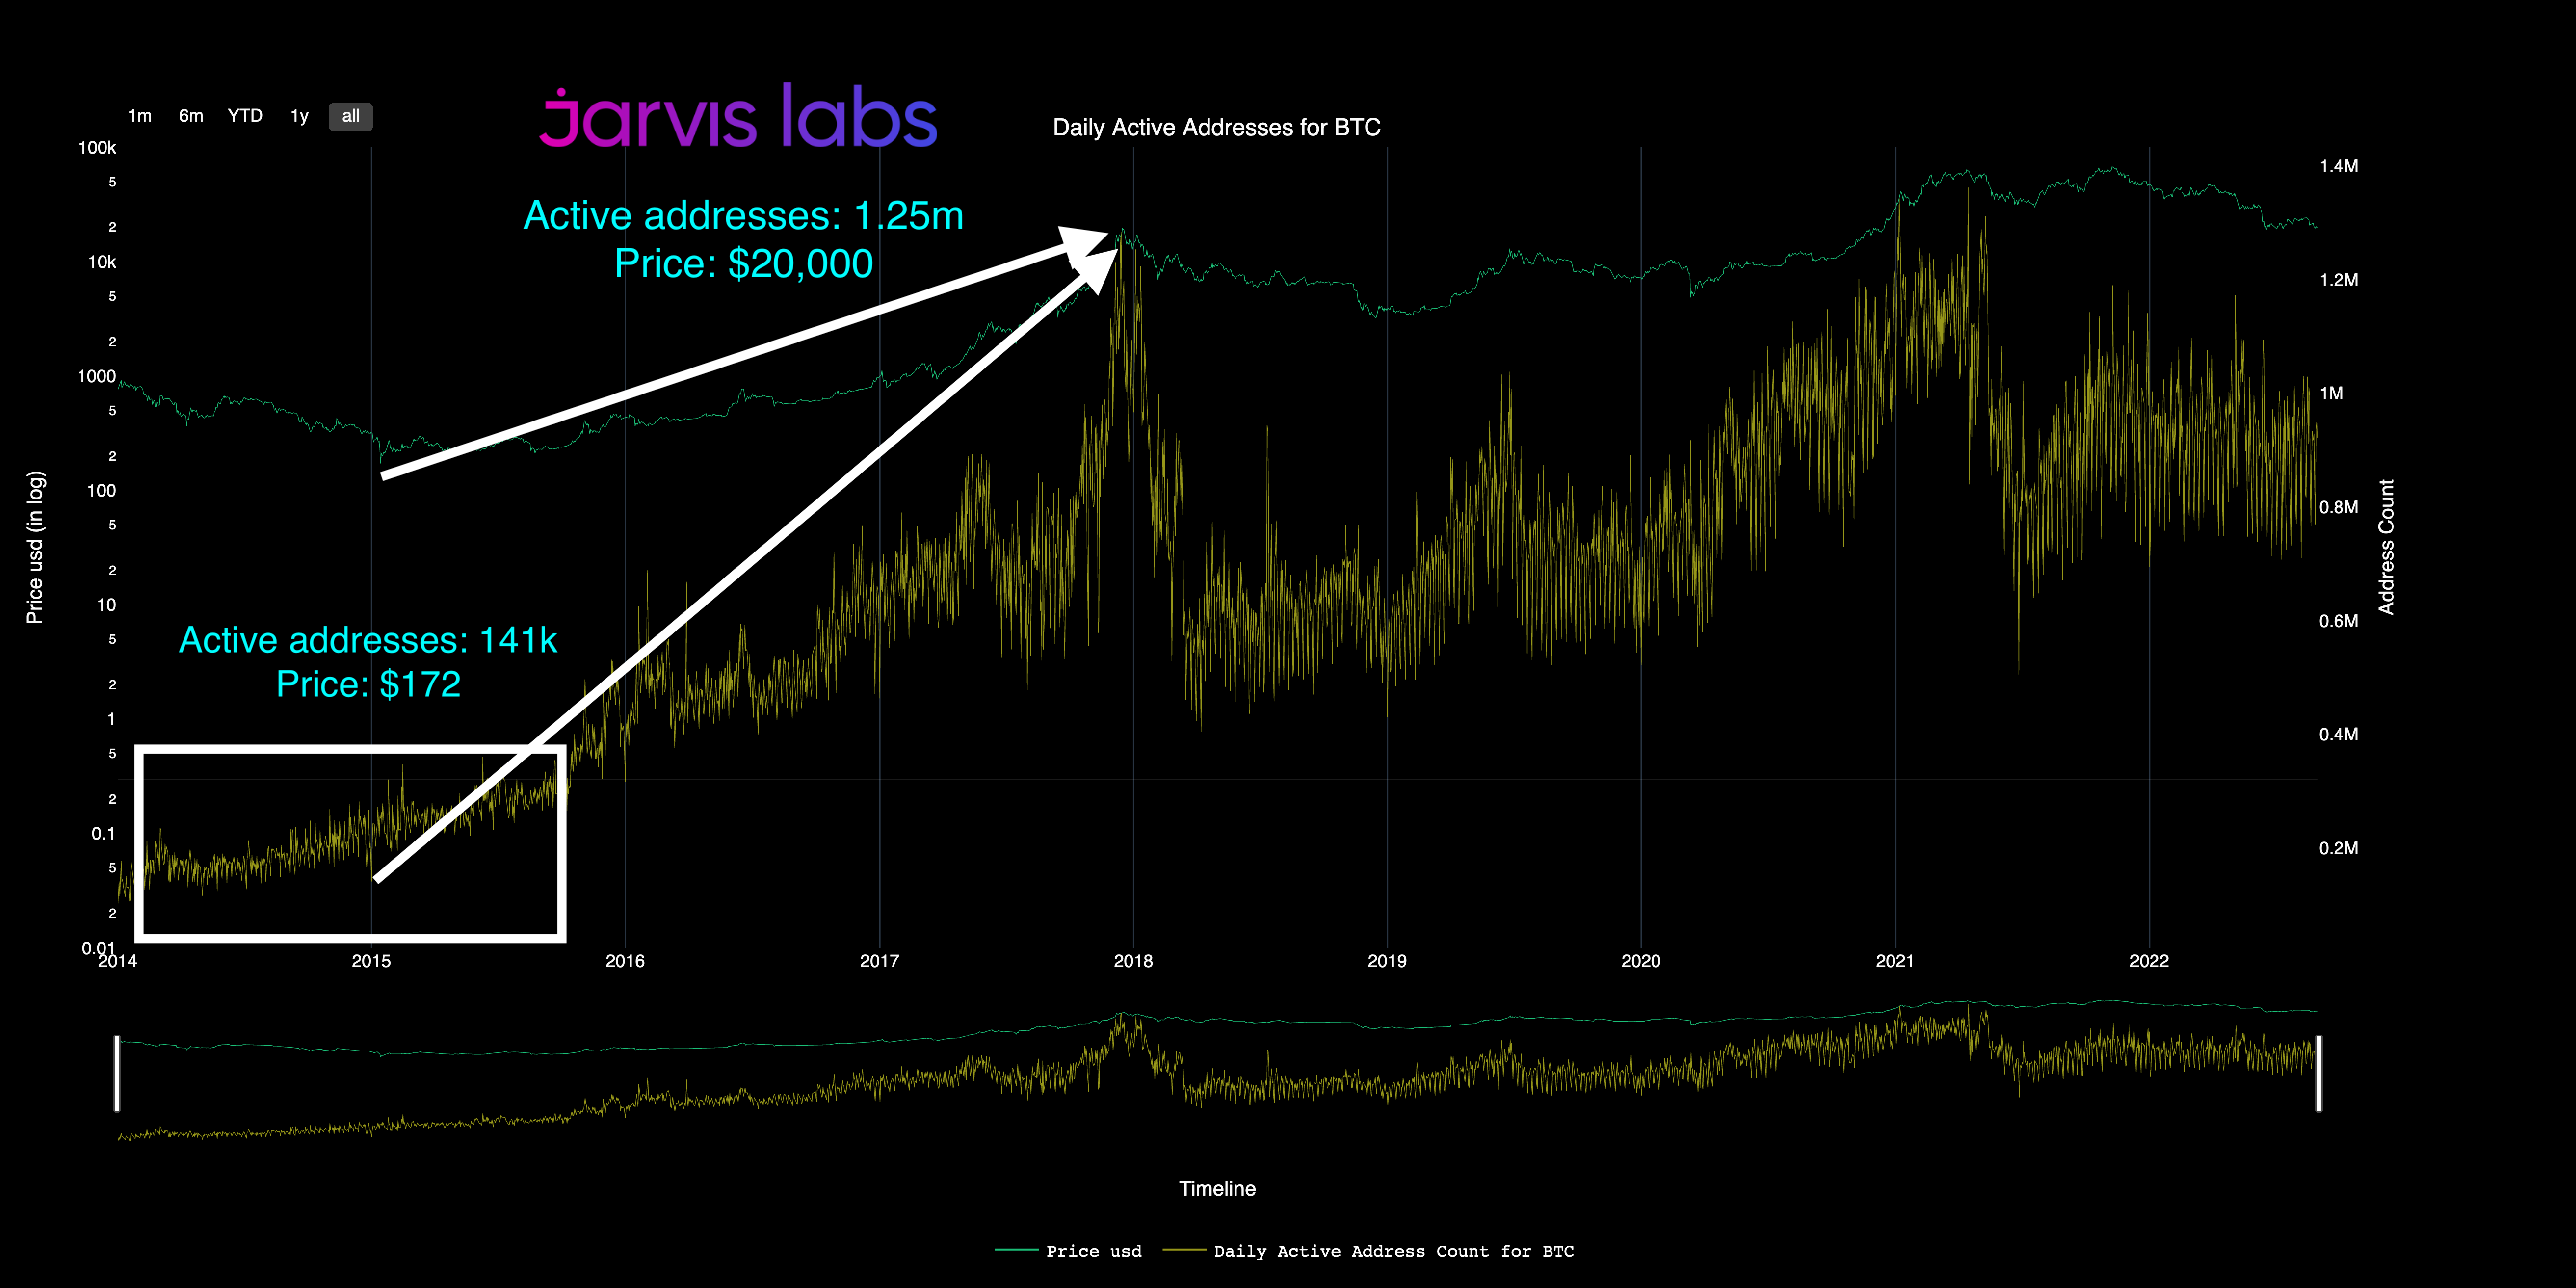
Then on New Years Day 2015 there was a huge drop off in active addresses, followed by a selloff that sent price down nearly 50% from $300 to start the year, to $172 just a few days later.
This purge was followed by an immediate rebound and a massive shift in Bitcoin interest globally.
From that point forward BTC active addresses grew in a parabolic fashion, and price went up along with them.
By New Year’s Day 2018 active addresses had grown to over 1.26 million, with price trading near $20,000.
Nearly a 200x price increase in just under 36 months.
But as the chart shows that early 2018 period of extreme euphoria was not sustainable.
BTC price and active users quickly returned back to Earth, and went sideways for the remainder of 2018 and into early 2019.
This consolidation formed the foundation upon which the most recent Bitcoin bull run was built upon.
By 2020, the market found its next leap in users thanks to The Fed’s sending trillions of dollars into the market after COVID, a moment in time encapsulated by the money printer go Brrrrr meme.
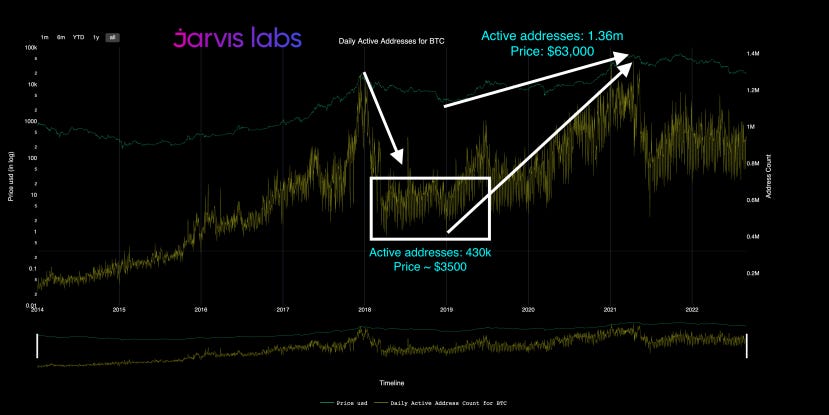
That user count foundation and new catalyst in the form of Brrr sent Bitcoin price flying. Daily active addresses also followed and grew to a peak of 1.36 million, nearly 3x in just 2 years’ time.
Which led us to BTC’s most recent golden era…
In 2021 Bitcoin gained massive media coverage following a wave of large purchases by institutions like MassMutual and Elon Musk’s Tesla.
These developments made many euphoric, and convinced them that the asset’s period of mass adoption was finally here.
Price reflected this extreme optimism and rose to over $63,000 in early 2021. Nearly 20x it’s January 2019 low.
But the good times were short lived.
Once again, our shooting star burned out then faded away after the Chinese government banned Bitcoin mining in the spring of 2021.
This direct hostility initiated by one of the world’s most powerful governments sent BTC’s active user count off a steep cliff.
Below we see how it fell by over 50% practically overnight. Price matched this downward movement and also fell over 50% from it’s ATH.
Since then the daily active user count has recovered and has spent the past 16 months consolidating in the 750k-1m range.

The Future
The previous patterns suggest ~24 months worth of consolidation will be needed to cement a foundation firm enough for another bull run.
This assumes active user counts remain near in their current range of 750k - 1m until sometime in early to mid 2023.
But what was most interesting was how this lines up with what Mr. Lilly explained as that tipping point moment.
You see, Bitcoin has witnessed consolidation ranges of about 200k users, then around 400-500k users, and now about 750k-1m users.
Each time this figure roughly doubles.
This implies the next consolidation would sit around 1.5m to 2m users… Which is getting very close to that moment where growth can take an order of magnitude leap.
The type of leap that leads to Venmo or PayPal numbers in the span of one to two years.
If Bitcoin’s user base grew to Venmo’s size, that would justify a 50x price increase, bringing us to a $1,000,000 fair price per BTC target.
I can see why so many talking heads have thrown this number out there now… But they seemed to neglect how adoption unfolds.
What’s even more unfathomable here is a PayPal type of user count would imply nearly $5,000,000 of fair value per BTC. This type of tipping point feels insanely unreachable due to PayPal’s active user count near 250m.
I personally don’t see that playing out… But I also understand that a tipping point for technology might result in things I could not foresee happening. So it’s still interesting to simply look at the comparison.
As Mr. Lilly mentioned, “Whether or not this tipping point plays out in the coming year, be prepared for any possibility. Studying history helps you navigate the future.”
What do you guys think?
Leave a comment below or let me know on Twitter @JLabsJanitor!
And as always, thank you reading….
Your friend,
JJ


