Powell Checks to the Market
Weekend ChainPulse


Yesterday was J-Pow’s turn.
Would he raise or fold. That seemed to be the question on everybody’s mind. And just like the expression goes, his poker face revealed little as he stoically played his turn.
He checked.
In effect he told the market to make its move.
This is somewhat par for the course. The FED is notorious for reacting when something breaks instead of periodic maintenance. Which means to get the printer fired up the markets need to buck like a freshly branded bronco.
What this means for us is looking back on Monday's ChainPulse Report, our gameplan still holds.
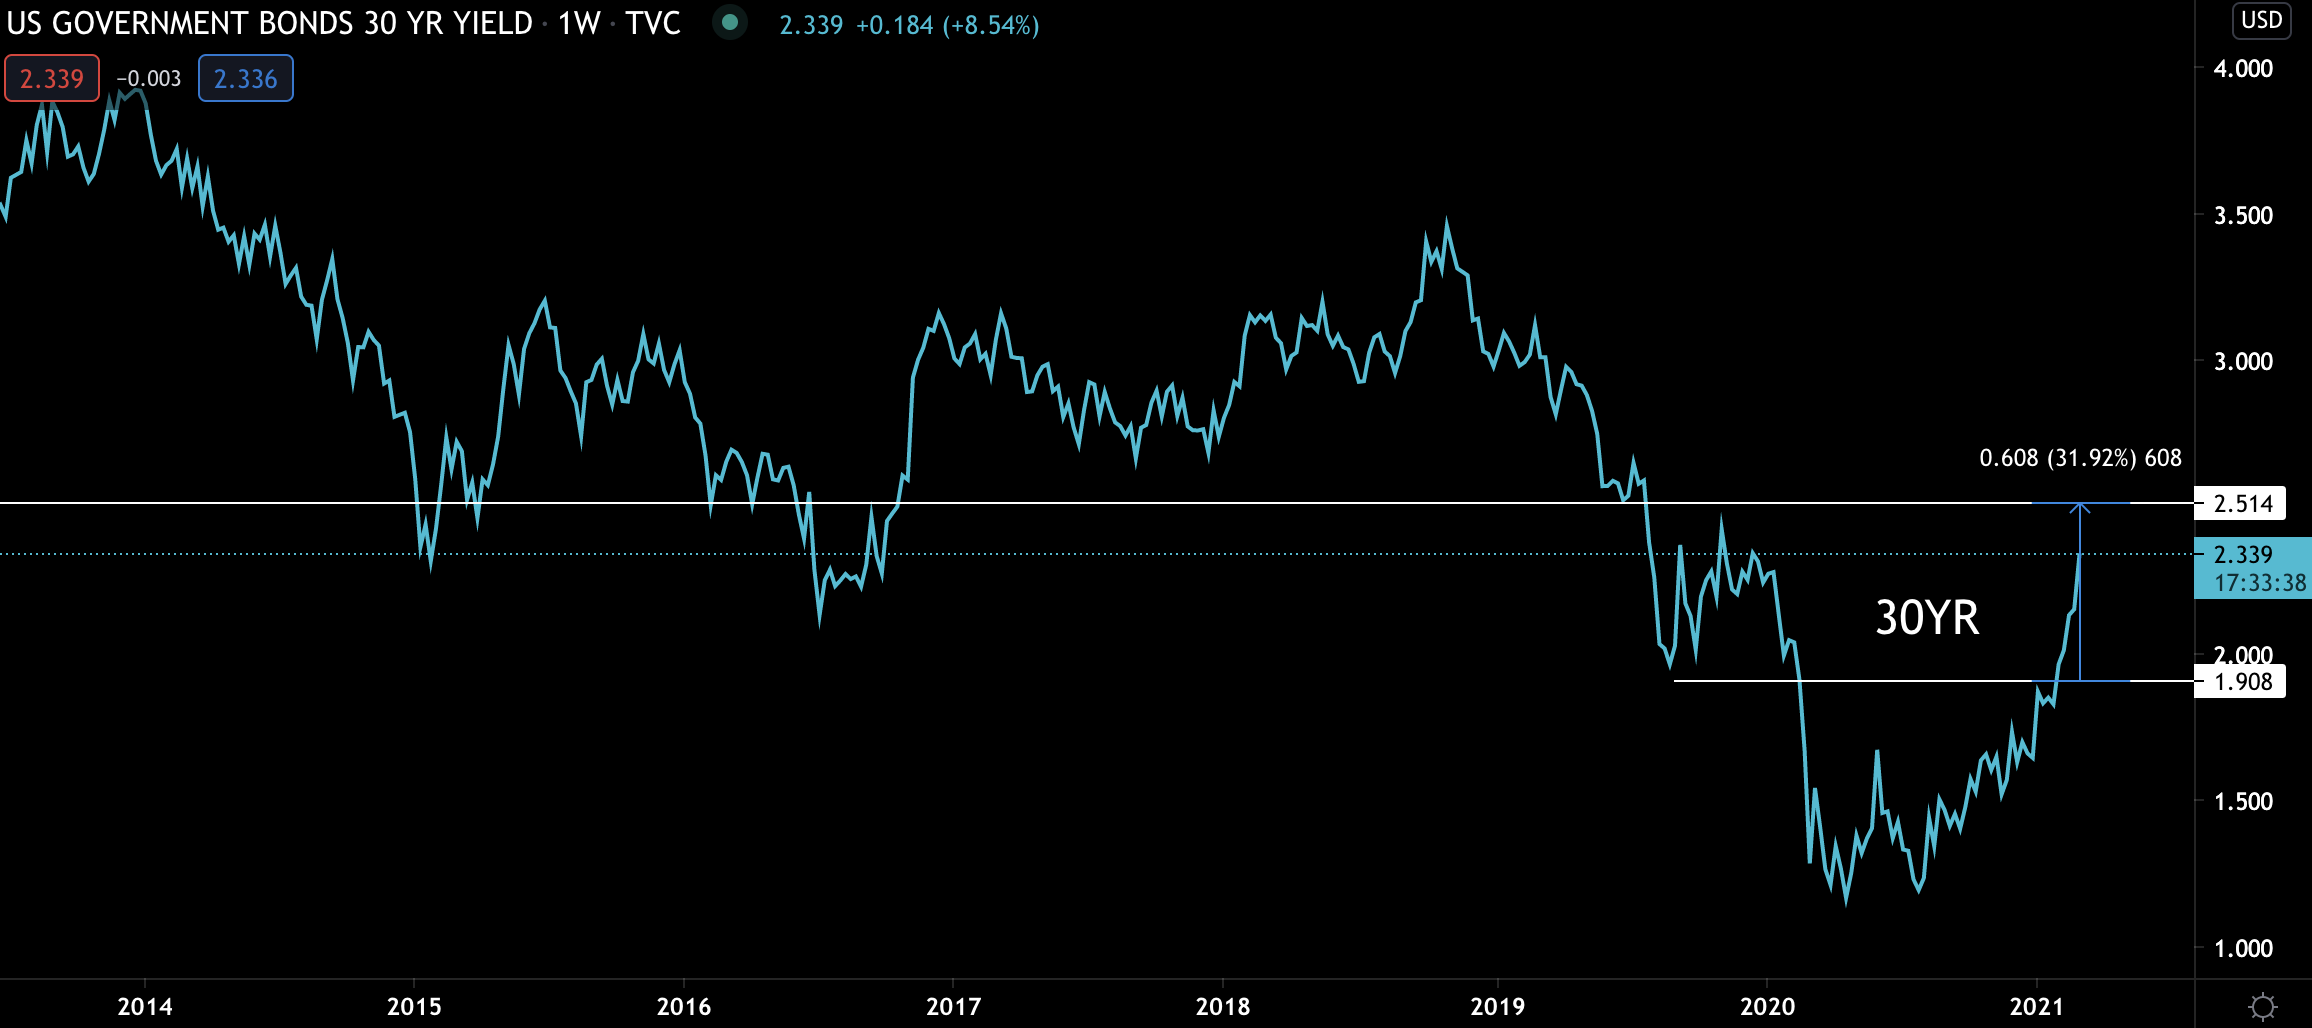
We’re expecting yields at the long end of the curve (10-30yr bonds) to start rising more so than those with shorter terms. The DXY is eyeing a reversal, whether it lasts a few weeks to months we don’t know yet. And equities as well as bitcoin will need to weather the storm until the FED does something.
Luckily, bitcoin is holding its own relative to the equities market. Here’s BTC compared to the S&P 500.
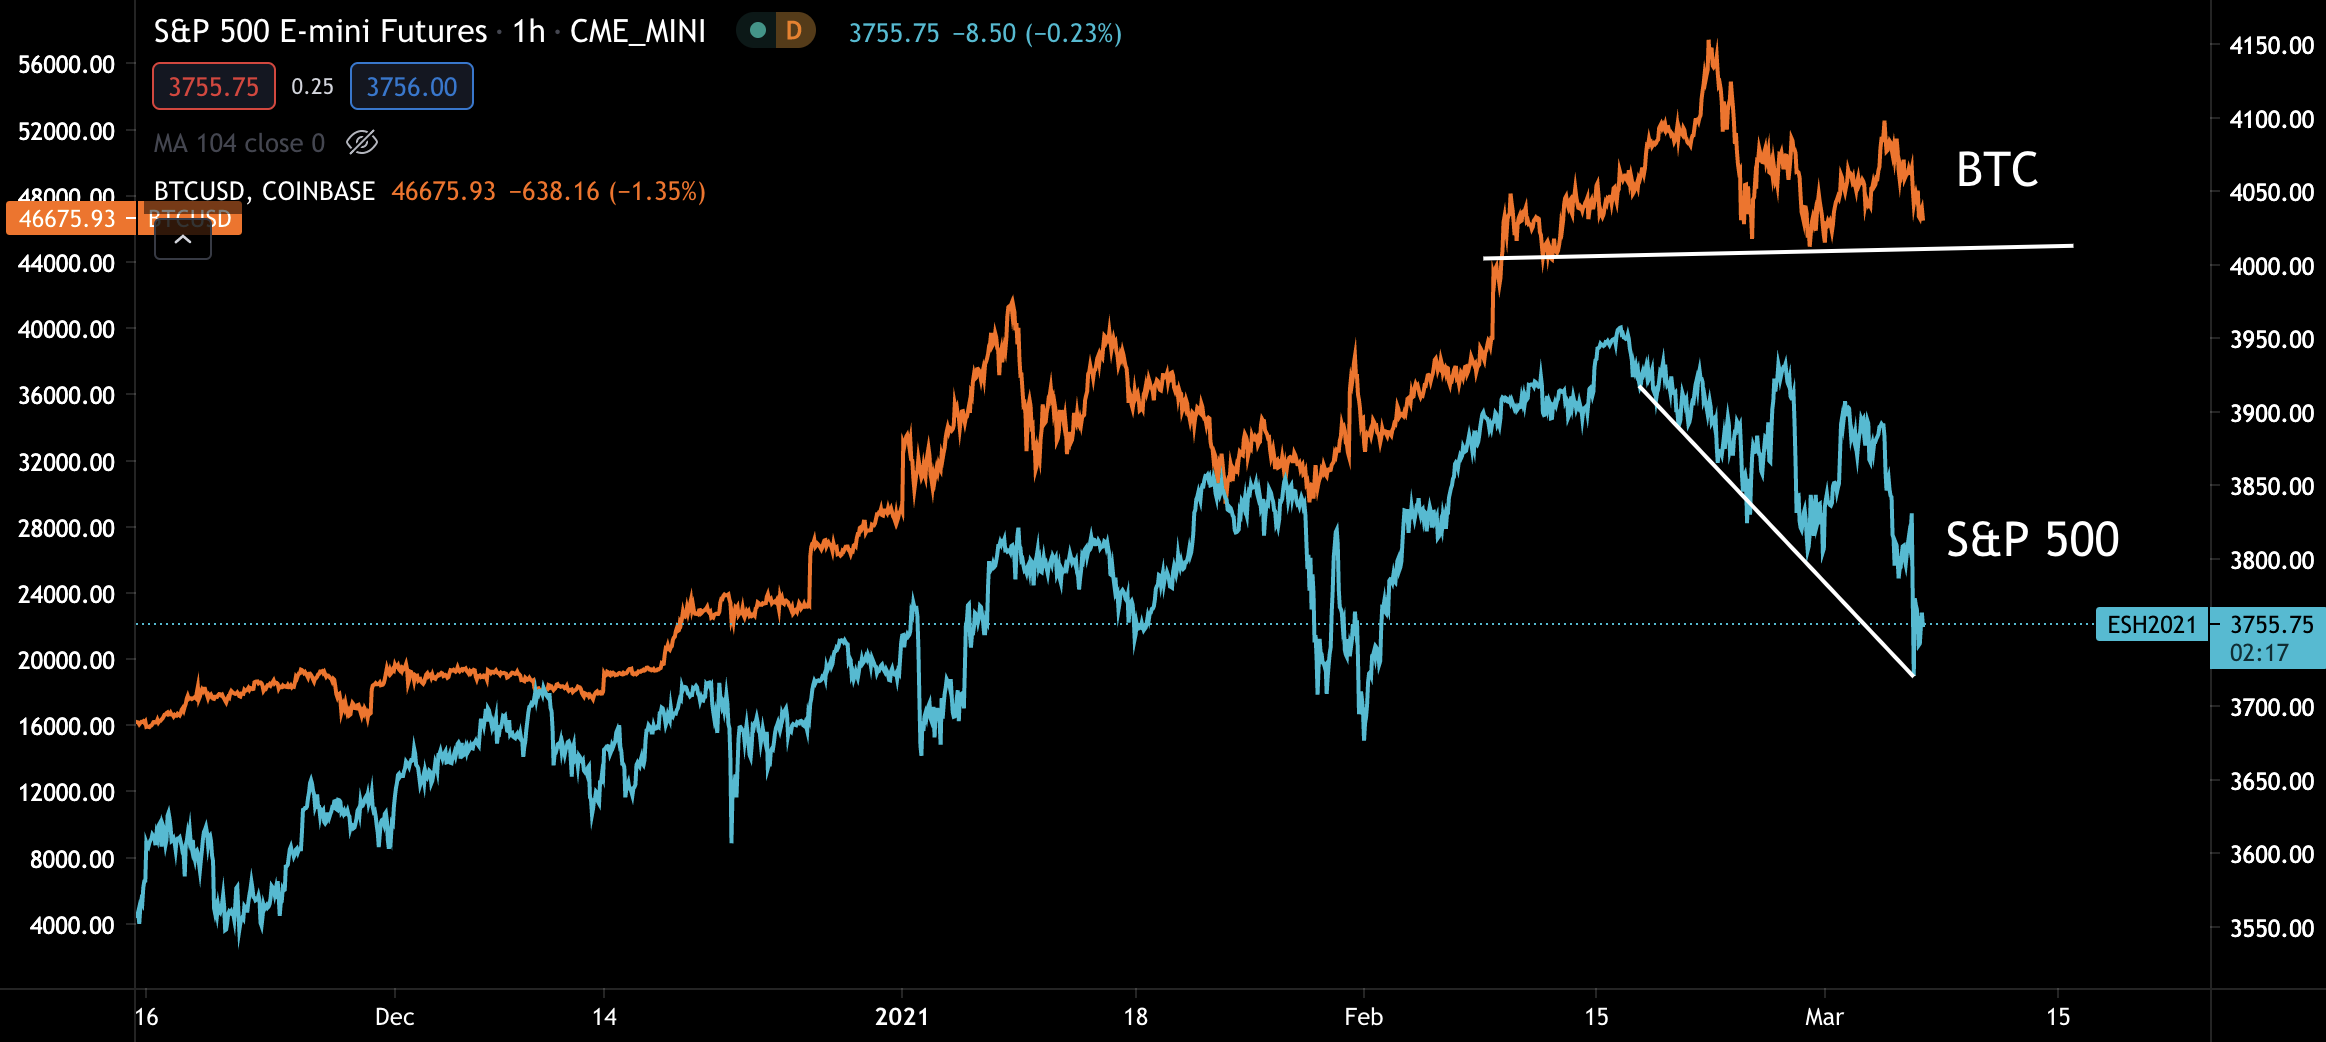
As you can see, the bottom trend line looks better for BTC than it does for equities.
Keep in mind, if the S&P 500 or Nasdaq breaks down a bit further, then expect a run towards safety to take place in the market. This would result in fast moves to the downside for BTC and a quick spike in DXY.
A similar scenario resides in 30Yr yields. We likely won’t get the move today, but if yields run past 2.5% with some force then that’d be another situation where DXY continues on its path and stocks/crypto take another blow.
On Monday we’ll likely break this down some more. Just know for today we’re really watching just keeping an eye on equities ad yields.
For equities we just want them to hold strong at their current levels or bounce a bit. For 30yr yields we want it to stay below 2.5%. Anything above that level brings in a range as high as 3.5%, which is almost unfathomable at the moment.
Other than those developments not much has changed in bitcoin and crypto’s structure.
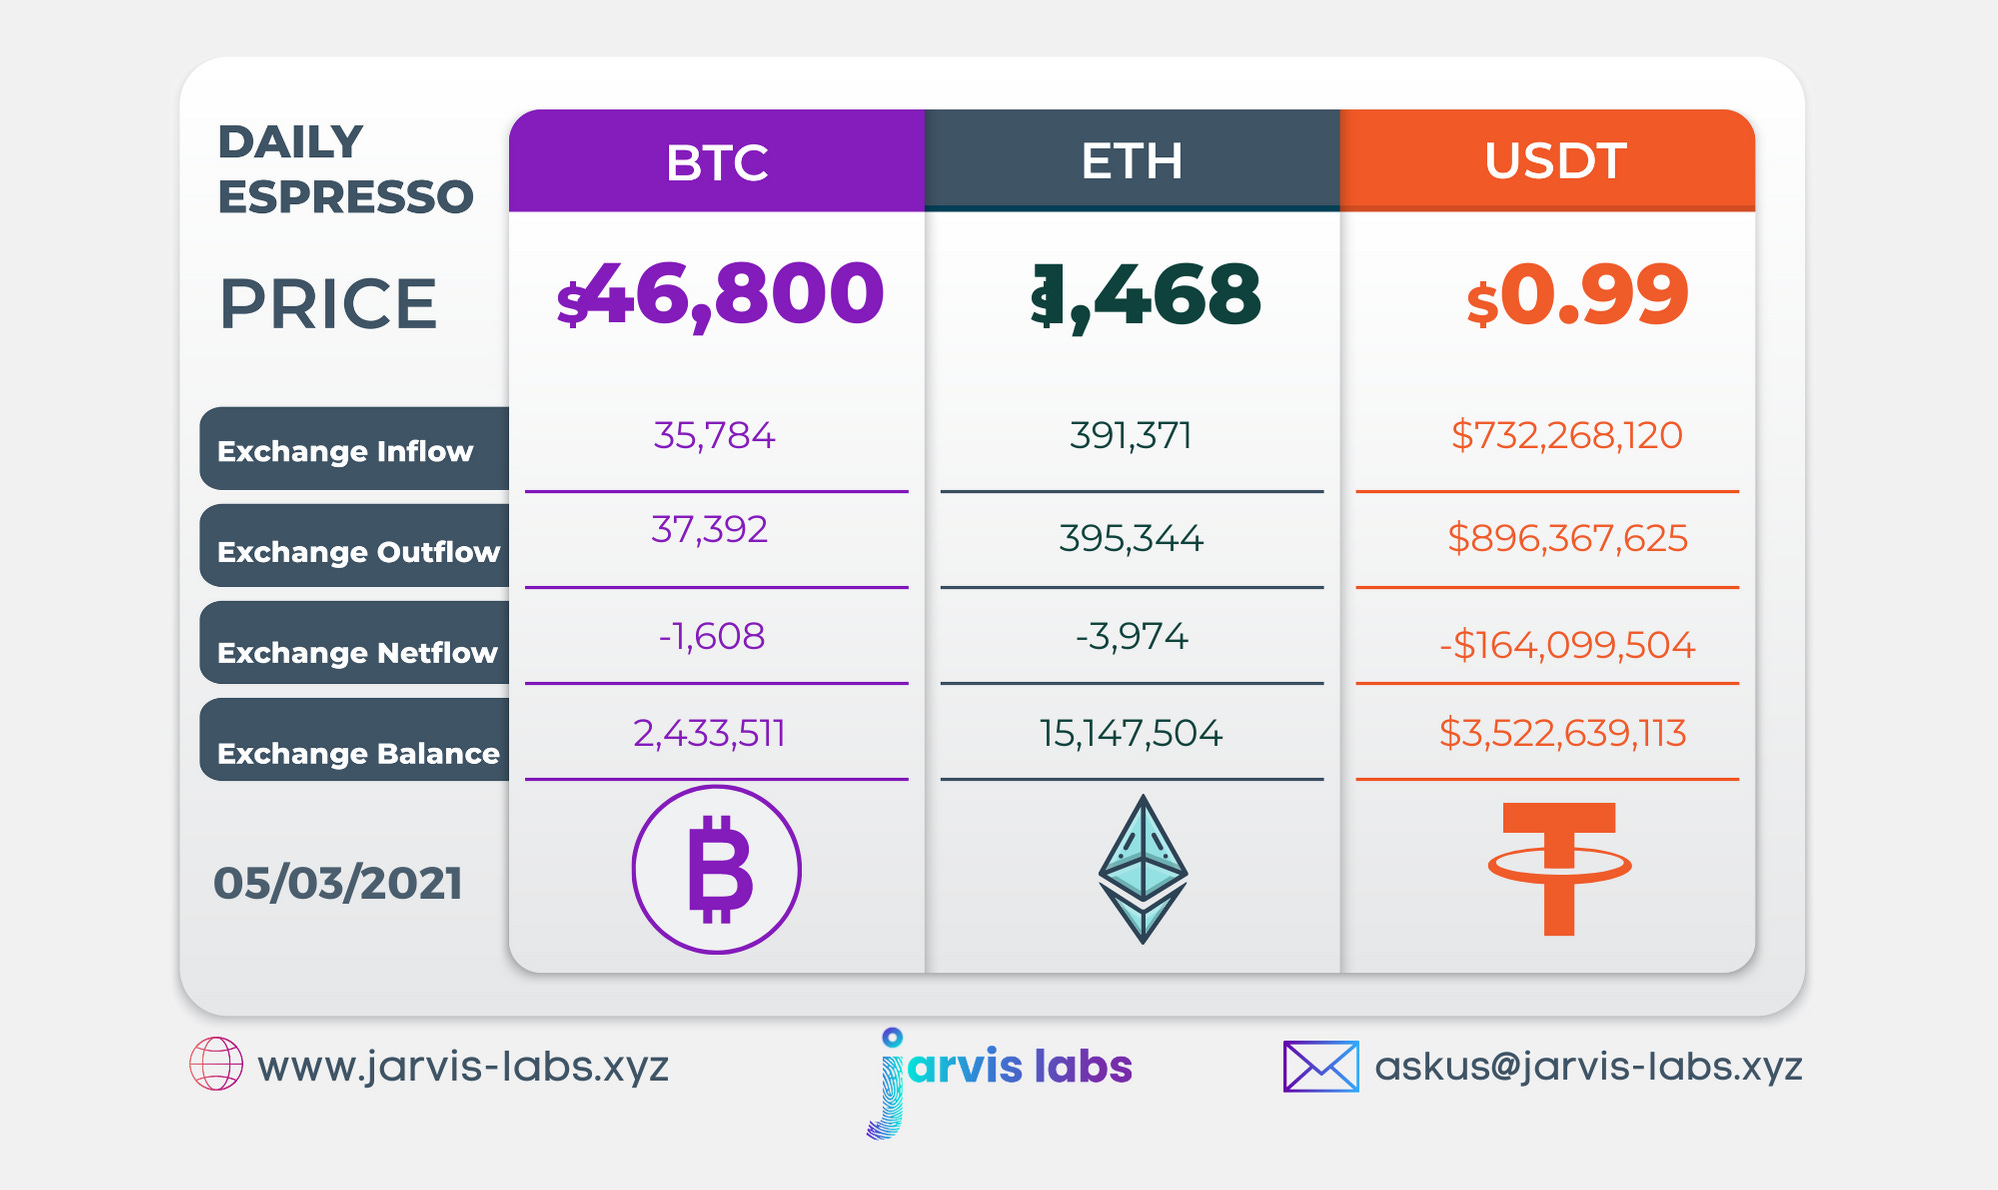
Of the $400 million USDt printed this week, $80 million USDt was deployed. We witnessed the price jump over $5,000 to just over $52k soon after. It was nice to see how potent fresh Tether can be in the market when funding rates aren’t insane and risk is in check.
Speaking of funding rates, we’re beginning to see more green on our funding chart than red.
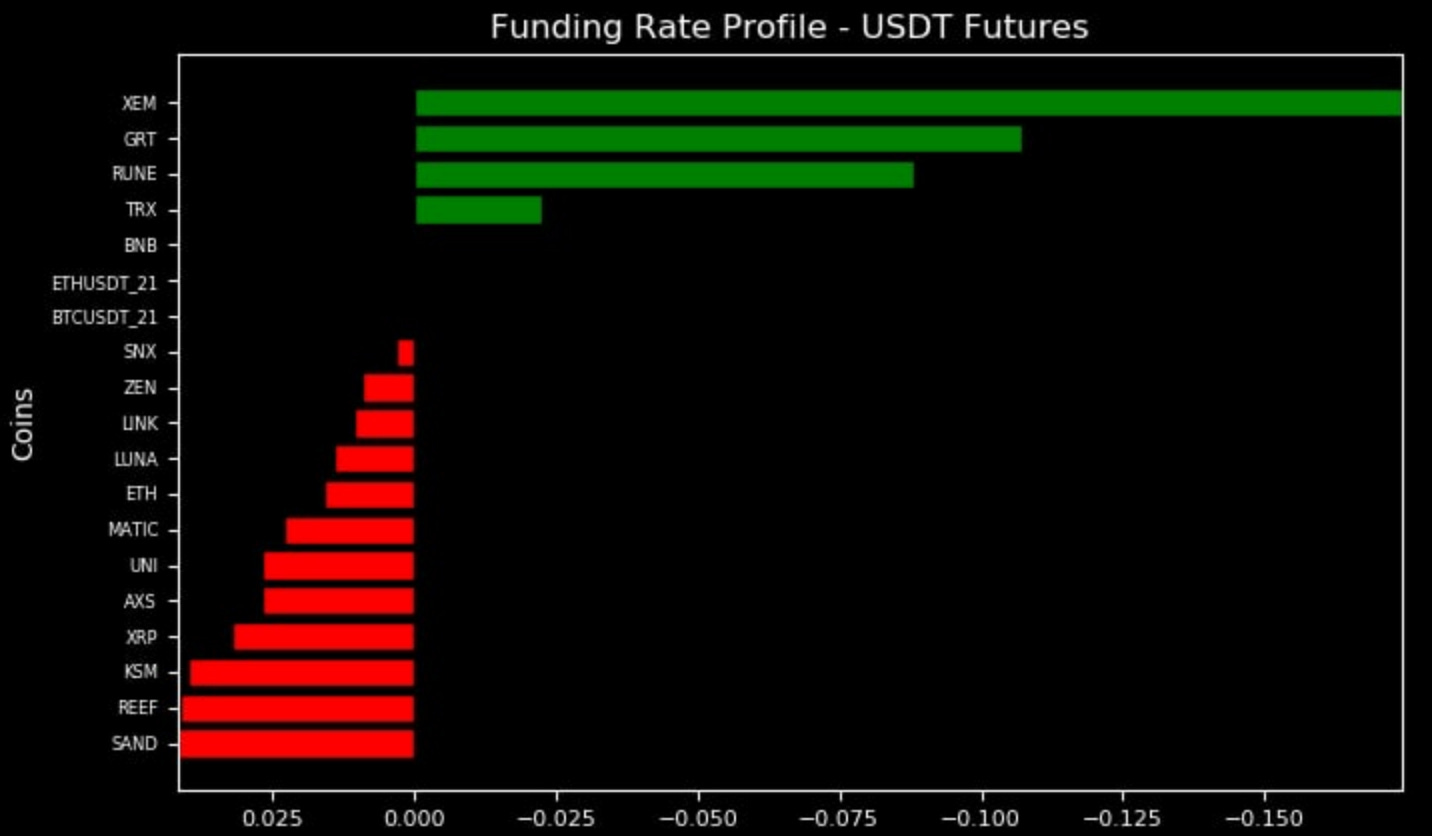
This means the bears are just beginning to come out of the woods. We like this since negative funding rates - which happens when traders holding a short position pay those holding a long position - can be a great catalyst for higher prices.
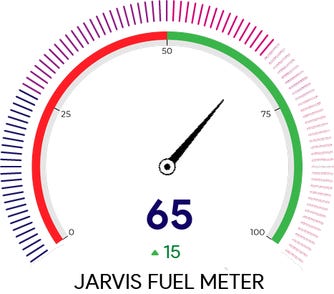
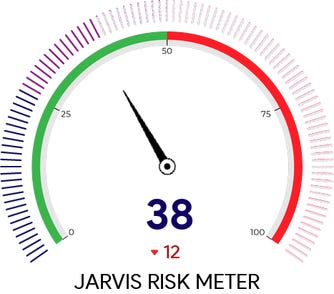
It’s especially true when risk levels are neutral. Here is the risk and fuel meters as of this morning. Infact, risk meter looks really good.
Our funding heatmap and intensity charts look similar to Wednesday, which basically says things are neutral.
In summary, the structure looks great for a bitcoin, we just need to get through some of the macro headwinds. During times like this markets get heavily correlated, which means traders tend to be all honed in on the same thing… The FED.
Let’s see how the market plays its turn next week.
Your pulse on crypto,
B
Below is our daily exchange flow data. This is a great gauge for understanding if BTC, ETH and USDT are flowing into exchange or leaving. If BTC and ETH are entering exchanges it can generally be viewed as bearish. The opposite scenario is bullish.
When USDT is flowing into exchanges it’s typically viewed as bullish. The opposite scenario is bearish.
This should only be used as a general gauge. Tagging the exact wallets these flows move into or out of helps improve the reliability of this data, which is what we do at Jarvis Labs. To date we have over 800 market mover wallets and 16 million wallets tagged all together. Consider us your on-chain trackers.