Options Has Never Been More Exciting
Options Market Update: 14 Feb 2024

The options market is turning into a frenzy.
If I, JJ, were to write about all the action going on, it would take me about 15 pages and Ben Lilly would likely need to ship a 5lb bag of Espresso beans overnight to his desk.
There’s that much going on right now.
So to get this out in a timely manner, let me just hit on a few topics of interest that we need to be on the lookout for in the options market into tomorrow’s expiry.
Before I do, now seems like a good time to mention all the educational material on options we’ve been creating recently. It will prove very handy to some of these topics I'll touch on today. So if you haven’t already, go here to get options-pilled.
The various topics I want to briefly touch on are:
- This week’s spike in implied volatility
- The current call-selling squeeze
- The fire-sale on puts, just as risk becomes elevated
- ETH’s option squeeze potential (I’ll address this in the P.S.)
I’ll hit on each quickly, then expand on any details during tomorrow’s recording of The Trading Pit at 14:15 UTC, just before the New York trade session begins. Be sure to tune in.
Implied Volatility Spike
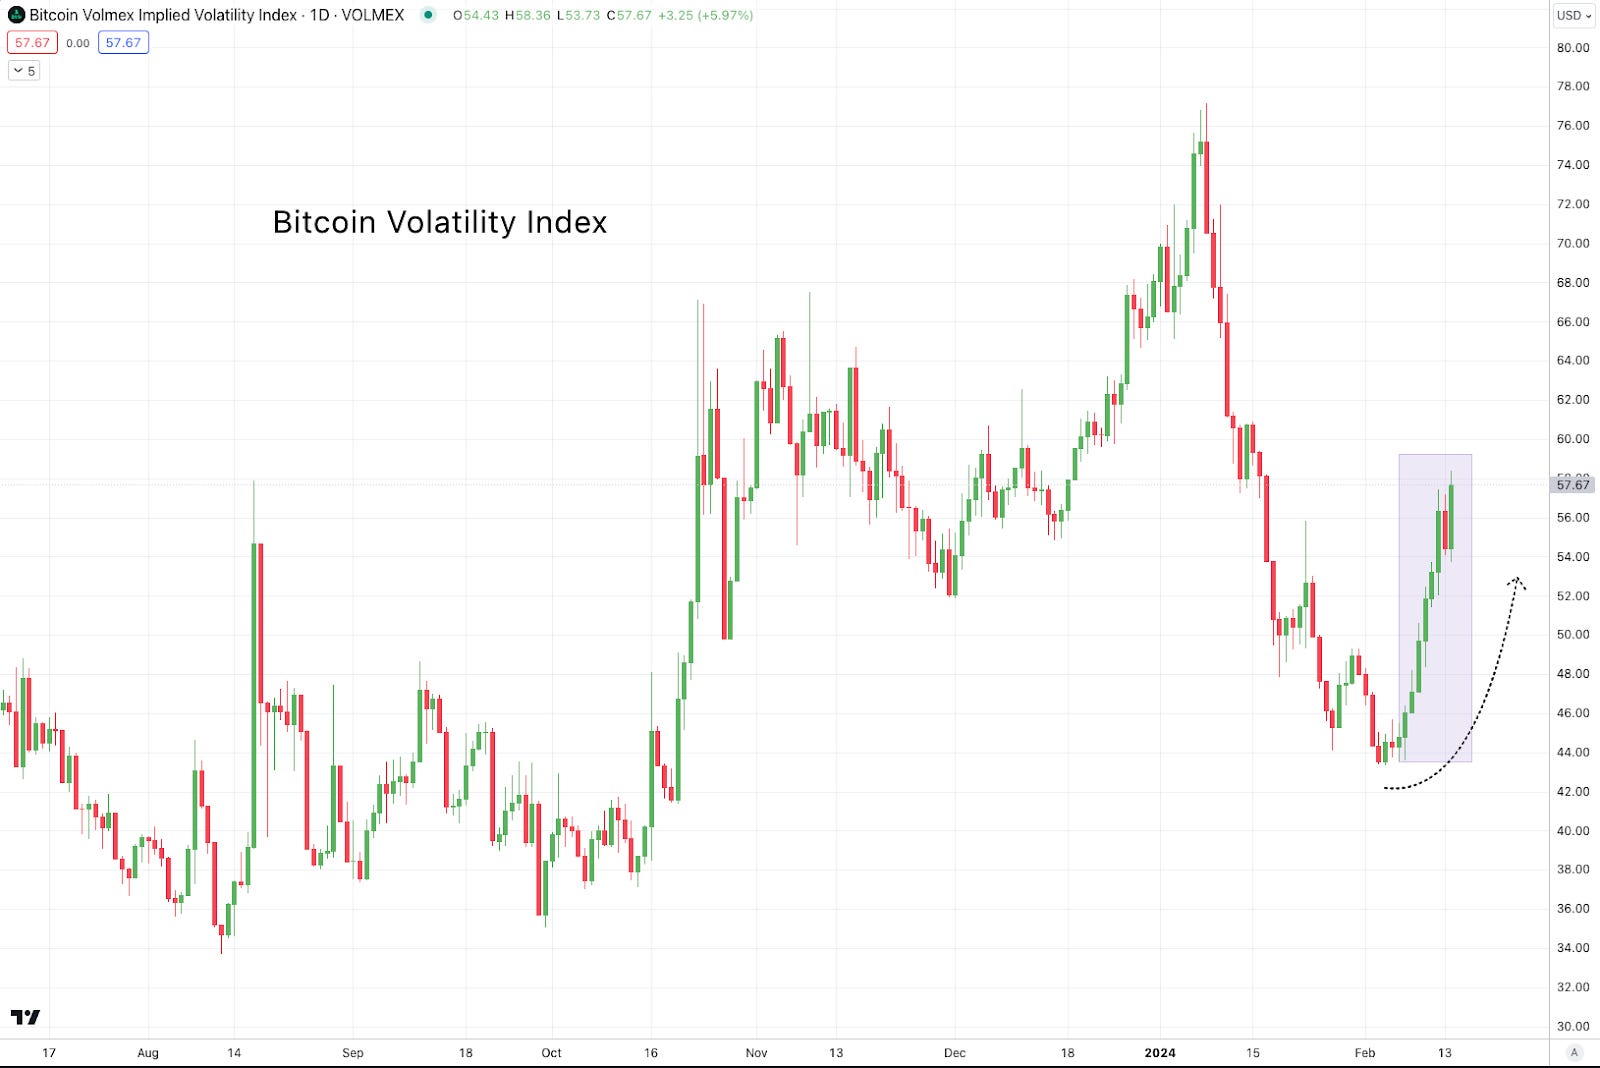
First up is the obvious - the long awaited spike in BTC and ETH implied volatility levels. For anybody who’s been following along with us we’ve been alluding to its arrival for the past two weeks. As we see below over the past seven days BVIV has shot up nearly 25% rising from a score of 43 to over 58 earlier today. BVIV is an index that measures the amount of premium in the form of IV being paid on Bitcoin options contracts.
EVIV is a similar index, it just measures IV for Ethereum’s options. It has outpaced and is now once again over a score of 60.
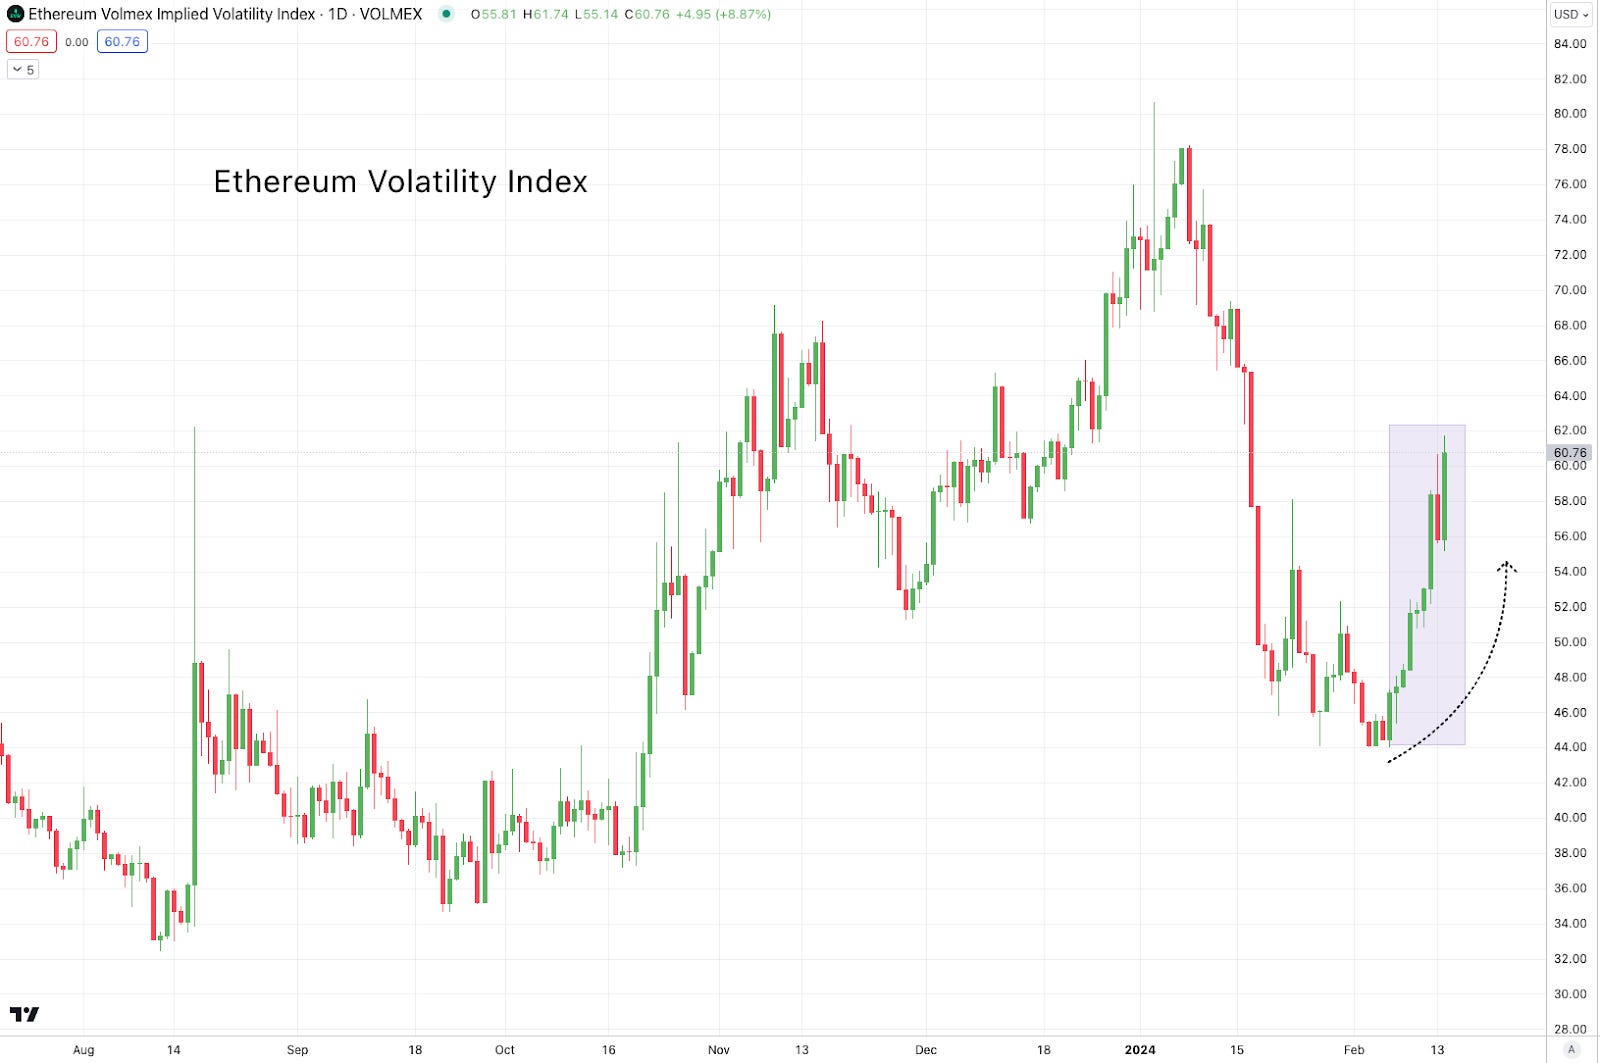
As we mentioned, boredom begets opportunity and good options don’t stay cheap for long.
This move in IV was once again accurately foreshadowed by the IV-term structure we pointed out last week in the update called “Curved Alpha”. The term structure had been on a steep incline in early February - something that alludes to opportunity the market will look to cash in on.
With this high velocity move afoot, the focus turns to the call sellers who were betting on volatility to remain compressed into the end of quarter one. They are now off-sides.
Call Sellers Getting Squeezed
As we see on the open interest chart from Deribit below, with Bitcoin above $51,000 there are now over 60,000 BTC worth of calls across all expirations that are “in-the-money”.
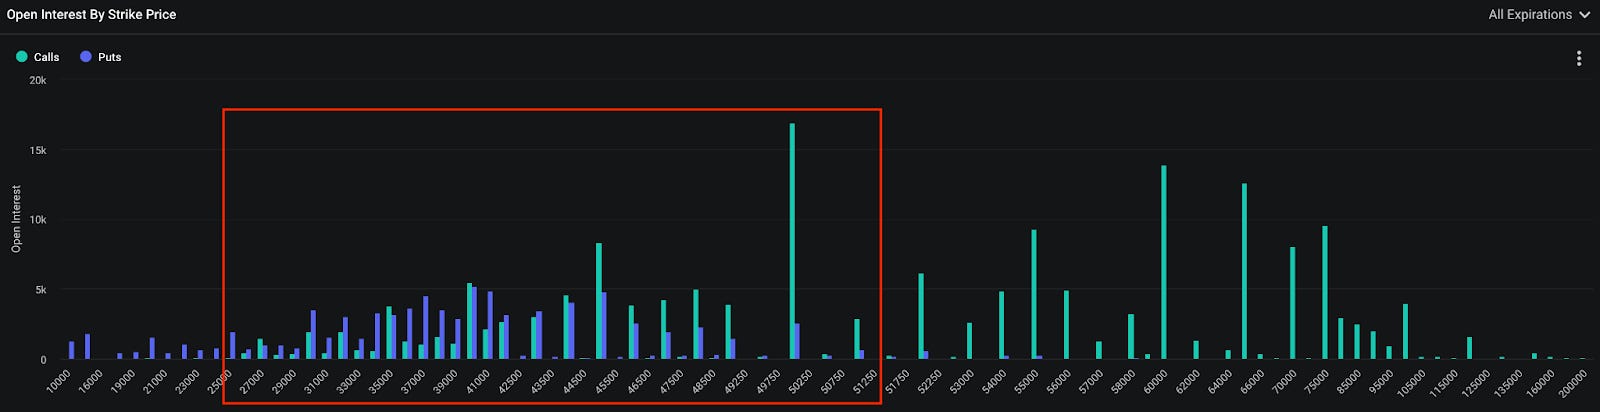
This means that if price continues to remain elevated above the crucial $50,000 mark, the sellers of these calls are liable for settling the cash difference between the low cost they sold the contracts for in prior months and their current value - which is not in their favor.
As we see on the chart as well, the higher Bitcoin’s price goes, the more potential there is for additional calls that are currently out-of-the-money to move into-the-money. This would only send this figure owed by call sellers higher.
The question now becomes: how well hedged were these call sellers, and do they have enough cash to cover the 60,000 BTC worth of calls sold, or will they have to buy the Bitcoin exposure they need on the open market which will only send the price higher?
That part of the equation is unknown, but it seems at present that potential bluffs from naked, or under-hedged sellers are being called by the market, and the potential reflexivity effect of this dynamic is too big to be ignored.
December 2020 anyone?
Whether or not these sellers were adequately hedged should become apparent within the next few days. That’s because the sellers must make a decision to either close their cash and carry positions or buy directly from the spot market to keep their positions opened. Either way, they essentially getting the tap on the shoulder.
In either case, more volatility seems likely from here.
In the event sellers need to close their cash and carry positions, this would mean forced selling. It could bring Bitcoin well below $50,000. In the event we see sellers needing to run to the spot market, $60,000 becomes possible.
Which brings me to the next point on something called skew.
Skewed Up Market
The term skew is similar to funding rates in the perpetual futures market. It basically tells us how offsides the market is getting in one direction or the other.
We measure this in options using something called skew. It takes the cost of a call vs the cost of put that is similar distance from the current price of the asset, and measures the difference.
Skew right now is showing us that after this week’s move above $50,000, the cost to buy puts dropped off. Which means the market is no longer clamoring for downside protection. This is why the skew chart below is falling to its lowest level since early November.
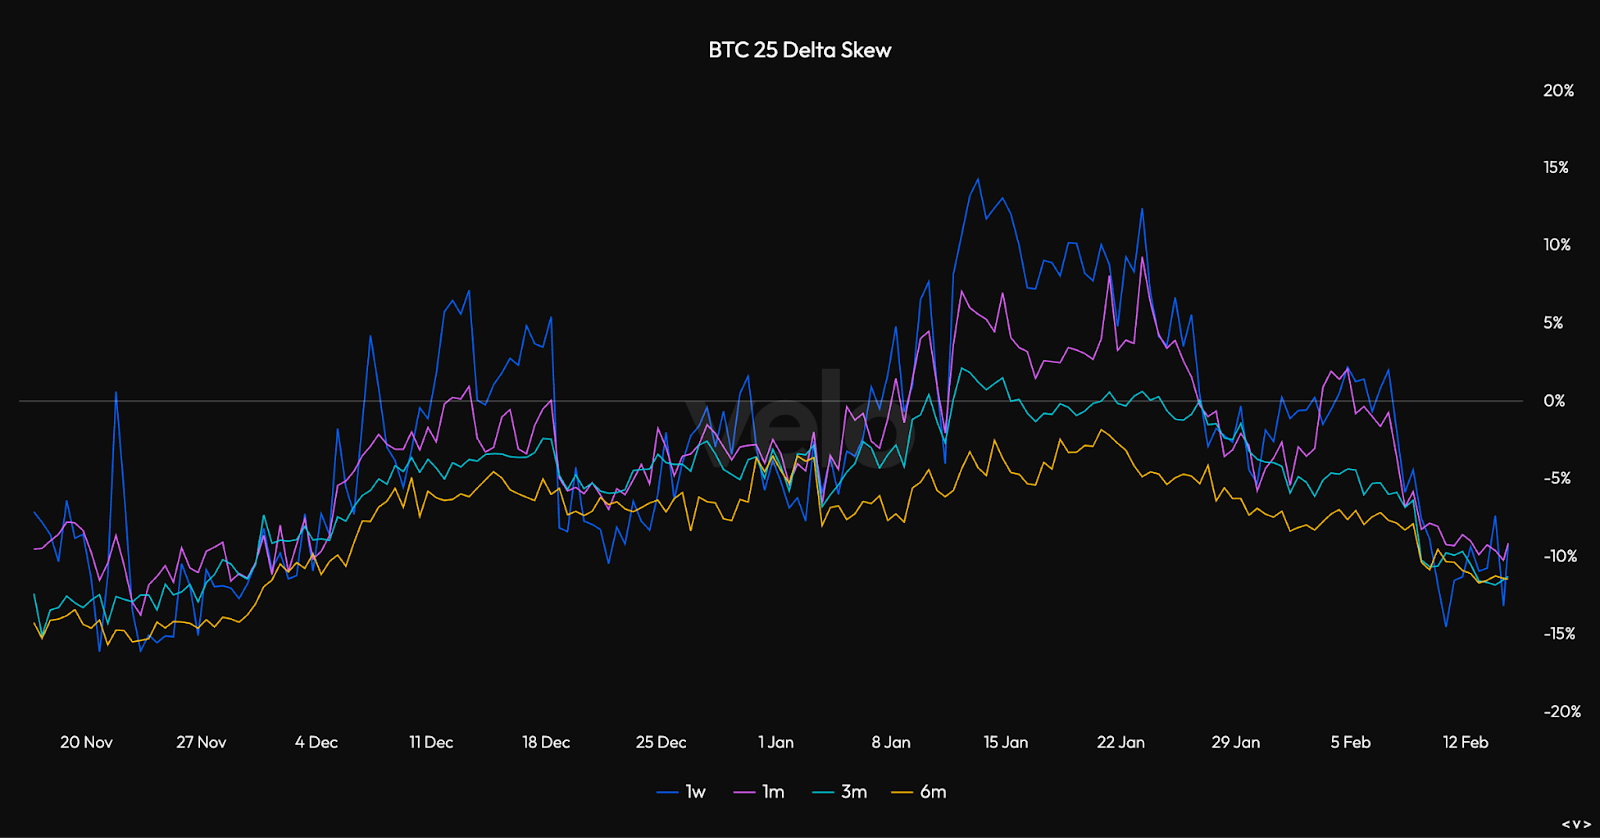
This seems to be potential mis-pricing, just as risk seems to be rising in the market. To state it plainly, downside protection has become relatively less expensive.
Until next time, enjoy the fireworks and I look forward to discussing these dynamics more in-depth on tomorrow’s livestream. It will air on this channel in case you want to set notifications for yourself.
Watching the tape,
JJ
P.S. : This net positioning chart from my friend @Gravity5ucks shows ETH call sellers find themselves in a similar bind to what I laid out earlier for BTC call sellers. As price keeps moving up and into their largest sold strikes (red lines), this will be forced to make similar decisions as I mentioned before for Bitcoin options sellers.
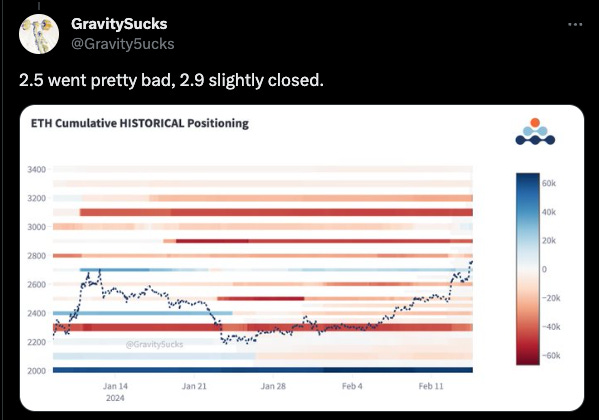
(Tweet: https://x.com/Gravity5ucks/status/1757802314847383843?s=20)


