Not As Steady As It Looks
The Gamma Setup


We combine on-chain data, technicals, and current market structure when assessing the market.
It’s not an easy task. Nor is it simple to explain. But it’s unique.
And much of our research is in finding better ways to gain clarity on what the current structure of the market is.
In this way, we can better decide what way the market is leaning.
The most current work we’re doing revolves around a measure in the options market called gamma. If this greek letter is foreign to you I recommend reading the post, “How a Market Maker Gets Rekt”. It explains what gamma is and how it can influence whether price is running in mud or has rocket boosters.
We tend to use it to gauge how volatile price can be at certain price ranges. If the gamma is very negative, then we expect rapid price action where it’s most negative. If positive, we look at gamma as a damper on price action - lower volatility.
When we pair up how fast price might move with support and resistances, we can start to gain a clearer outlook on the market.
Now for options, Deribit is the home to the most action in the market. So we reference their expirations and its open interest by default. Every Friday there are contracts expiring at 8:00 UTC. And its these expirations that we will start to focus in on.
With that bit of background, let’s see how gamma looks today.
Right now it’s set up for heightened volatility.
Here’s the current structure for bitcoin as of April 28 14:00 UTC.
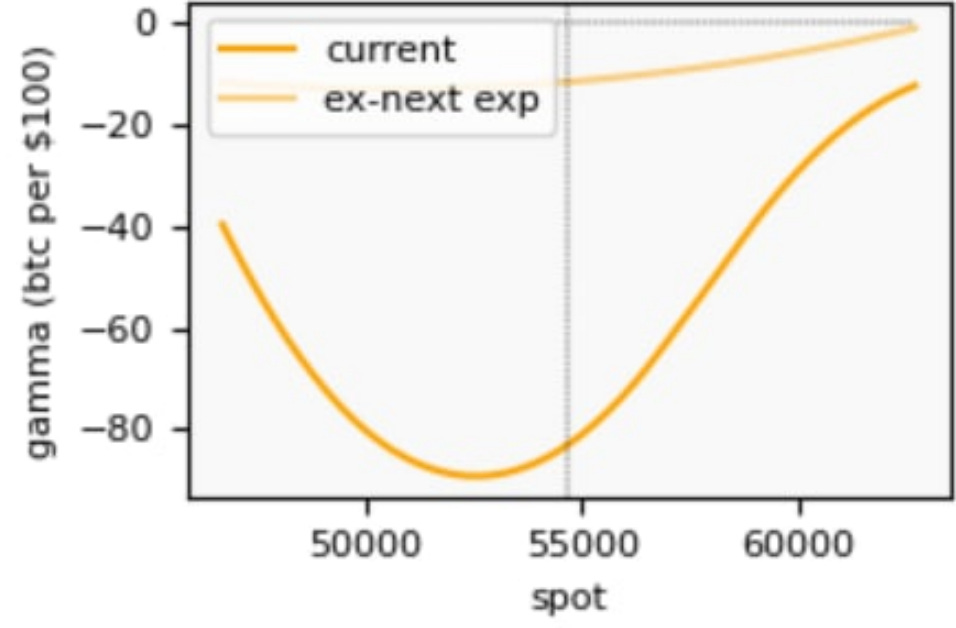
Right now the chart is telling us for every $100 move in bitcoin we are likely to see approximately 80 BTC traded in the direction the price is moving.
If price starts to drop, market makers that hedge their positions will sell approximately 80 BTC for every $100 drop. Similarly, for a price increase, same thing.
Now, the main thing to takeaway from this chart is if bitcoin starts to climb above $55k, the amount of hedging required is reduced. Thus, the impact gamma has on the market gets less and less.
Same thing happens if price begins to dip below $50k.
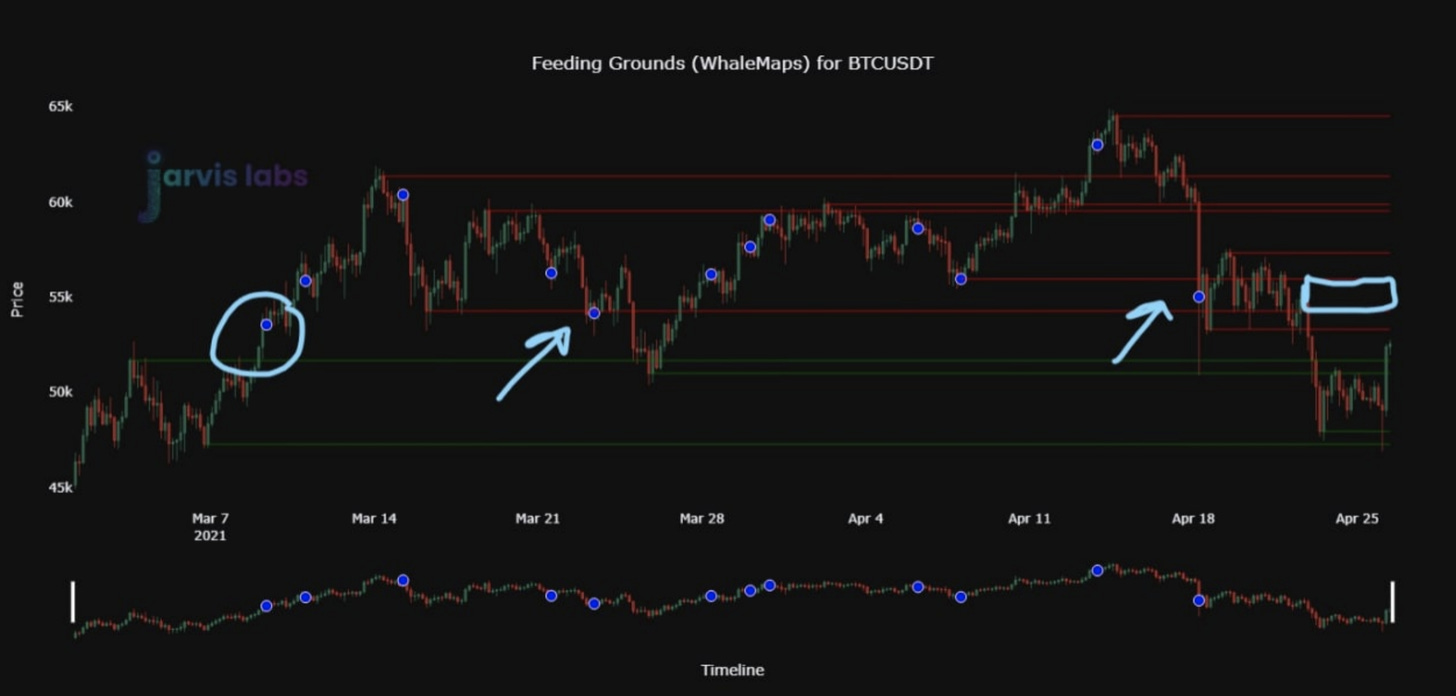
If we pair this up with the chart we shared yesterday about on-chain support / resistances, we begin to get a clearer picture of how the market is structured.
We have a strong resistance at $55k, and any strong rejection could create some fast price action to the downside.
This tells us we should be prepared in the event we get a rejection.
Further, in the gamma chart above you’ll note there’s a lighter shaded curve. After the options expire this Friday, that lighter colored curve will become the current gamma in the market.
Meaning this current structure is a true snapshot of how we’re going into tomorrow’s expiries.
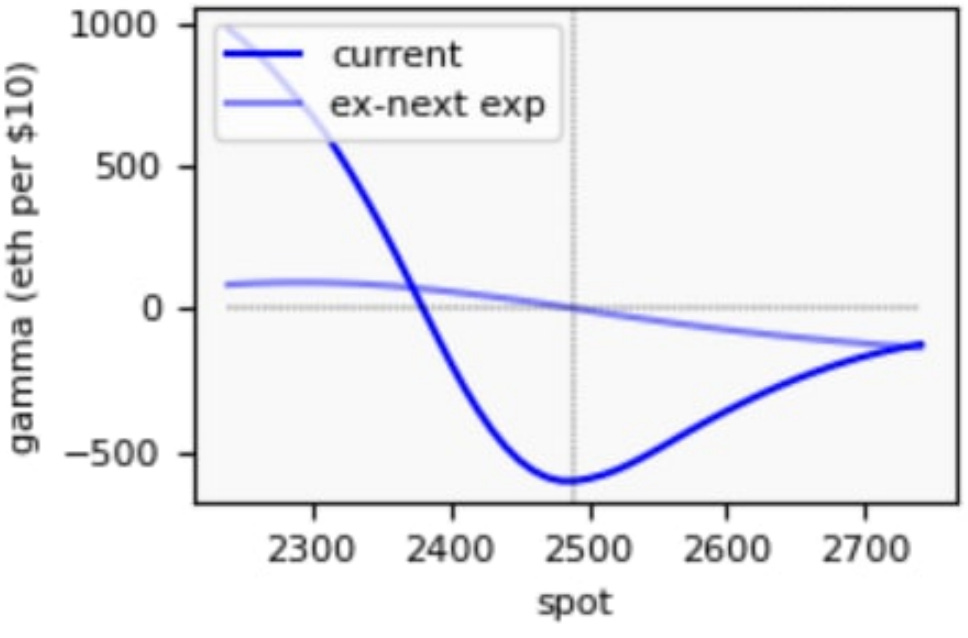
For Ethereum…
Here’s the gamma.
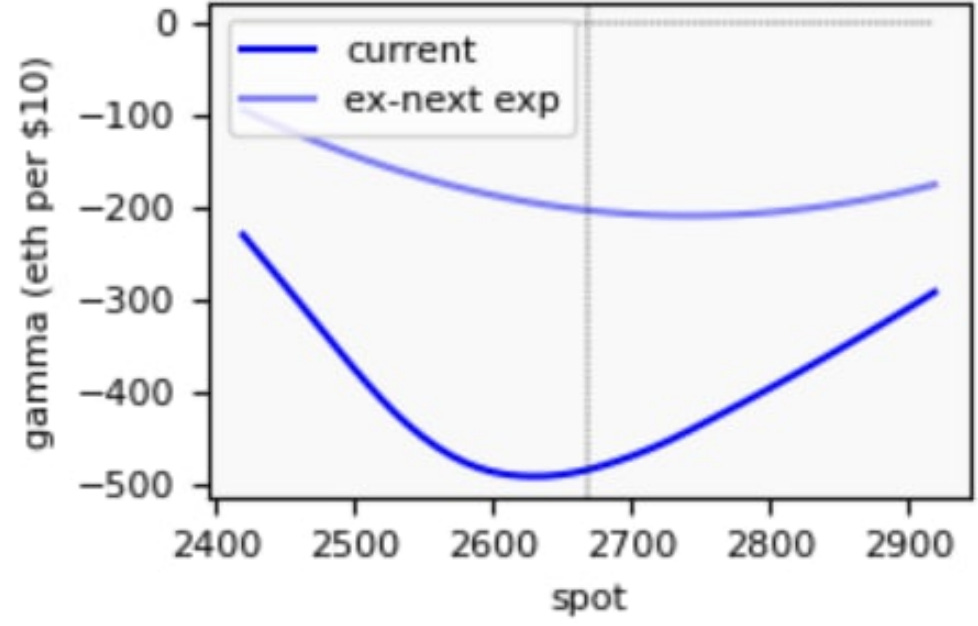
This is a similar setup. The important difference is the gamma setup after this Friday’s expiration.
Price action to the upside will have momentum. Right now there’s more momentum to the downside, similar to bitcoin. This reinforces how a rejection at $55k is likely to behave.
Now one interesting thing to note is how we’re witnessing gamma shift over time. It’s low point keeps getting shifted to higher price points.
To see what I mean, here’s the gamma chart from April 22.
A bit similar to how it looks today. We’re near the steepest part of the curve, and the momentum for price is to the upside.
This is something to keep an eye on as it might persist for some time, and perhaps its why Ethereum is seeing stronger moves to the upside than bitcoin.
One thing to note in the reading of negative gamma is it doesn’t predict price moves higher or lower. It only really signals to us how hedging activity is likely to impact price action.
And with both readings well into the negative (medium impact on price) the options market is creating more volatility on prices.
To sum it up… When we pair up gamma with the on-chain S/R chart, setting oneself up for a long fill at lower prices is a reasonable play.
Also, if netflows look strong after the expiration day passes and bitcoin’s price hurdles above $55-57k region, then that’s a good setup for higher prices… In particular ETH.
Your Pulse on Crypto,
B
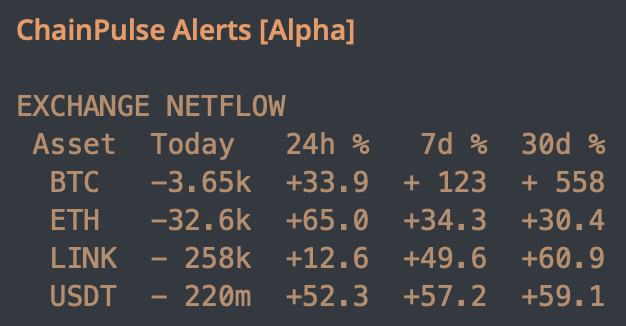
P.S. Here are netflows from yesterday. Note, I’m already seeing a steady amount of stablecoin outflows today. So keep that in mind as you read these figures.