How a Market Maker Gets Rekt
Guest Essay from @bit_hedge

Ignoring options is handicapping your trading.
It’s an area of the market that’s up 28x from one year ago and has realized a rate of growth that’s double what the futures market experienced over that same time horizon. Failure to pay attention to this growing influence in the market can be at a detriment to you.
So today, I want to bring you down the options rabbit hole to shine some light on a little known area within options called gamma and how it can influence daily price movements.
Be you start, be sure to make a second cup of coffee for today’s piece and grab your notepad because we’re about to pull some of you into unchartered waters.
By the end, we hope you understand why gamma is important to market structure and what it’s telling us today.
(For those who are already familiar with options and in particular gamma, skip ahead to “The Nitty Gritty of Gamma” section to learn what the market is saying today)
Understanding the Players
To better understand how Gamma can influence price, it’s important to establish two main players in the options market. They are the market maker and taker.
To say it plainly, the market maker is an entity who creates liquidity in the market.
When you open an order book and see bids and asks orders sitting there, these are traditionally referred to as market makers.
These players make their money from what’s referred to as the spread. Which is the difference between the bid and ask, which can be upwards of 5% on even the most actively traded contracts on the most active options market - Deribit. You can see for yourself below.
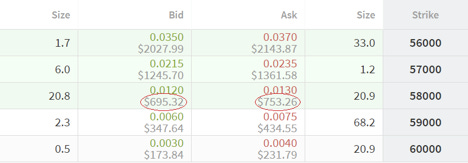
Source: Deribit
Now, if you go ahead and “take” what the market maker is offering, you essentially stomach that spread. This makes you the taker in the market (or purchaser), while the market maker is selling the option to you.
Where this gets interesting is in viewing the market maker’s situation if they look to lock in that 5% spread. Which means this particular market maker won’t be speculating on direction, but merely providing liquidity to the market.
In order to capture this premium this market maker hedges their exposure by doing the opposite trade in the futures or spot market. If they sold a call, they will likely go long a futures contract with a similar expiration or buy BTC on spot. If they sold a put, they will do the opposite.
This let’s them be what’s called delta neutral. Which is to say loosely, a $1 move up or down in the asset price results in a $0 change in the position’s PnL. This lets the market maker capture the 5% spread in the options market (minus the cost incurred in the futures or spot market) without needing price to move.
Their service is welcomed by all. Unfortunately for market makers, it’s really not as easy as I laid out here.
When price begins to move in one direction or the other, the delta effectively changes. And as the delta changes, market makers need to adjust their portfolio accordingly.
Here’s what I mean…
In the picture below is the options order book. I removed everything besides delta and strike prices, otherwise there’s too much going on.
At the time of this photo bitcoin is trading slightly below $61k on Deribit.
Now if you were a market maker who sold April 14, 2021 call options contracts with a strike of $52k when bitcoin was trading near $52k, the delta was likely near 0.50. However, it’s now 1.00.
This means the trader who purchased that call option now makes $1.00 for every $1.00 move higher on bitcoin, while the market maker loses $1.00 for every $1.00 move higher. Recall, the market maker at first hedged at 0.50… But now needs to be hedged at a delta of 1.00.
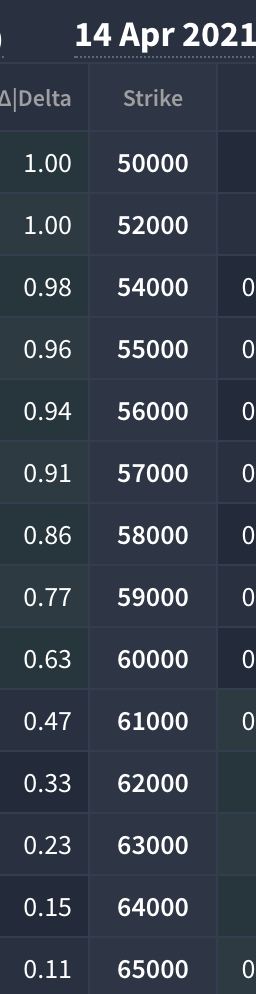
Source: Deribit
As you can see, being a market maker requires constant portfolio management. It’s not easy, and what makes it even more challenging is something we call Gamma… Which is... the rate of change of delta. Huh?
I know, for anybody new to options this might feel a bit dense. But I assure you, it’s a topic that you need to really wrap both hands around and understand.
Let me explain…
Let’s take another look at the picture above. Notice how the delta for strikes greater than $61k quickly drop to 0.11 whereas strikes less than $61k (“in the money” aka profitable contracts) quickly approach 1.0 delta.
This quickness is gamma. It’s non-linear, which means delta doesn’t change at the same amount for each strike or options contract.
To help explain what this looks like, we can visualize both Delta and Gamma by plotting it on a chart. You can see it below.
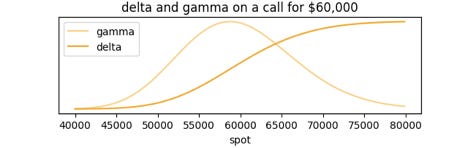
Source: @bit_hedge
The bell shape is gamma. It rises and falls around the strike price, which is to say the changing of delta is greatest around the strike.
And to really make things complicated, let’s pile on to this talk about gamma by throwing a curve ball in saying this curve is never stagnant. It changes shape as price moves up and down, and even as the option contract gets closer to expiration.
It’s an ever moving situation that can be extremely difficult to track without the aid of a tool we’ll introduce later on.
But remember, the reason we care so much about gamma is that it can really take market makers to the cleaners. Because if lots of options buyers are purchasing contracts at $80k or $100k, and market makers are selling those contracts, then the delta that market makers are hedging against is fairly low.
And if there’s a lot of contracts at a price level like $80 or $100k, and the expiration date is drawing near, then this gamma effect creates a bit of a feedback loop.
Here’s a very surface level walk through… Let’s say the market maker sold a call option...
Price begins to get closer to a sold call options contract that at first had a low delta… As price approaches the delta begins to rise faster and faster… Market makers are forced to respond by hedging their positions at a faster and faster rate by purchasing BTC on spot or going long in the futures market - which acts as buying pressure on the asset... Which only escalates the situation even further… And BAM price shoots like lava out of a volcanic explosion.
It’s the gamma squeeze. And we saw it unfold right around the time we placed 2020 in the “do not open” box of memories.
Gamma is a very important topic to consider in options, and we look to start covering it a bit more in the pages of Espresso. That’s because in the next leg of the rally we want to be aware of this type of potential in the market at any given time since it can help form expectations of price movements.
So let’s not waste any time and start diving into today’s gamma analysis. To do so, I want to introduce @Bit_hedge. He’s an expert at modeling gamma in the options market and understanding how it can impact price. So I’ll at this point I’ll leave the rest to him...
The Nitty Gritty of Gamma
OK, to reiterate a little of what Ben mentioned, we can view delta as the amount market makers need to own to stay hedged - while gamma is the rate at which they need to adjust that hedge.
With this understanding, we can estimate market maker positioning and calculate the gamma for every strike and expiry across the board.
Which means in turn, we can model how much bitcoin market makers will have to buy or sell at different prices to remain delta neutral.
Whether gamma is positive or negative tells us if market makers will be trading with or against price action.
In a positive gamma environment, market makers are long gamma and have to trade against the price to remain hedged - less chasing or squeezing.
In a negative gamma environment, market makers are short gamma and have to trade with the price to remain hedged - more potential for squeezing in either direction. If price rises, they look to go long to hedge. While if price goes down, they look to short in order to hedge.
Here’s what this dynamic looks like in stocks...
Below is a chart showing the one day percent changes in the S&P 500 vs. the market’s gamma position as measured at close of the previous day.
On the right half of the chart where gamma is positive, one day changes are more concentrated around zero. This means on average positive gamma creates less volatility in the near term.
When the market is in negative gamma, we see returns are more scattered. This means in general there is higher volatility when the market is in negative gamma.
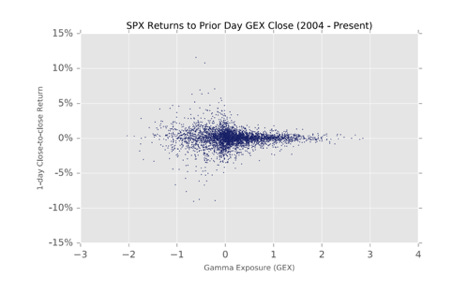
Source: https://squeezemetrics.com/monitor/docs#gex
This supports what we’ve mentioned which is: when gamma is positive, market makers are trading against price direction, therefore reducing volatility as they are likely adding liquidity into the market, regardless of where the strike price.
When gamma is negative, market makers are trading with price direction. This can lead to higher volatility as market makers are likely removing liquidity from the market.
In equities, this is a well documented relationship. But in crypto, there are only a few shops doing it … So let’s uncover some alpha by checking out what the options market is saying bitcoin today
Current Model
Below is a bar chart showing the current gamma setup for bitcoin as we see it.
The height of each bar is the amount of bitcoin to be purchased or sold for every $100 change in price, broken down by various strike prices. From just the $80k strike for example, we can see an estimated just under 20BTC needs to be sold for every $100 move higher in BTC. We know this because the $80k strike has positive gamma, meaning market makers are hedging in opposition to price direction.
As for the shading, each bar reflects something we call “dormant gamma”. Which is to say the effect gamma at this strike can have on price is stronger than that with a bar of a lighter color.
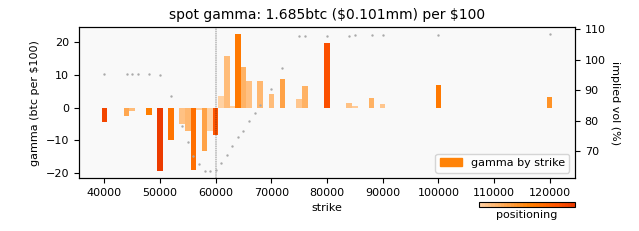
Source: @bit_hedge
Right now we’re seeing the $80k and $50k strike prices having the potential to impact price movements more than anywhere else as they’re the darkest strikes on the board.
So said differently, the bigger and more red a strike is, the more we need to pay attention to that particular area as price moves towards or away from it.
Now, that seems great and all, but you’re probably asking what this means going forward?
It means as price approaches this $80k strike, market makers will be increasingly selling BTC. They will be adding liquidity into the market and reducing volatility. Which means if price keeps climbing, massive one day rips higher are becoming less likely.
It also means the chances for a gamma squeeze right now are low as well.
But of course, the market is fluid and positioning changes from day to day. If traders begin to pile into the options market and start buying up call options left and right with strikes near $80k, then this dynamic can flip quickly.
If this happens, then the potential for a gamma squeeze can increase as FOMO materializes. For now, market maker positioning should encourage a steady climb in price for bitcoin as it moves higher.
Conversely, if price dips… the negative gamma shown in the bar graph above will become more important as puts near 50k move closer to at-the-money. Meaning market makers are forced to sell more BTC as price drops. This is where the potential of a feedback loop comes into play - as price moves lower, market makers are forced to sell more and more BTC, pushing the price lower themselves, and having to sell even more .
Once we break out of this current trading range we can expect the current structure to begin to take a new form. It’s in large part why the spot market is currently the main driver of the market.
Trade carefully,
P.S. - This is me, Ben Lilly, be sure to follow @bit_hedge on twitter for the latest graphs and models. We will introduce more of his stuff in the following weeks as we look to make these insights a regular piece to our analysis. Take care! As always thanks for reading and please take a moment to share this post with your friends.


