Look at the Demand, Not Supply
An Ugly Market Update


As a kid I loved the morning after a blizzard.
Not because school was canceled. Instead, what I found most delightful was the utter stillness that blanketed the land in the morning.
Stepping outside and drawing in that first breath would waken my entire body. My senses would peak to where my cheeks would notice any subtle changes in the air.
I feel most alive in these moments.
Which makes me realize that if I had to describe the exact opposite of this…
It’d be the current crypto market.
To paraphrase Benjamin from our May 17th issue, “When Does it End”… it’s a shit storm out there. At the time, price was around $45k and we were getting ready for another nuke lower.
Since then the markets have only gotten worse. When you look out into crypto land it’s ugly.
No matter what statistic or metric you look at you’ll be left feeling dead inside.
So let’s pile on to the negatively and look at one of the few bullish charts out there. One that takes into account hashrate and price. Hashrate is a back of the envelope way to determine how much mining power is directed towards mining bitcoin blocks.
The China ban of late, which has turned into the government aggressively shutting down mining operations, is playing a part on this metric.
Now, something to consider is prior to the shutdown I’ve seen stats indicating a third to nearly two-thirds of mining power originates from China. So mining stats dropping so severely shouldn’t be a surprise here.
It’s in part why the Puell Multiple is dipping so hard.
Check out the equation below. Notice the numerator in the equation, “Daily Coin Issuance”. This is the amount of coins minted for the day multiplied by the market price of those coins.
The fact is the hashrate has gone down so much that the amount of time it takes to mine the next bitcoin block takes about twice as long today (24.8 minutes).
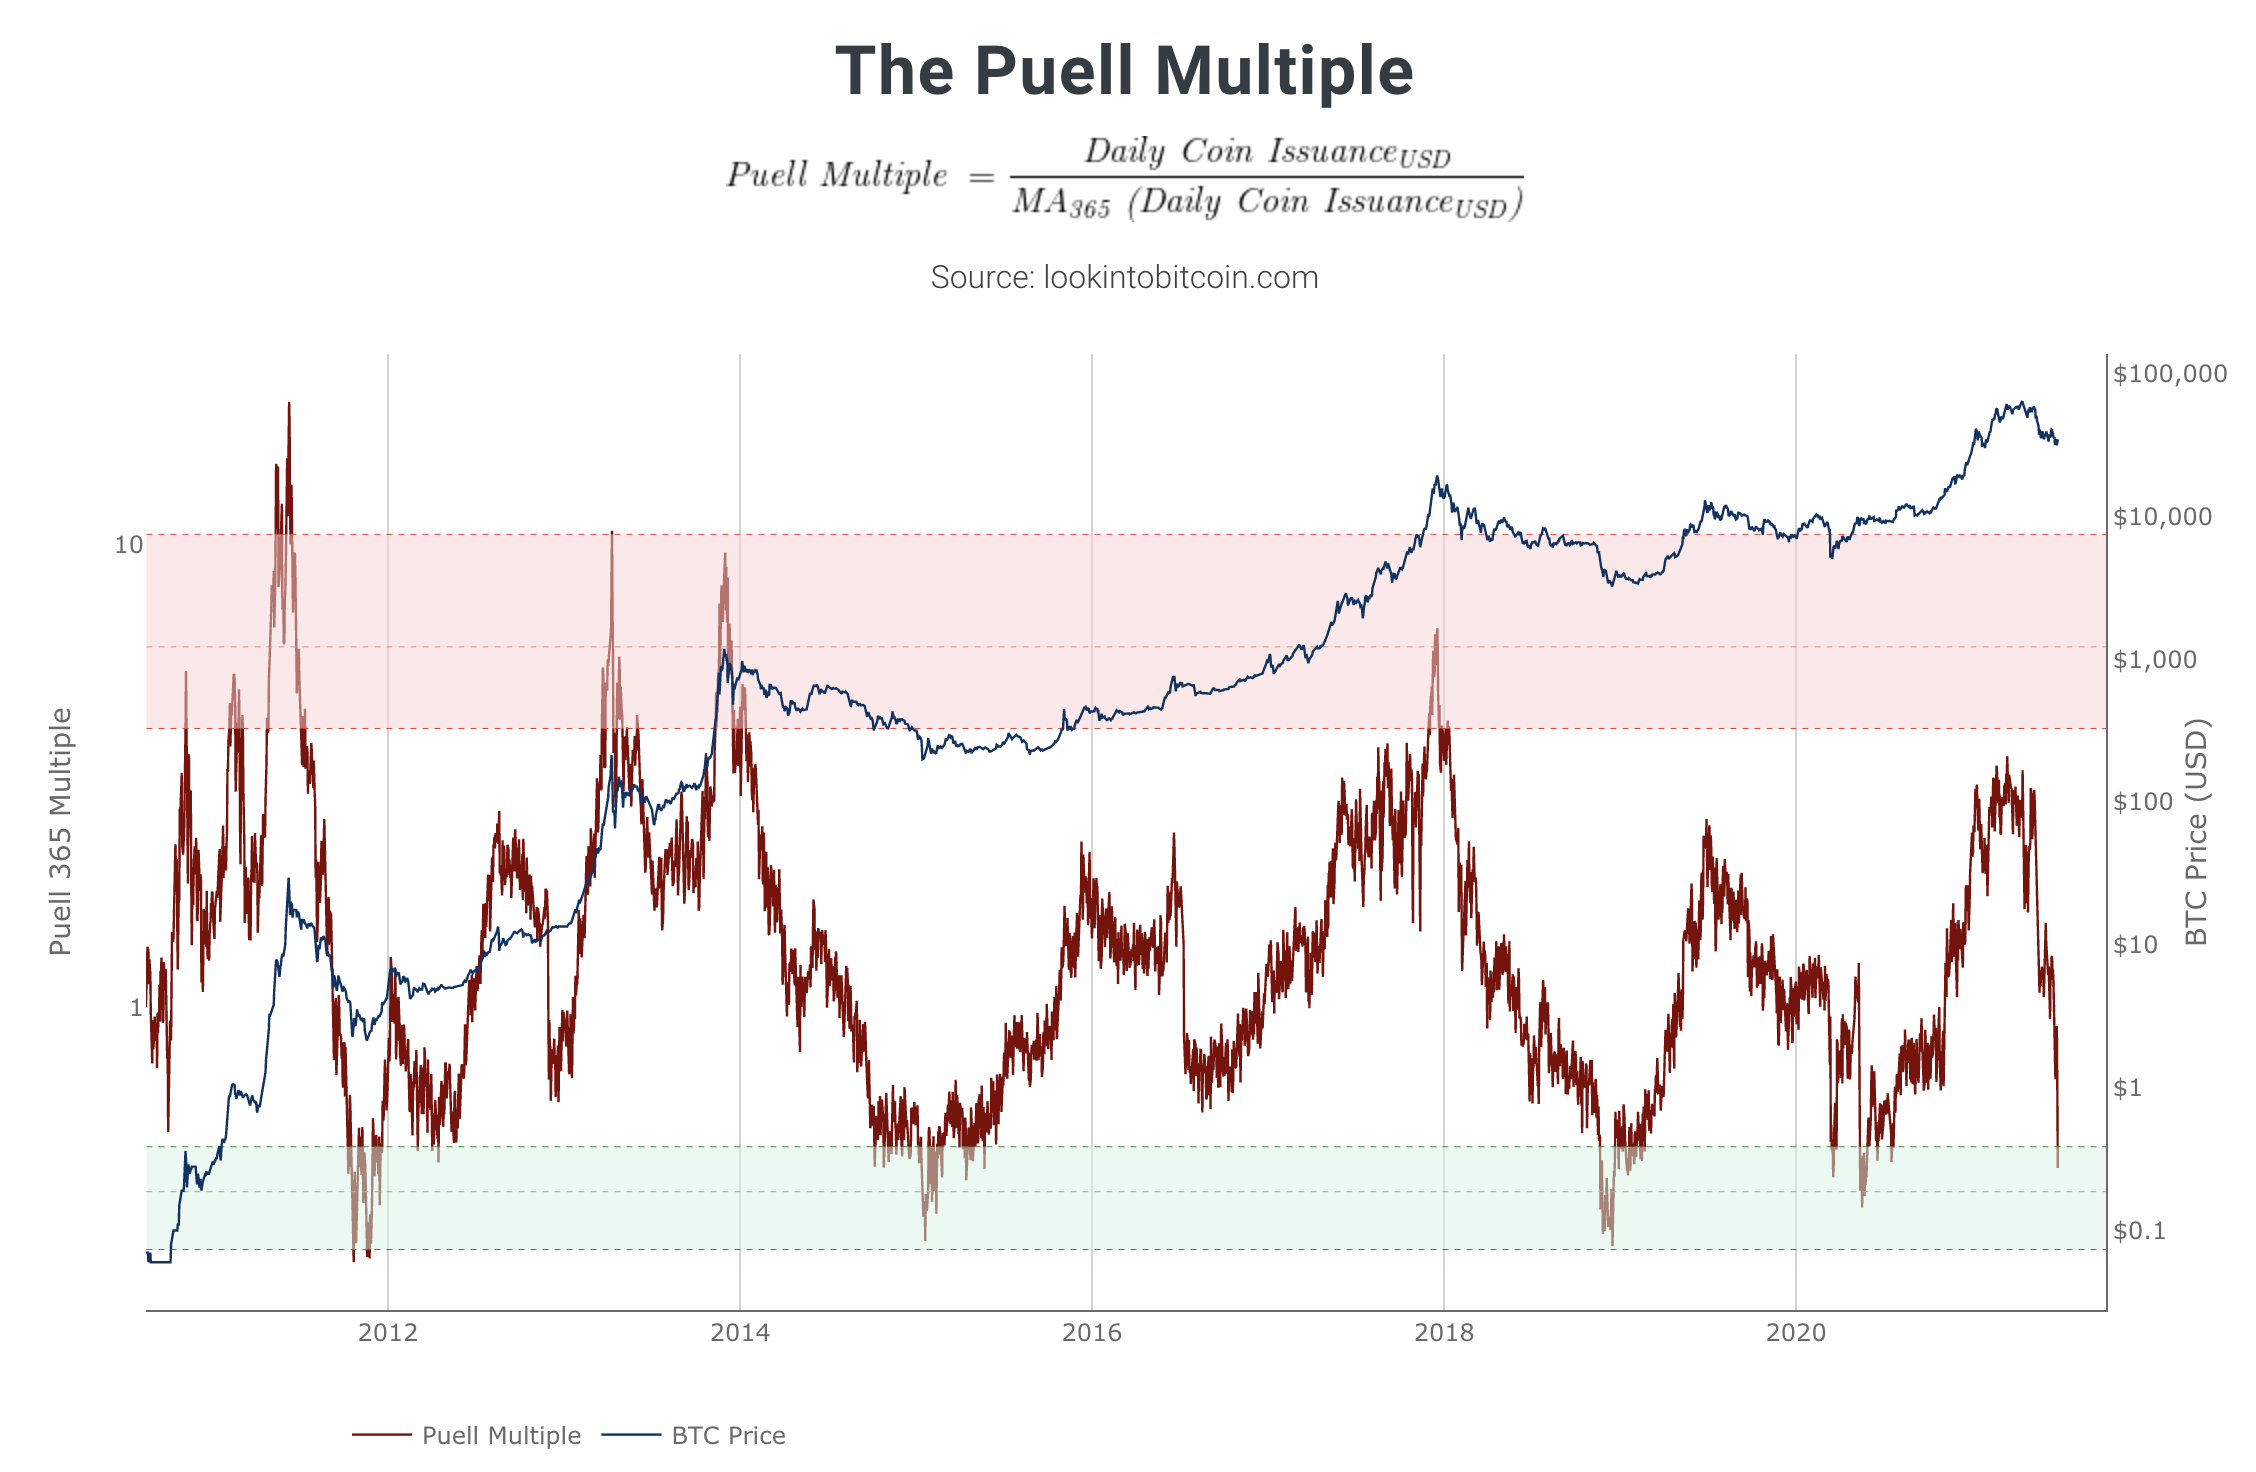
So when price was $65k and 900 bitcoin were mined per day on average, this numerator came out to be about $58.5 million.
Then when price got chopped by about half to $30k AND the amount of bitcoin mined per day are cut in half, the numerator dropped by 77% to less than $14 million.
This is why the Puell Multiple is flashing a buy today as it re-enters the green band in the chart above.
But we need to ask ourselves… Is it really telling us it’s a buy?
I think in situations similar to this it’s important to consider why certain metrics are making such drastic moves in light of the one-off mining exodus in China.
After all, this is a one-off event. Meaning most of this mining power will return, and before you know it MORE than 900 coins per day will be mined since the hashrate will hit the network likely after the difficulty of each block decreases.
Therefore, more coins get mined as the hashrate returns.
But wait… more than 900 coins per day… But if more coins are being minted, shouldn’t that be bearish?
Which begs the question… Why would less coins entering supply be bearish based on supply. After all, isn’t the halving a bullish event? And didn’t we just encounter a supply shock?
And why would more miners returning be bullish (outside of fundamentals like network strength that play out over months, not days)?
To show you what I mean, here’s the new coins entering tracked miner wallets by ByteTree over the last week.
A week ago the miners generated 5,000 BTC over the last week. Right now the rolling figure is 4,000 BTC and continuing to drop.
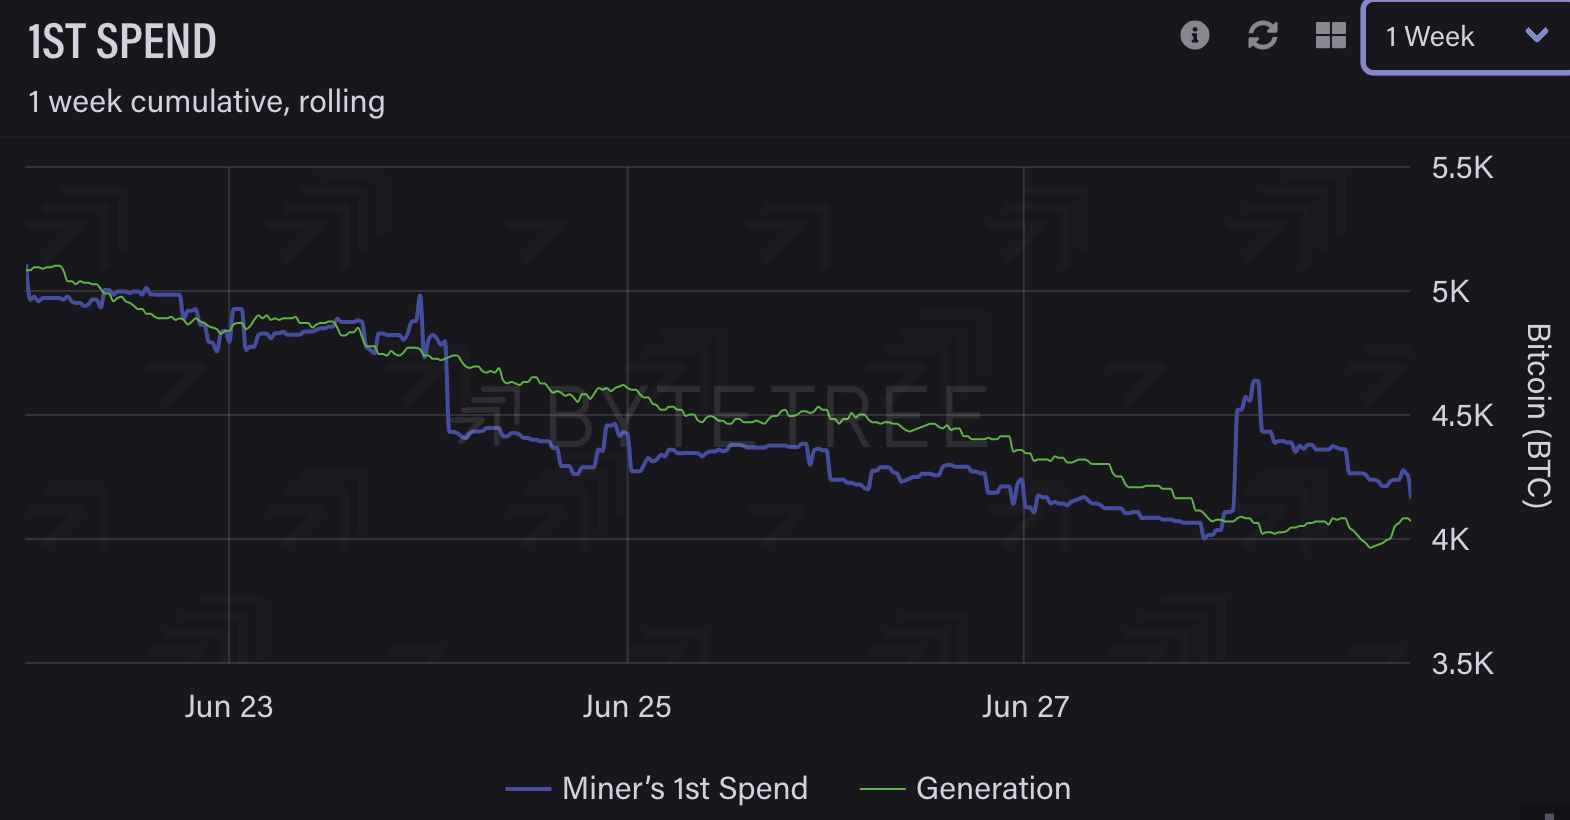
There we see new supply entering circulation dropping. Which tells us miners aren’t influencing price right now.
My opinion on the matter is simply that price is being dictated more so by demand. And since this China ban is a one-off event we need to take many metrics tied to miners with a grain of salt for now.
Instead, let’s take a look at how much network demand is happening.
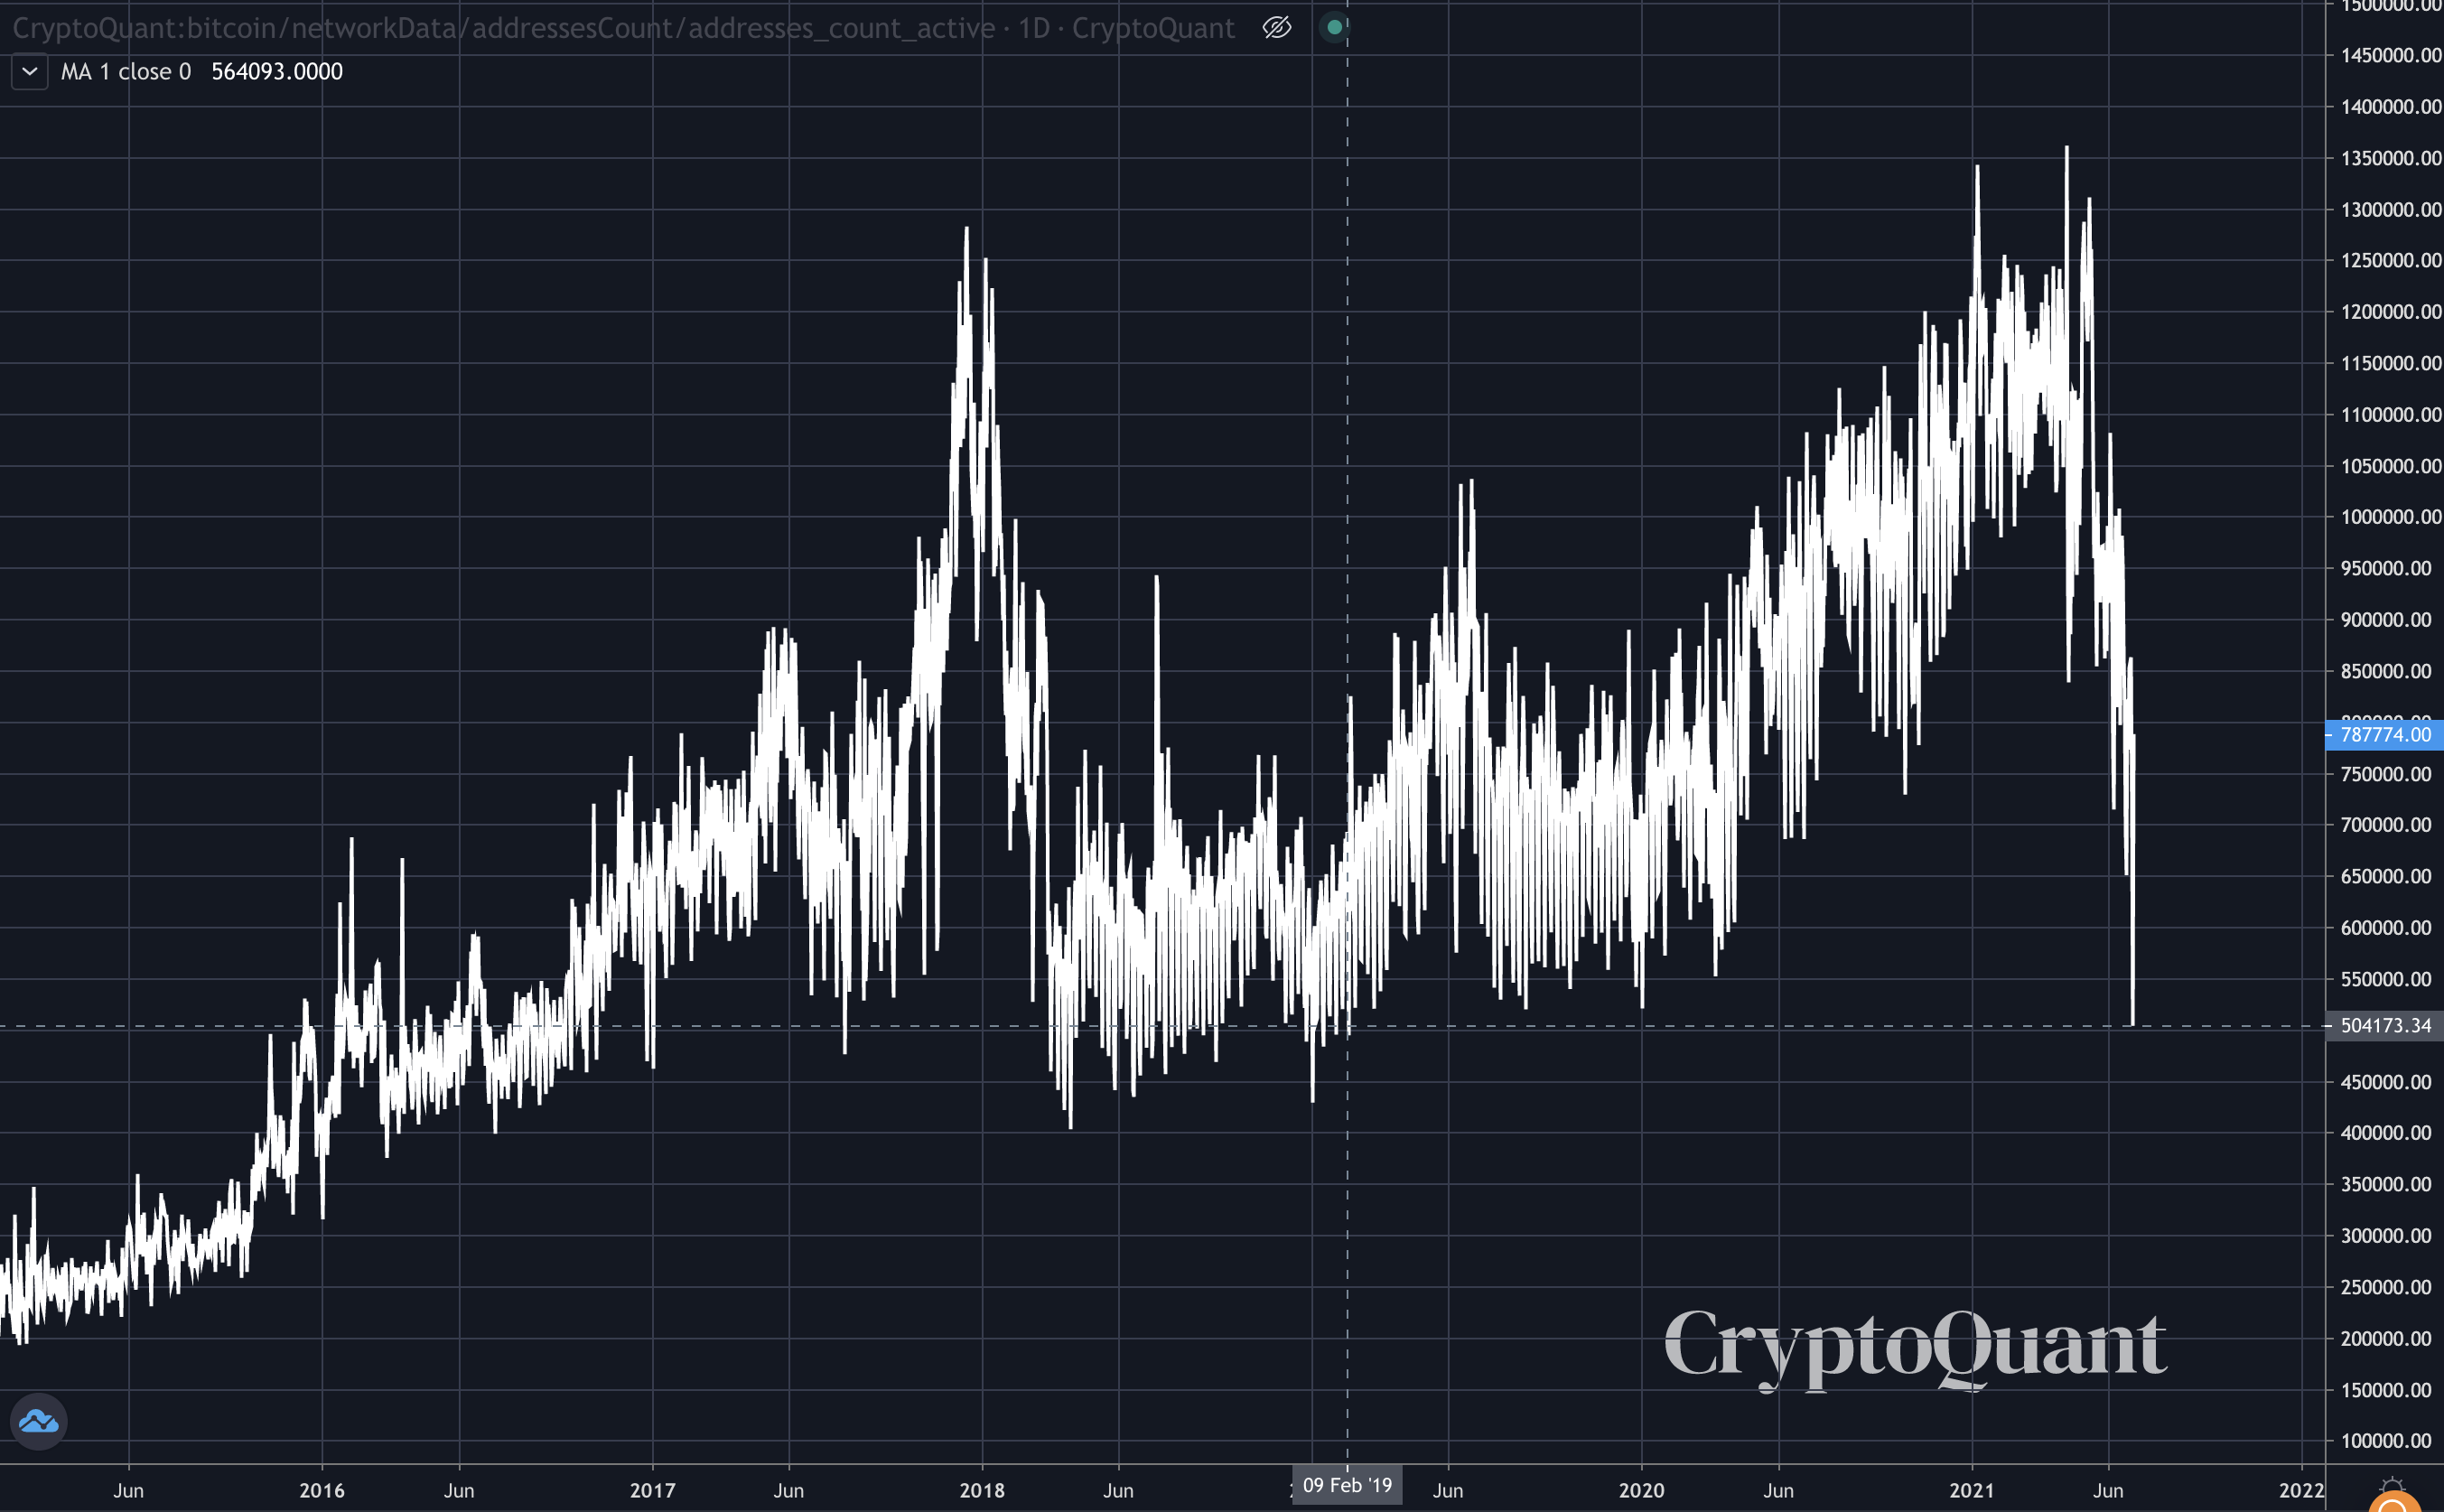
Here’s active addresses, which is a measurement that can serve as a proxy for how many users are active on the network.
Last time we were at these levels was February 2019, which was on the heels of price dropping from $6,400 to sub $4k two months or so prior. It a time period known as Crypto Winter… Very low demand.
Total transactions happening on the bitcoin network… Last time we were this low the ball just dropped to usher in 2016. And two years before the next price mania unfolded.
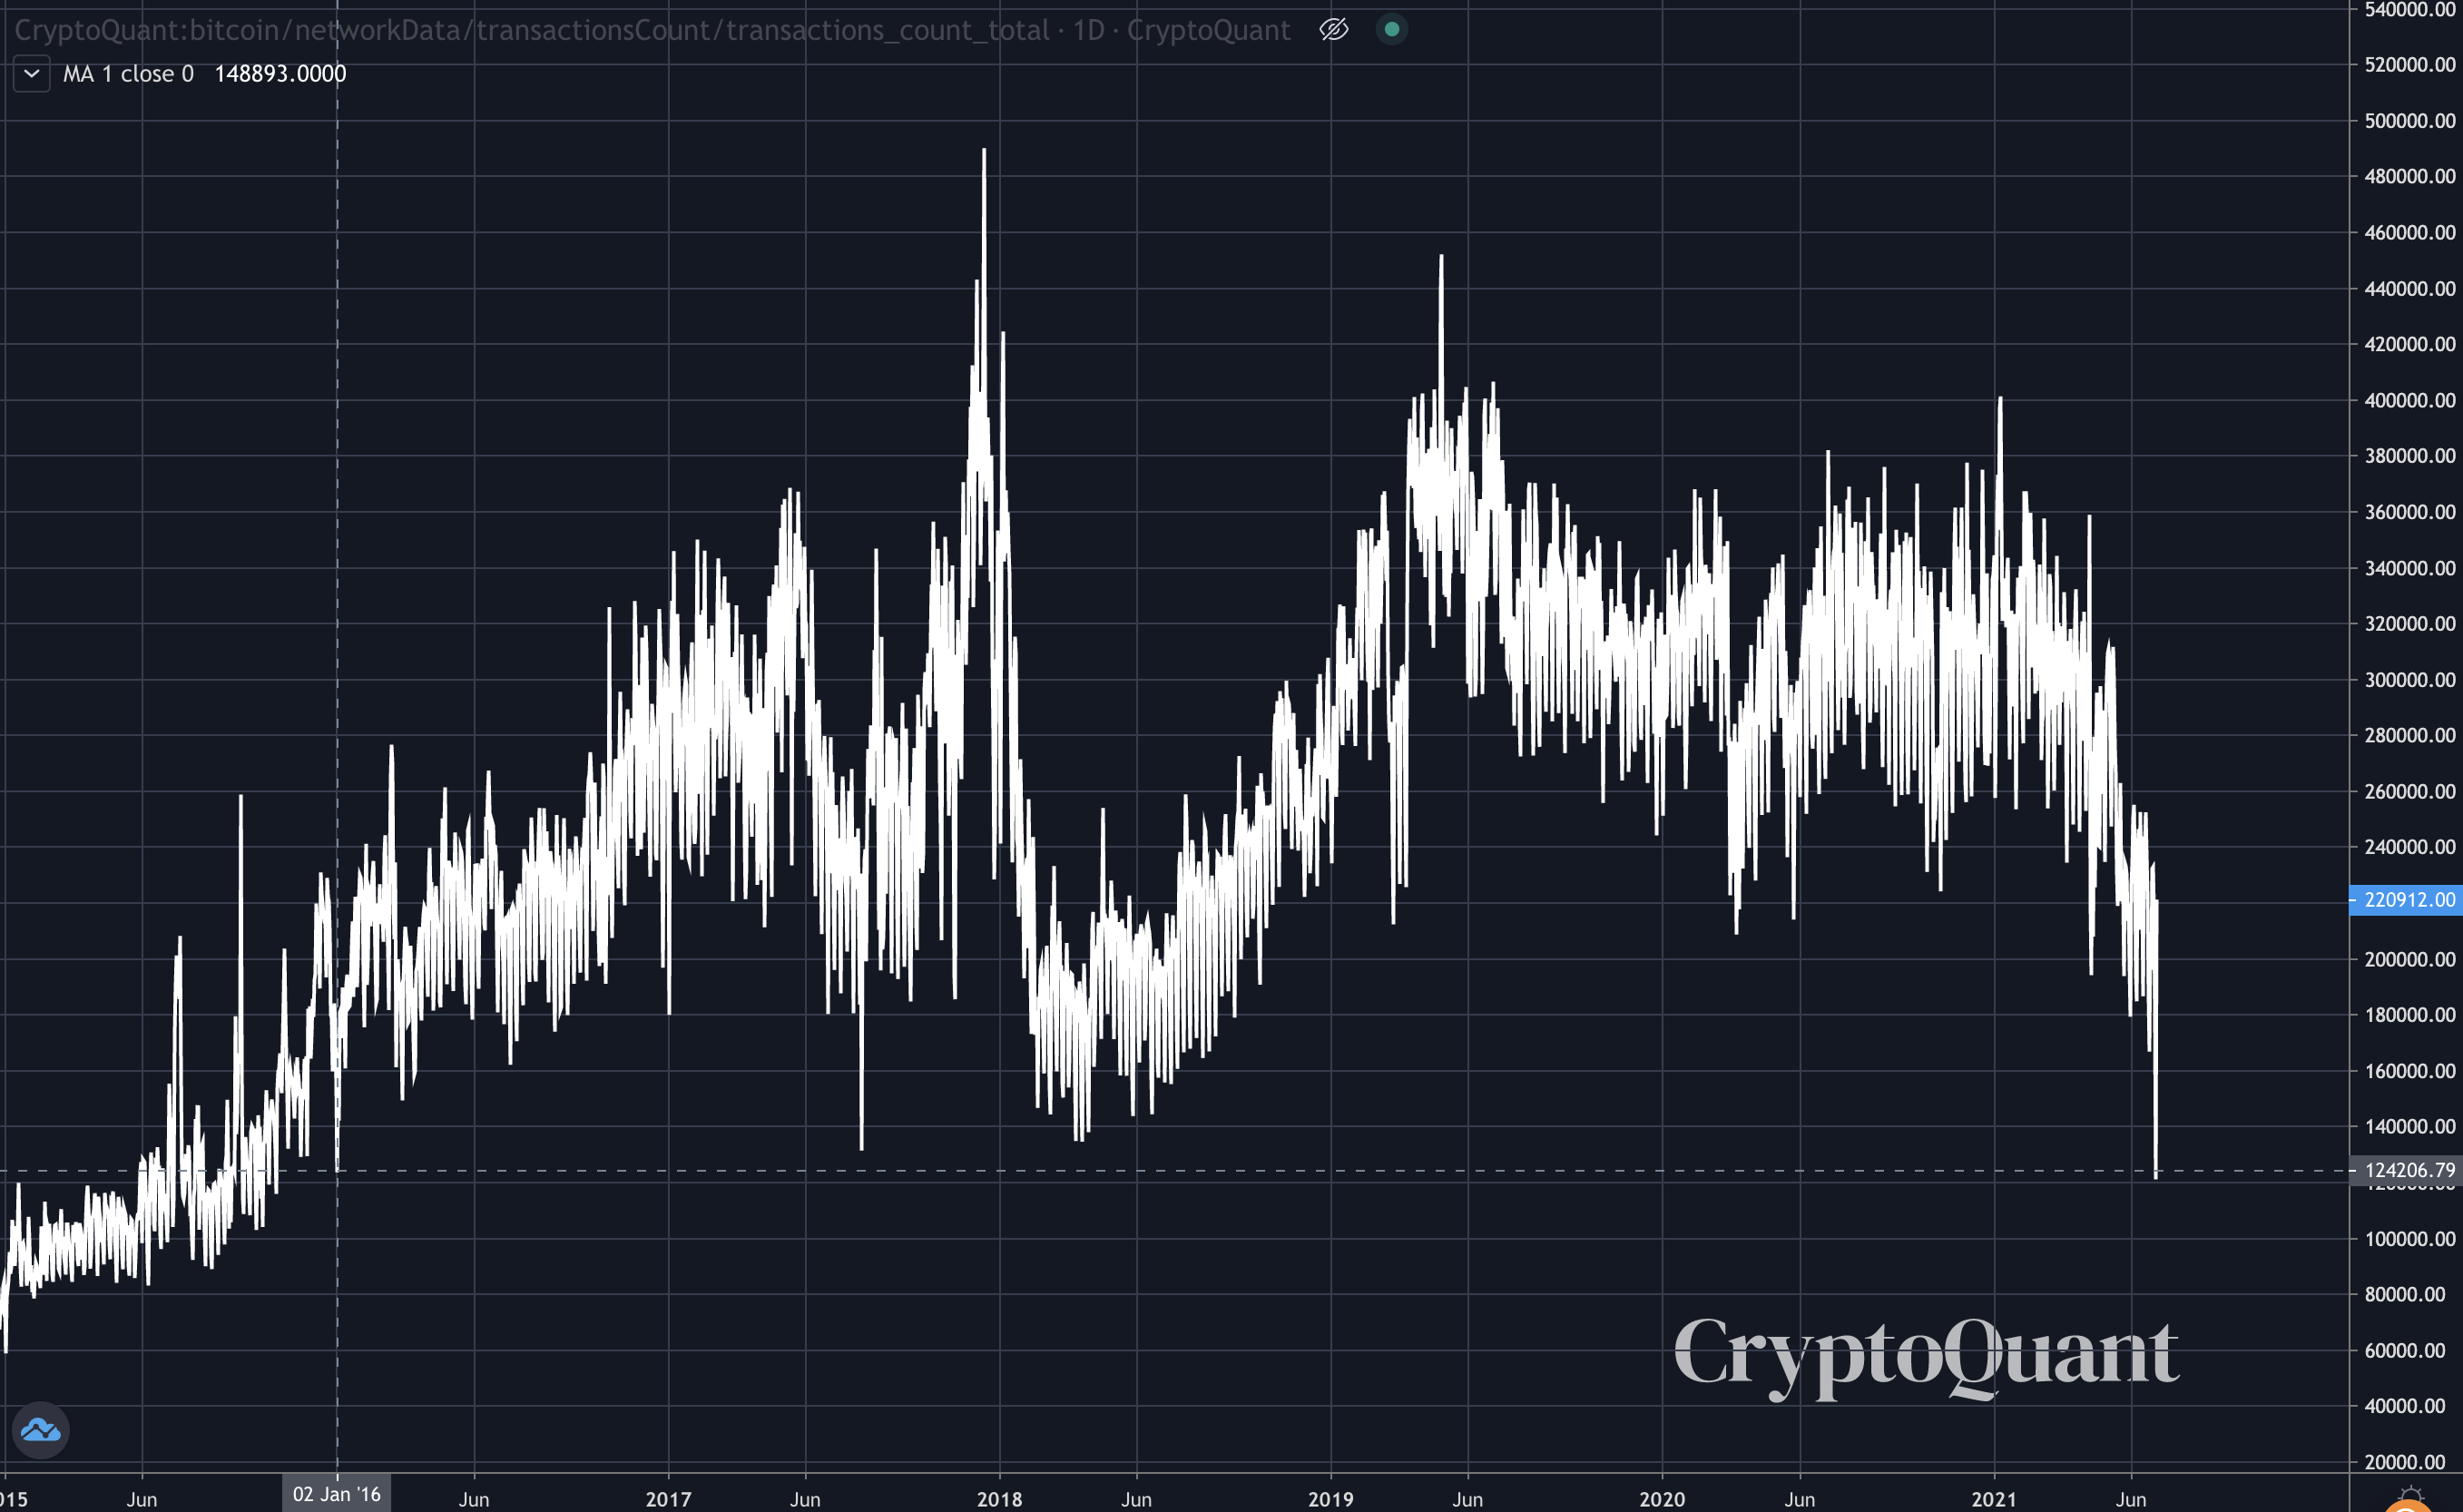
There is just shit everywhere you look.
We even notice this lack of demand in terms of our subscribers and users. There is less messages from our clients when price jumps, open rates on Espresso are between 32-35% right now as opposed to the 40-45% we typically see, and new subscribers joining are down a ton.
Here’s a chart of subscriber growth over the last 90 days. Literally plateauing. And no, this is not a log chart (we wish).
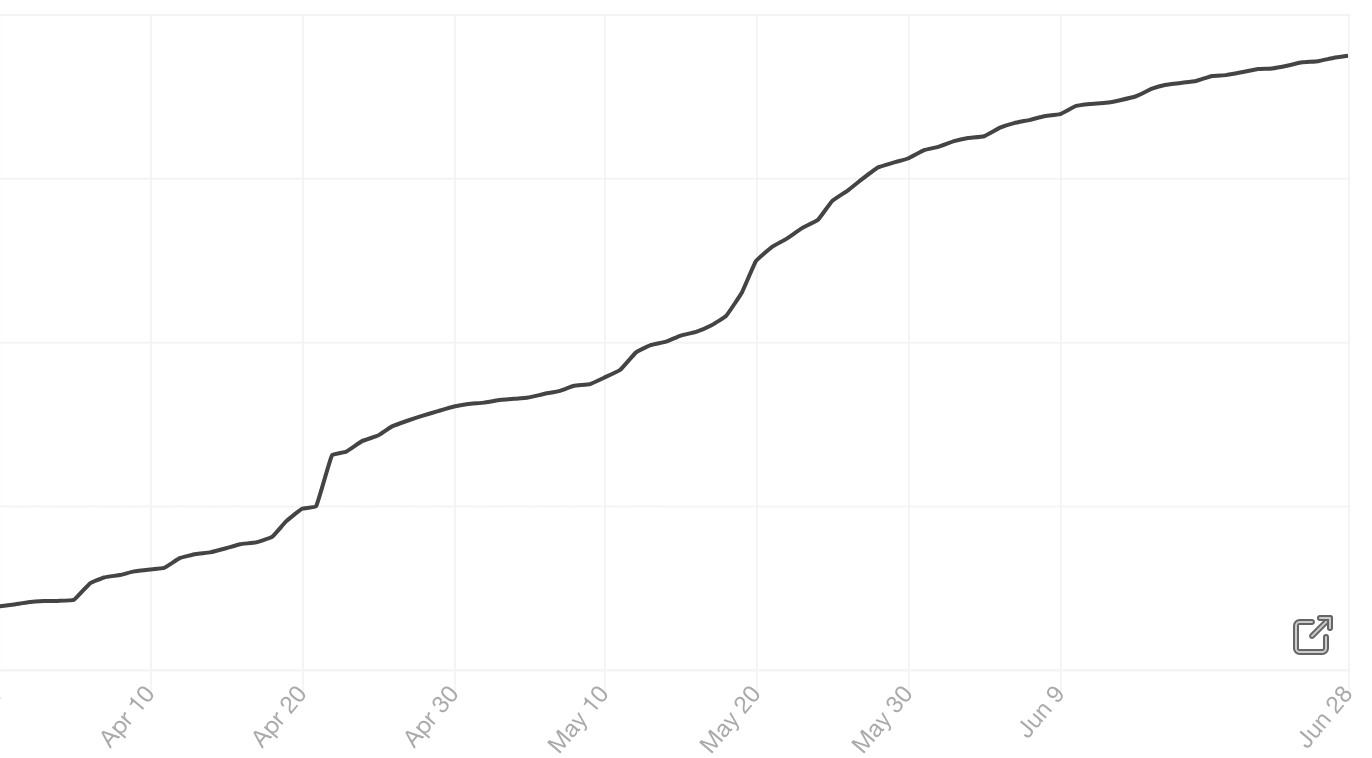
It’s clear over the last two weeks interest has slowed.
We can even see it with Reddit. Which is actually even worse with the bitcoin subreddit less than 1% growth.
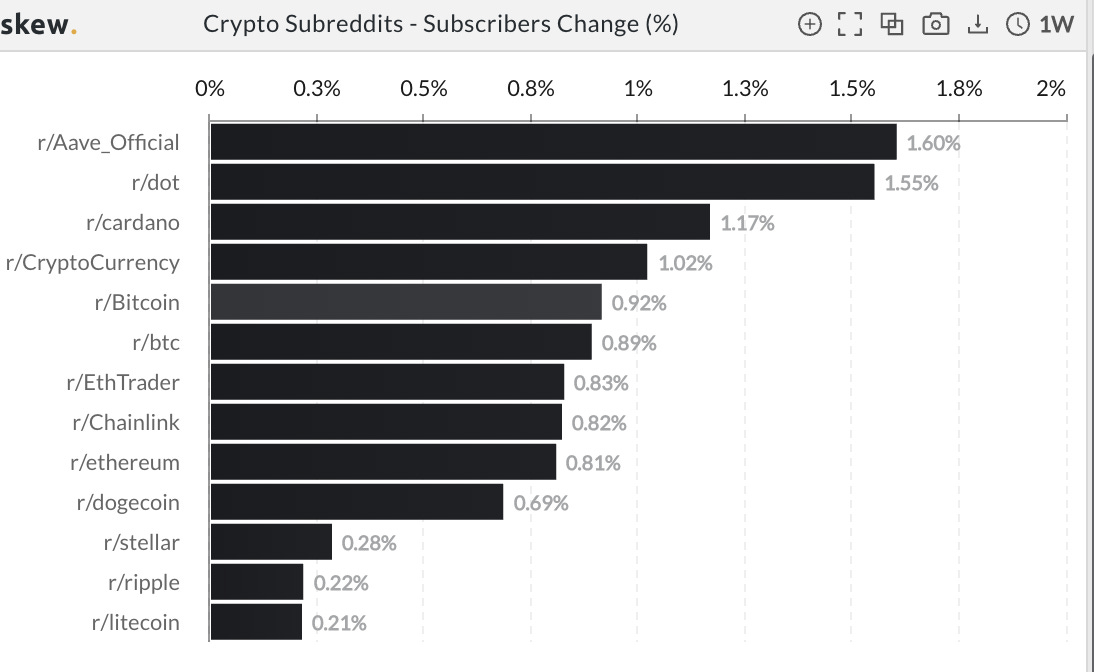
All of these stats are a great proxy for demand. And it’s why price looks like garbage lately. Tumbleweeds are bouncing through the forums, chats, and copy/paste DEXs.
Sure, we got some nice price action the last 36 hours... But this was in part because liquidations were situated in such a way that traders hunted the liquidity. Meaning market movers pushed price higher to force a series of liquidations so their $1 was more effective in pushing price faster.
To see what I mean in terms of liquidity pools, here is a chart that our friends from Kingfisher.io shared with us. It’s a liquidation map.
It’s important to keep an eye on these as we laid out in our issue from last week explaining how these liquidity pools help predict future price movements in low volume environments like we have now.
Some of you might recall “The Bart Era” of price action in late-2018. This is somewhat similar as price followed a series of price squeezes.
Note the time stamp of 21:10 UTC in the bar graphs below. This was just before price ripped $2k in an instant. It was forced market selling on the shorts highlighted in the green box.
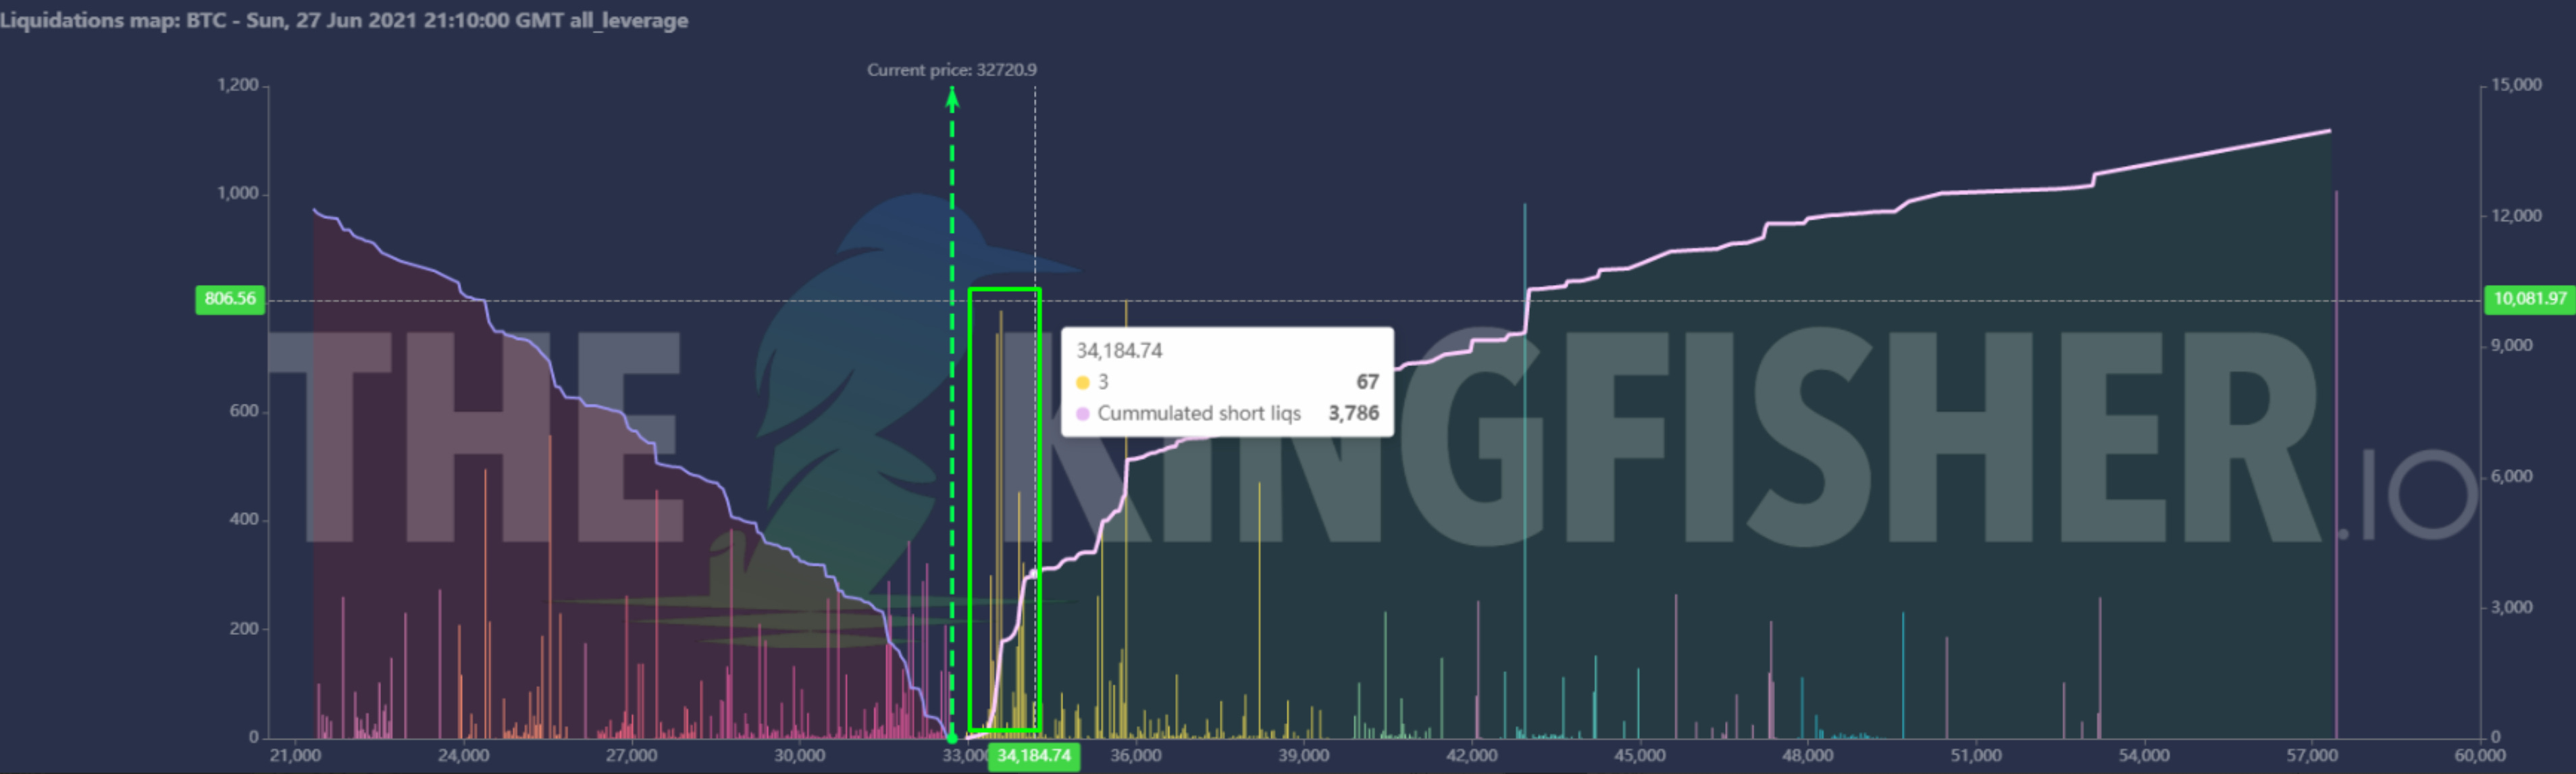
Which again, highlights the environment we are currently trading in… A low demand market with little to no new entrants coming in. This translates to price not being drive by spot, but being driven by derivatives.
It also alludes to price being range bound until new demand enters the market or we breakdown in price more.
To hit on this later point some more, and explain why it’s a real risk to consider, let’s shine some light on what happened last Friday.
Pablo attacked $30k on Friday last week. To realize why this is significant it’s important to understand that when price was near $60k, Pablo would attack the support and test how price reacted.
This happened several times.
And once Pablo sold into support and it broke, he attacked it like a tiger hunting a wounded animal.
To be frank here, this worries me that lower prices might be coming in the next few weeks.
On-chain signals from our internal system are still leaning bearish for the time being. And if we start to trend towards range support at $30k and Pablo starts to wake up, it’s best to have dry powder on hand.
Patience is rewarded here. Hopefully we find some bullishness to talk about in our next issue.
Until then…
Your Pulse on Crypto,
Ben Lilly


