Derivative FOMO
Why funding rates matter

Funding rates.
I’ve seen several questions asking why they matter. The easiest way I found to explain it thus far is to break the cost down.
If you have $100 and open up a 10x leveraged position on BTC, it means you’re borrowing money to have a $1,000 position. If funding rates are anything like we’ve seen of late, this can hit 0.5%, which is something I saw earlier in the week with 1inch.
The 0.5% is paid every 8 hours and ends up being 1.5% for the day. Annualized it comes out to 547.5%, a bit insane.
Now, on $1,000 it works out to be $15 a day for funding. Not bad right?
Wrong.
Your collateral is $100… not $1,000. So unless 1inch is running 15% higher per day you’re getting crushed by holding this position open. Which acts as a deterrence for traders in the derivatives market. And if you held the position for two days and price doesn’t move… you’re probably getting margin call notices on your position. Which means you need to add capital to a losing position or go ahead and take the 30% loss.
Funding rates are a sure way to calm the market down and it’s a clear sign of FOMO in the derivatives market. Understanding how extreme funding rates are matters when it comes to opening a profitable position or trade.
Quite frankly, it’s in part why Jarvis AI has been a bit quiet as of late.
You see, with funding rates so extreme it acts like an overstretched rubberband on price. It just doesn’t have much give. Price needs to settle down and often times consolidation follows such FOMO like periods.
This consolidation is what we see now, a period that’s on the heels of Elon Musk deciding he wanted to paralyze every crypto exchange with a tweet. Him tweeting about bitcoin is literally ratcheting up the funding rates instantly.
Thankfully, Elon hasn’t tweeted about sticking a bitcoin “B” on the hood of every Tesla, otherwise we wouldn’t see funding rates come back down like we’re starting to see.
To see what I mean, look at the chart below, which one of our new data scientists put together yesterday.
It might be a bit difficult to read as this is a box plot chart and it’s really not meant to be published… more of internal stuff. But all you really need to look at is the body of the candle or the box of each time period.
As the boxes move higher, the funding rates on average are extreme. You can see the funding rates were more extreme than any other time period over the last three months.
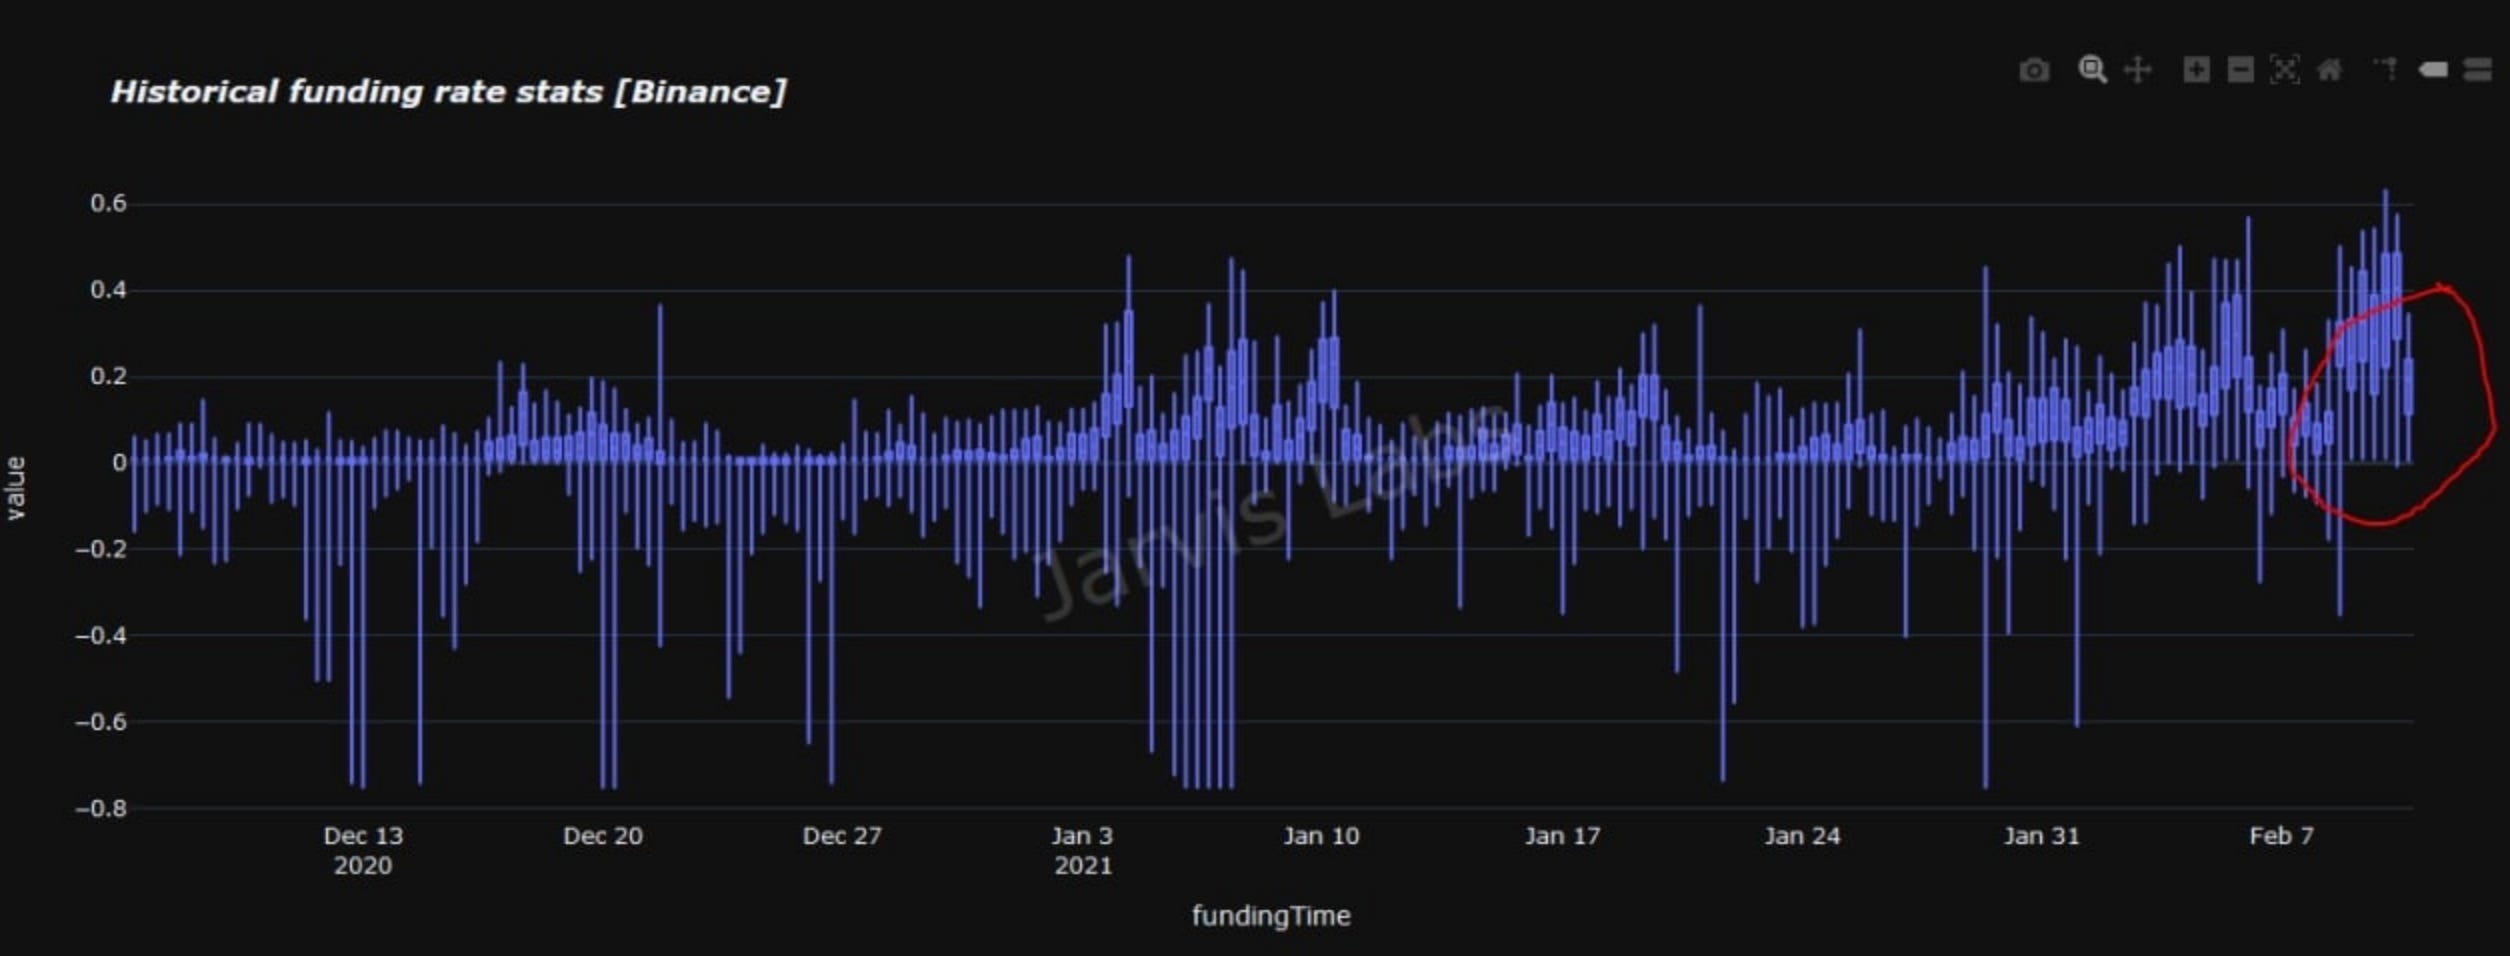
We’re just now witnessing the boxes coming down to Earth. When the boxes come back to “0” it’ll mean the derivatives market isn’t hindering bitcoin or ethereum from going on a run in the coming week.
Your pulse on crypto,
B
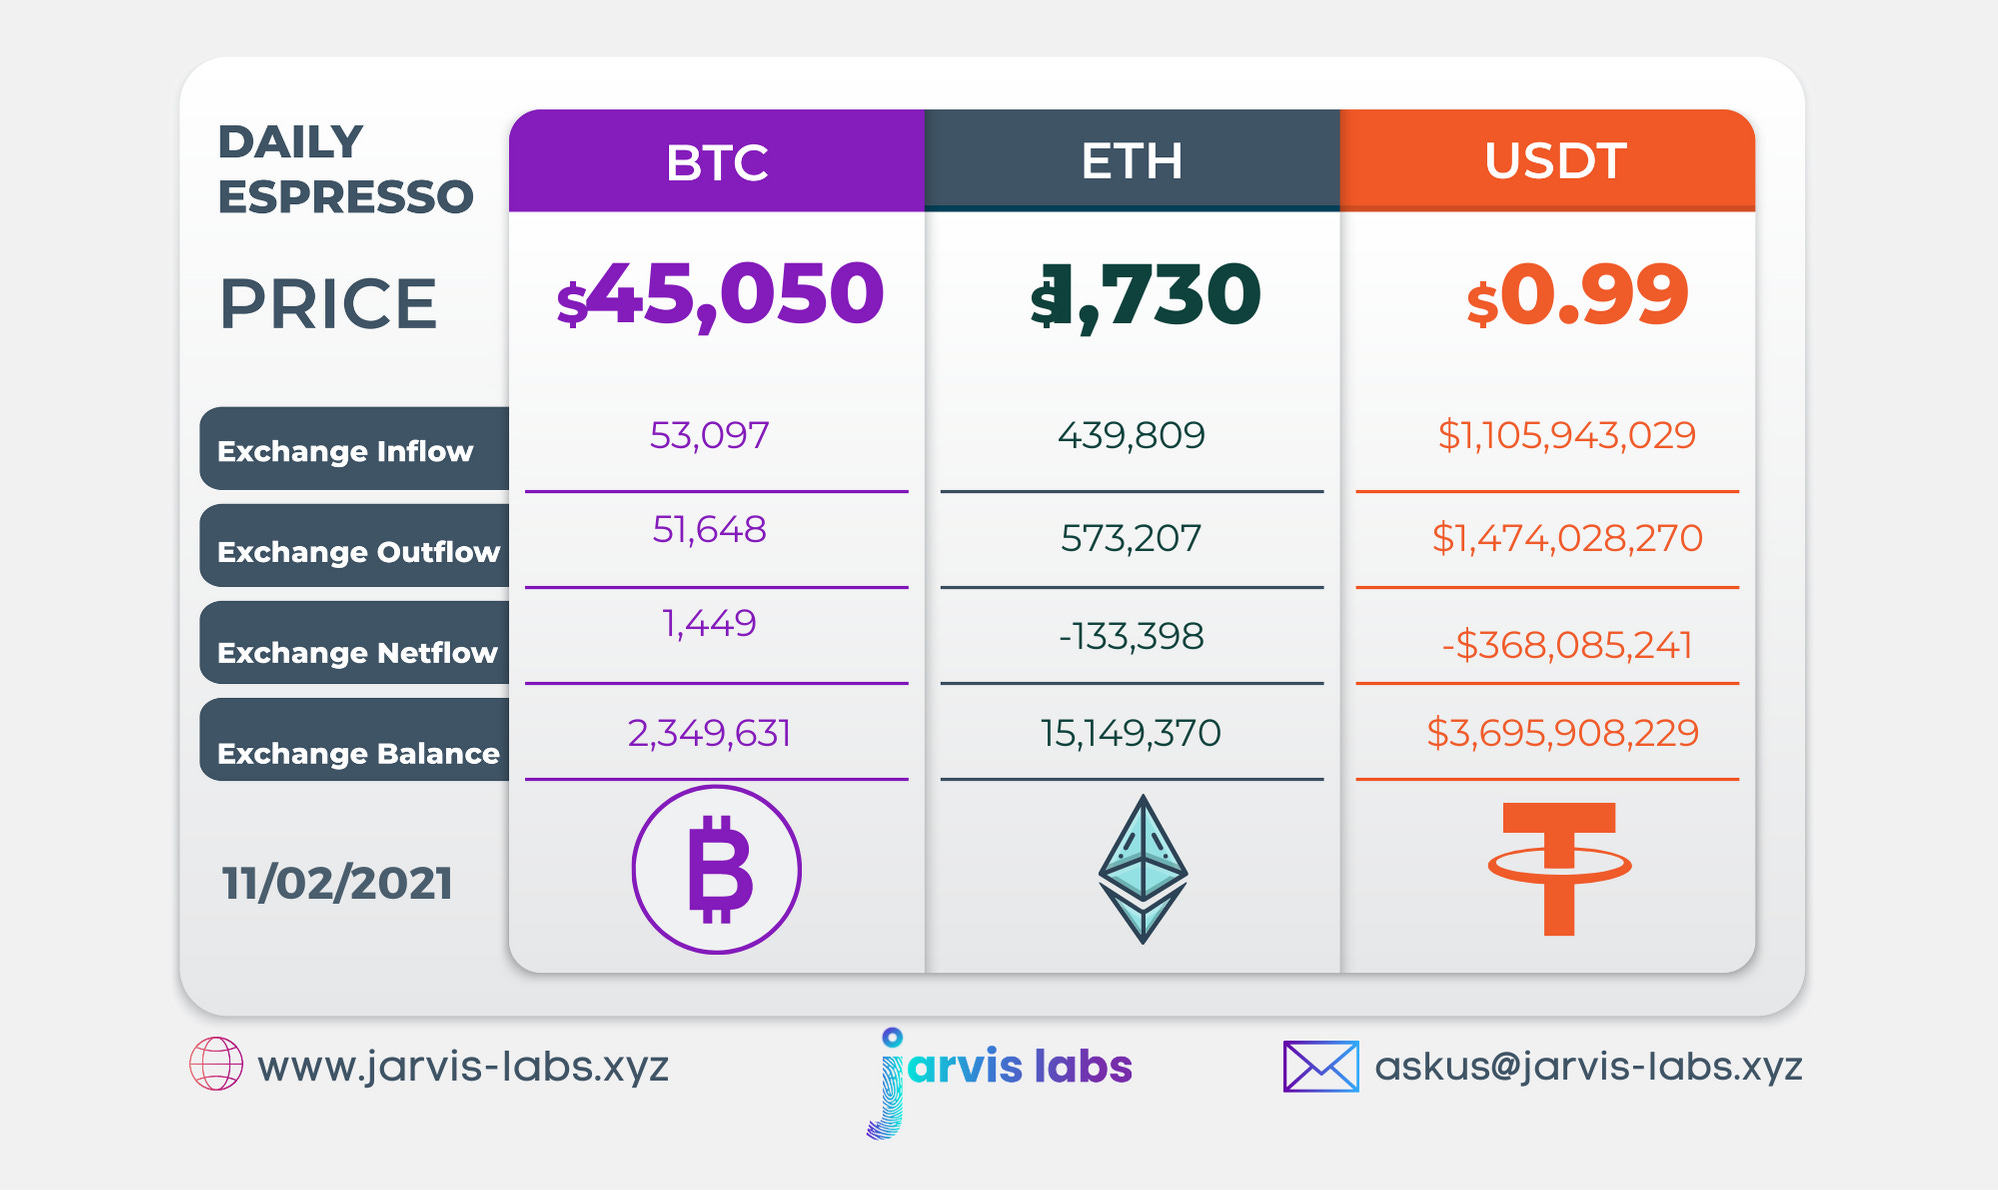
Below is our daily exchange flow data. This is a great gauge for understanding if BTC, ETH and USDT are flowing into exchange or leaving. If BTC and ETH are entering exchanges it can generally be viewed as bearish. The opposite scenario is bullish.
When USDT is flowing into exchanges it’s typically viewed as bullish. The opposite scenario is bearish.
This should only be used as a general gauge. Tagging the exact wallets these flows move into or out of helps improve the reliability of this data, which is what we do at Jarvis Labs. To date we have over 800 market mover wallets and 16 million wallets tagged all together. Consider us your on-chain trackers.