Bitcoin’s Perfect Storm
Notes From the Lab: Is It Time to Ride the Wave, or Stay On the Shore?


What began as just a few raindrops of minor trouble offshore now feels like a massive tsunami heading straight for us.
As we’ve learned all too well over the past year, when it rains in crypto, it doesn’t just pour – it turns into a full-on Category 5 hurricane.
Our latest storm began when the SEC filed lawsuits against Coinbase and Binance last week. That got the tides going.
As a result, crypto markets began to crumble as numerous platforms removed tokens deemed unregistered securities, and endless rumors began swirling about the ability of any and all exchanges to withstand the mounting legal pressure.
Though we did get a bit of relief when the latest CPI reading showed that inflation has cooled, and the Fed confirmed this with a rate pause at FOMC…it was more like finding calm in the eye of the storm than it was the end of the storm altogether, as a market dump to new three-month lows followed soon after.
Then, sure enough, the winds got rough again when Tether (USDT) suddenly lost its peg after a massive trade by a big player caused an imbalance in Curve's stablecoin pool.
All this chaos in such a short amount of time has made the market’s fear palpable and justifiable at present. Even despite yesterday’s mega announcement that $10 trillion asset manager BlackRock was filing for a spot Bitcoin ETF – the holy grail of mainstream adoption and its accompanying bullishness.
In times like these when emotions are at their highest is when it’s most critical to take a look beyond the headline narratives and look at the data for an objective view.
No different than a big-wave surfer analyzing weather reports prior to paddling out into post-storm swells, we too must use the information we have available to determine if the risk is worth the ride.
So let’s grab our boards and get into it…
King Dollar on the Ropes
As we’ve mentioned before, one of the most important relationships that steers the crypto market is BTC’s inverse correlation with the U.S. dollar, as measured by the U.S. Dollar Index (DXY).
Any decline in the dollar is good for Bitcoin (and vice versa).
That’s why BTC and risk assets have had their strongest bull runs during DXY bear markets. Take a look at the chart below comparing DXY (blue line) to total crypto market cap (red line) to see what I’m talking about.
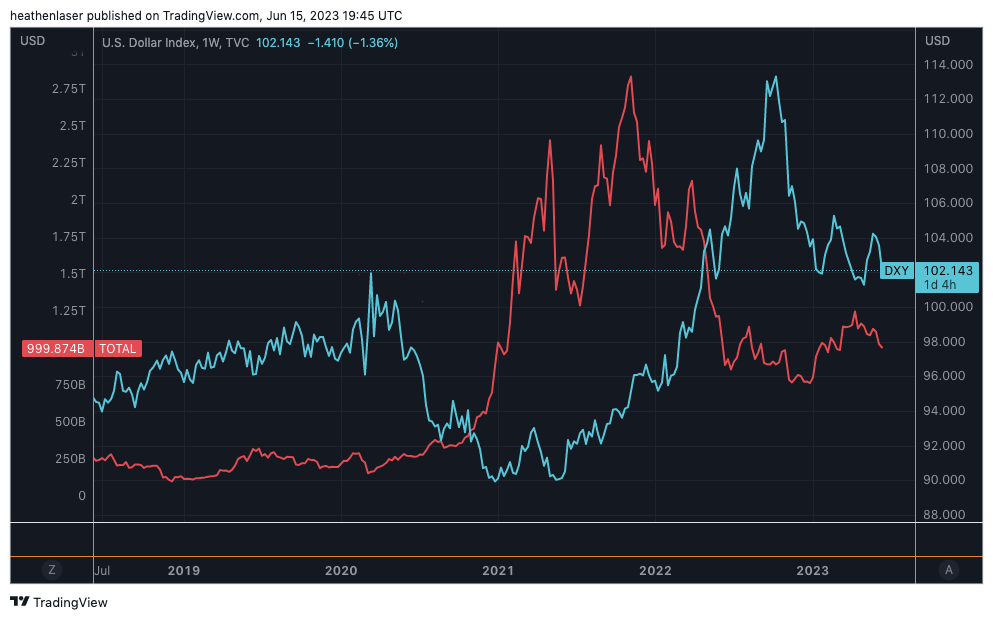
In 2020, as DXY declined and fell under 100, crypto went on its huge run throughout 2020 and most of 2021. And likewise, as DXY regained strength going into 2022, crypto reversed.
But with the Fed’s actions this week in pausing rate hikes (plus inflation cooling), it looks like the dollar’s days above 100 may be numbered.
Below is a weekly chart of DXY. You can see in the rightmost portion of the top section that its peak in May was another lower high from the macro perspective as it failed to move past the 105 level from early March.
Its failure to generate momentum at the high end of this range has led to a technical breakdown, as it has now fallen below both its 50- and 100-day moving averages (MAs), represented by the green and blue lines, respectively.
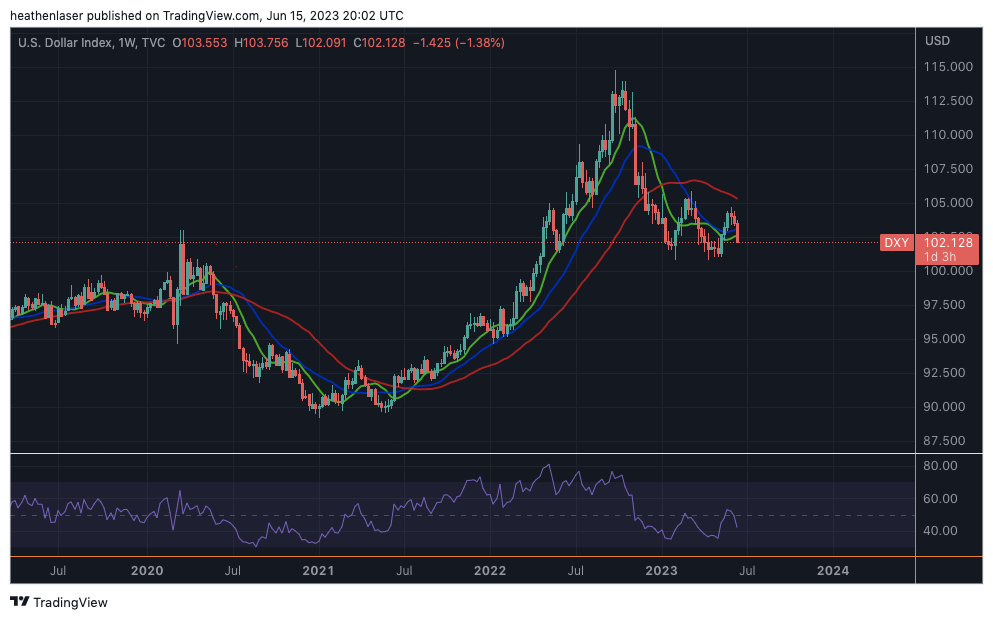
More importantly, though, is what’s going on at the bottom of the chart. That purple line is DXY’s Relative Strength Indicator (RSI), which measures its momentum.
As we’ll see below, DXY’s bull run from May 2021 to September 2022, when it rose over 27% from sub-90 to over-114, was fueled by its RSI staying above 50 (dotted line, bottom section) on the weekly chart.
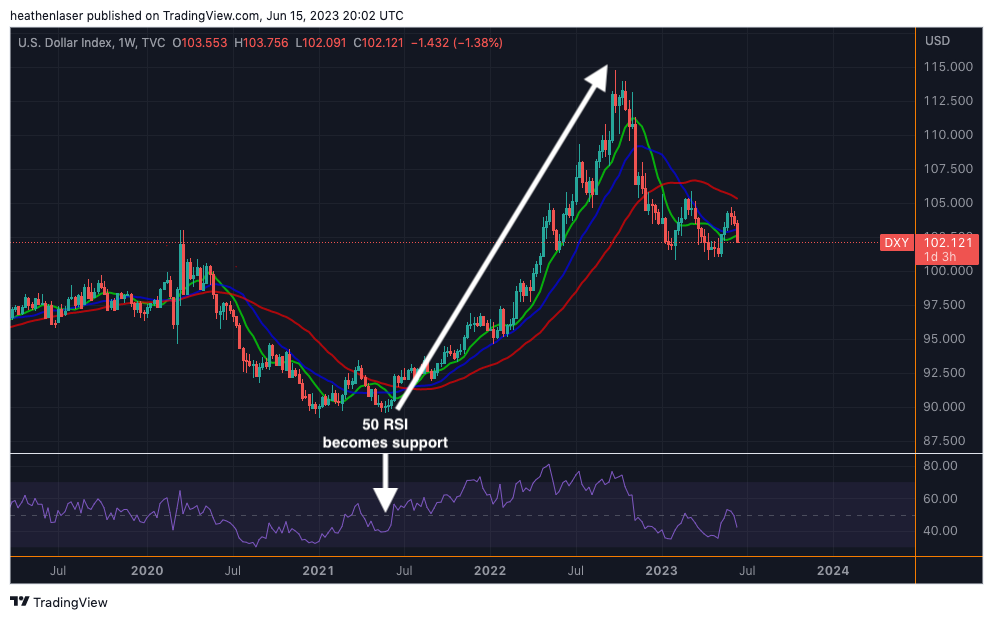
Conversely, its 2020-2021 bear market that saw it plummet from 103 to sub-90 in under a year was defined by RSI remaining below 50.
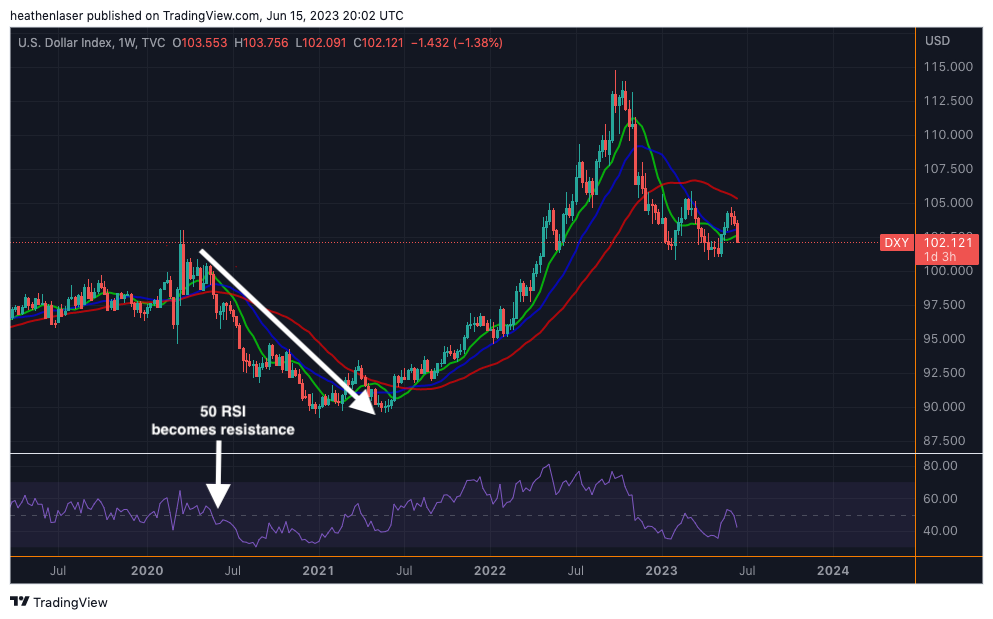
Now, after retesting that 50 RSI level for the second time in 2023 and failing again, it appears this level has become firm resistance.
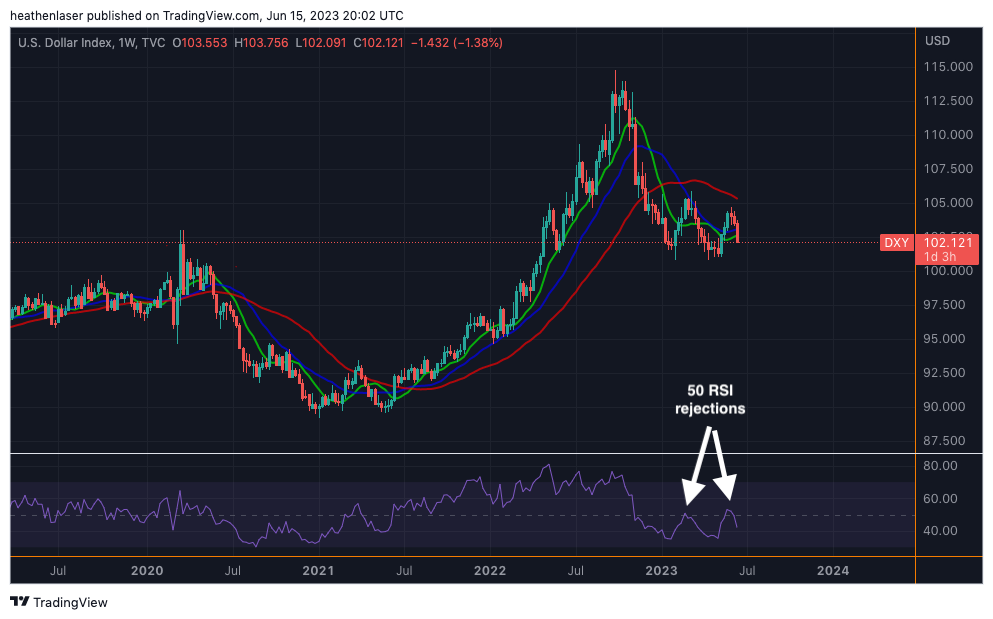
The longer the dollar’s weekly RSI remains below 50, the more likely it becomes that we will see its long-held support level at the crucial psychological level of 100 fail.
Historically, DXY below 100 has been a green light for risk assets like BTC and ETH to run higher.
But of course, no analysis should rely on a single point of data. We always want to look for confluence from other indicators.
That’s why we should also look at how gold’s behaving right now…
Gold’s Time to Shine
Last month, I talked about why the market (and crypto) can’t escape gold:
No matter how much it pains central bankers and fiat enthusiasts to admit this, there is no asset more in control of market behavior than the shiny rock.
The size of gold’s global market (~$13.5 trillion), and its reliability over centuries as a hedge against fiat failure, make it the purest litmus test we have for measuring DXY’s relative strength and weakness.
All moves from crypto and risk assets are ultimately downstream of the trend that gold sets.
And right now, the metal appears to be consolidating for a big move. It just successfully retested its May low and 100-day MA simultaneously. As we also see, it too retested its 50 RSI level on the weekly chart, with much better results than the dollar thus far.
If it can now close Q2 back above its current $1,970 level, a move back above $2,000 and toward all-time highs ($2,080) shouldn’t be far behind.
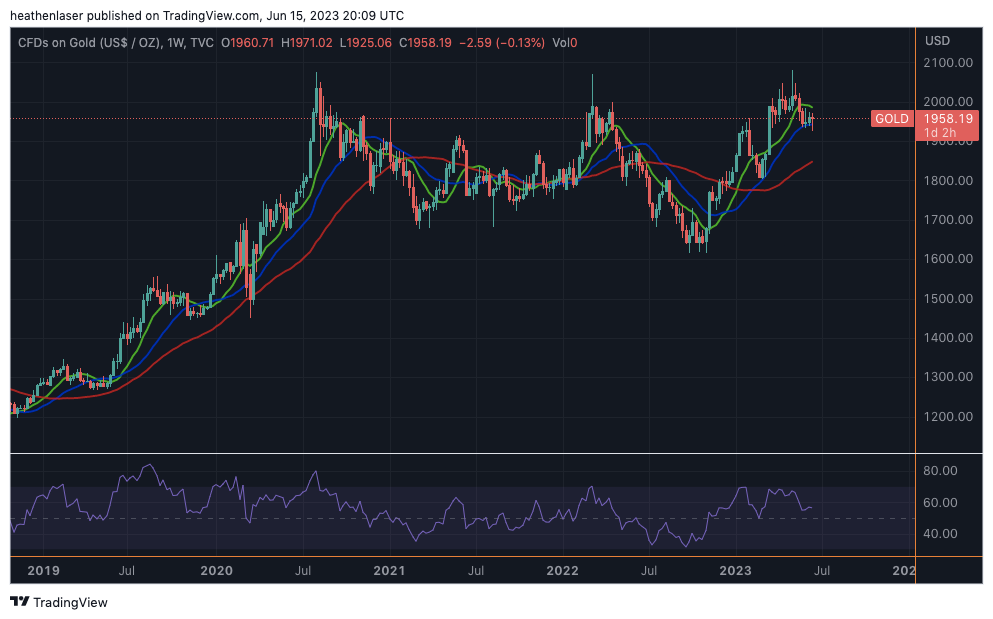
And in contrast to the dollar, what’s good for gold is good for BTC – although it can sometimes take a while for crypto to catch up. If gold can produce a breakout here, expect BTC to follow suit, especially considering the weakness in the dollar.
Which brings us to the king of crypto itself…
Thank you for reading Espresso. This post is public so feel free to share it.
Surf’s Up?
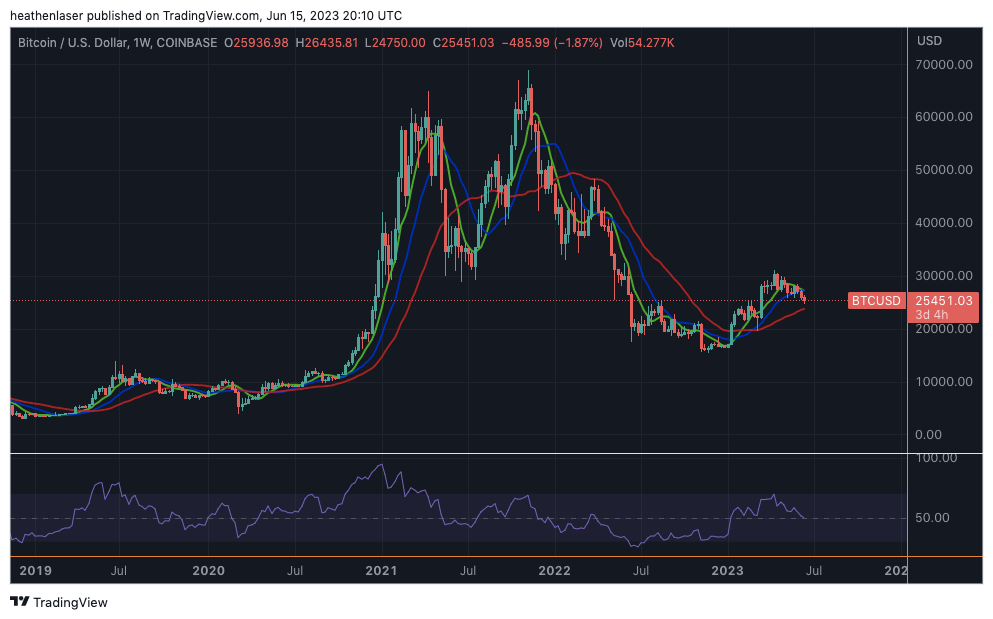
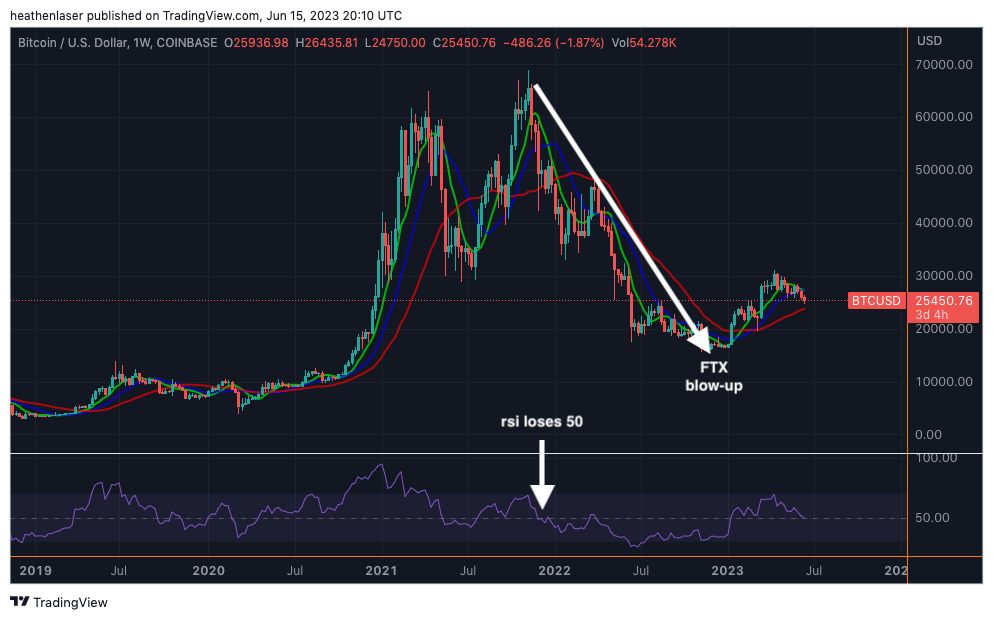
It’s been a rough week for BTC. It’s basically lost all of its trend lines, except for the 200-day moving average (red line) that it rode up from the bottom. (I covered this in more depth in the latest episode of our Alpha Bites podcast, which you can listen to here.)
But of course, BTC’s RSI momentum is something we want to look at closely here. Similar to DXY and gold, it too has been backtesting the key level of 50 RSI on the weekly chart.
Again, that’s a crucial level to determine whether we’re in bull market territory. Note how the RSI held above 50 from April 2020 to early 2021, when BTC soared from under $10,000 all the way to its euphoric top above $65,000 the week of Coinbase’s IPO.
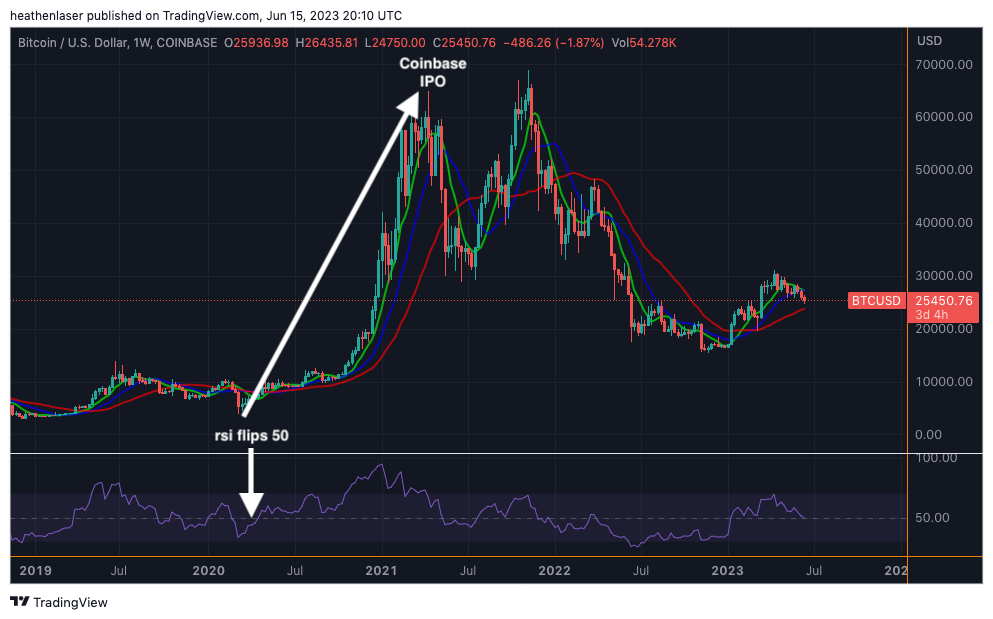
Then, in late 2021 after the all-time high peak, we saw RSI fall below 50, where it stayed throughout the brutal 2022 bear market which culminated with FTX’s collapse.
Which brings us to now. RSI has been over 50 on BTC’s weekly chart since early January when it first re-crossed the 2017 all-time high around $19,000.
As we see below, it is currently retesting this pivotal line in the sand for the first time since March’s crash when it held.
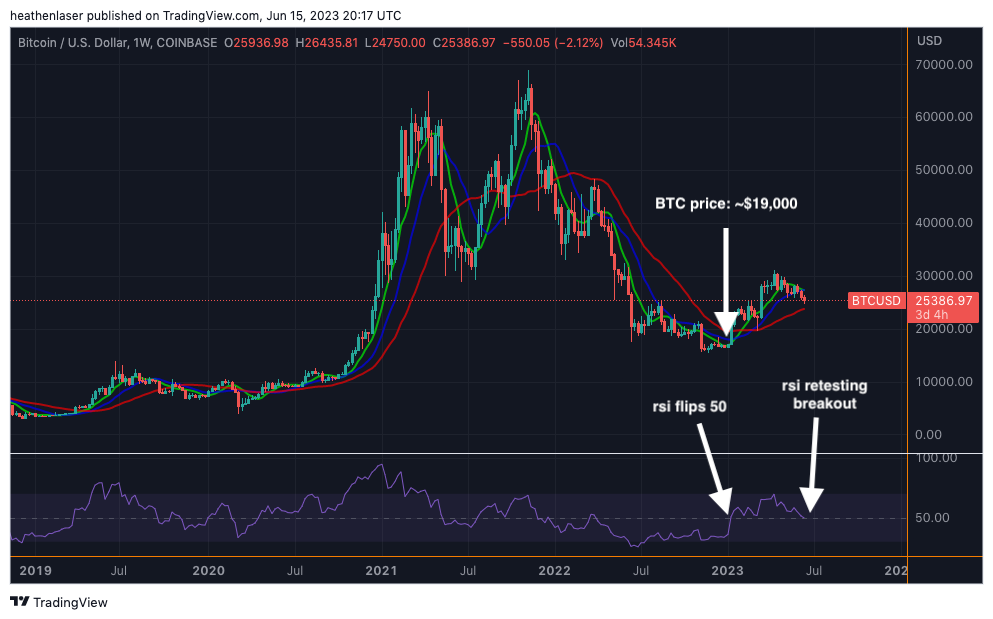
If BTC’s RSI can continue to hold above 50 on the weekly chart from here while DXY continues to reject from 50 RSI on its weekly chart, combined with a breakout from gold…consider that the ultimate risk-on signal. Time to paddle out and catch the wave of a lifetime.
Especially if it comes on the heels of a BlackRock spot ETF approval.
If the waves break the other way however, and lead to gold’s and BTC’s RSIs receding back below 50, consider that a stark warning that the waters are unsafe to enter…and you’d be better off waiting on dry land until a better set and set-up comes in.
Vaya Con Dios until next time.
Your friend,


