A Perfect Concoction: ETH
Exchange flows + TA with @tempting_beef


I had enough boxes for eight more orders.
On my website I can tell a few customers have items in their cart. And a few other shoppers are clicking on a few items and are honing in on the correct size and color.
But I’m impatient. I wanted to finish up the day and end early. So I decided to activate a limited time 25% discount to close out the day… “While supplies last”.
As I sent the promo code I sat back in my chair thinking to myself, smart.
(ping, ping, ping)
50… 100… 200…
What is going on? My visitor count is doubling by the minute. There’s no way a 25% discount caused this type of reaction!
I’m no Amazon… Let alone near the first page of results on Google!
Turns out my competitor’s server just went down.
All of a sudden I’m flush with buyers. I immediately yank the discount and promote my higher margined items.
The market on my tiny little website became a hot where I suddenly was able to dictate price.
Which is exactly what we saw when it came to Ethereum earlier this week. The only difference is instead of website visitors, we had ETH buyers.
Let me show you what I mean...
The Breakdown
On May 2nd ETH started to test $3k. A major resistance from a psychological point of view as its a big round, whole number.
As it started to approach this somewhat historic figure, the exchange flows were acting one way… Only to reverse within minutes.
Now before I get into it, I’m @tempting_beef. I write about how to use on-chain data and technical analysis to gain an edge in the market. In my last guest post here on the Espresso title, “Bitcoin Trading Cheat Codes” I broke down these two forms of analysis for bitcoin.
This week I am focusing on Ethereum. Since I published my last issue in Espresso, ETH has risen over 65%, making it a great topic for today.
Getting back to the $3k resistance...
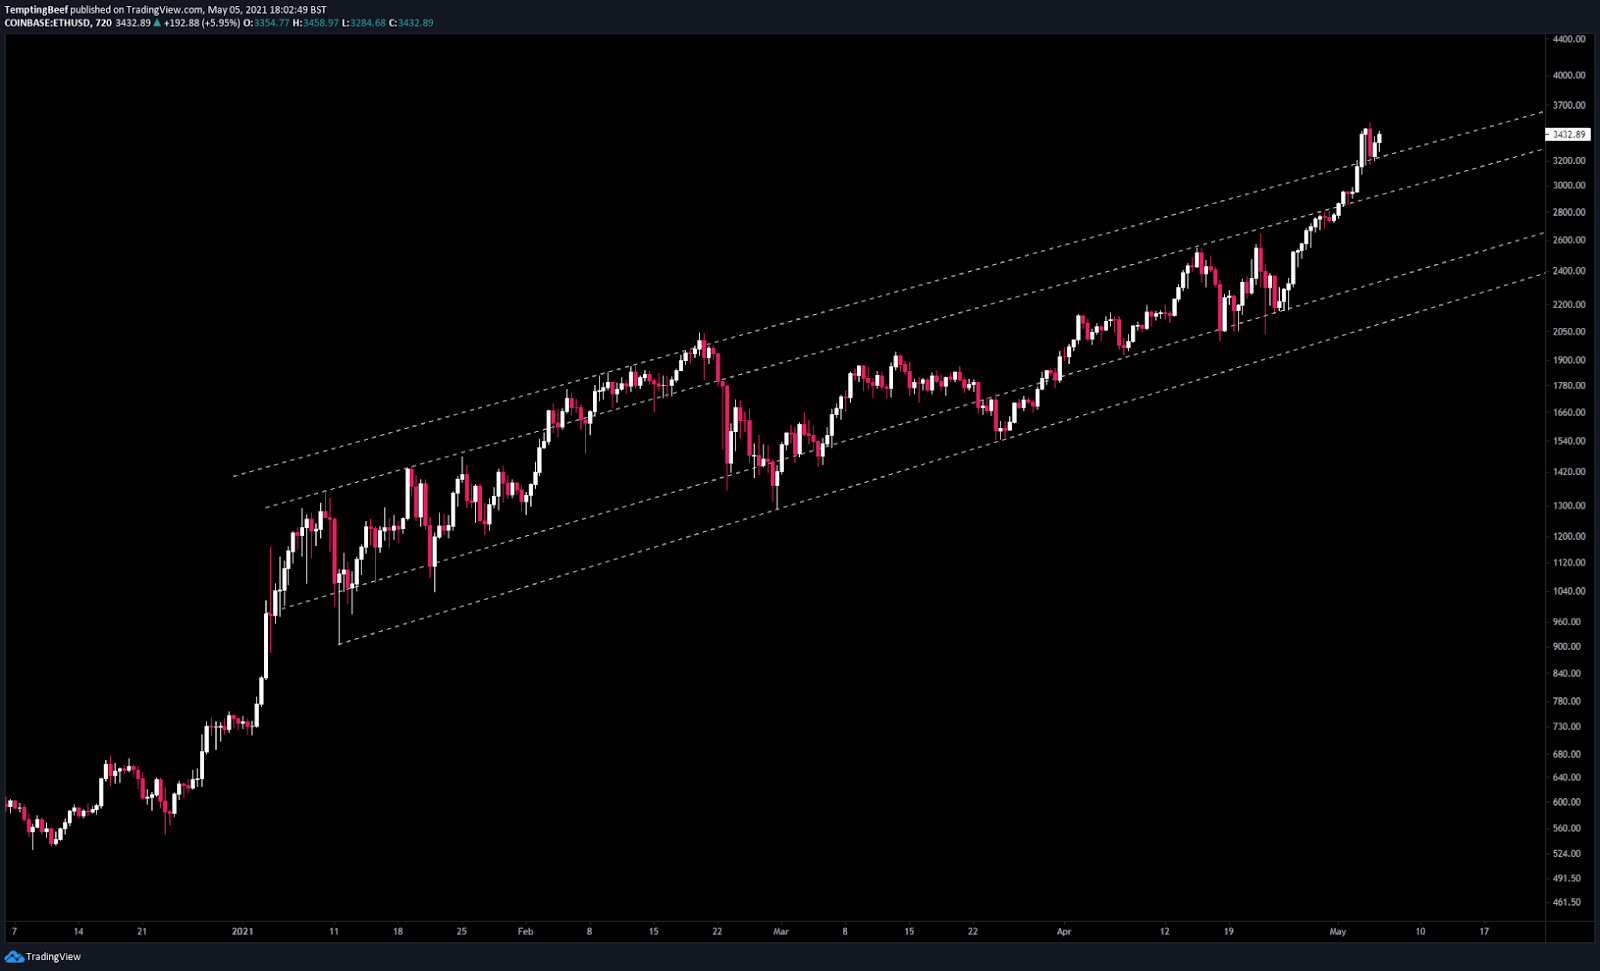
In the run up to that price range ETH traded in this upward trending channel since January of this year.
And during the last couple of weeks, the netflows of ETH moving to and from exchanges was predominantly negative. However I’d like to draw your attention to two interesting points regarding netflows. The first is before we got to the $3k break… I’d like to hit on this first since it helps form the case for the $3k break.
Firstly, exhibit A: a period of time that I’ve highlighted below where netflow was positive for ETH.
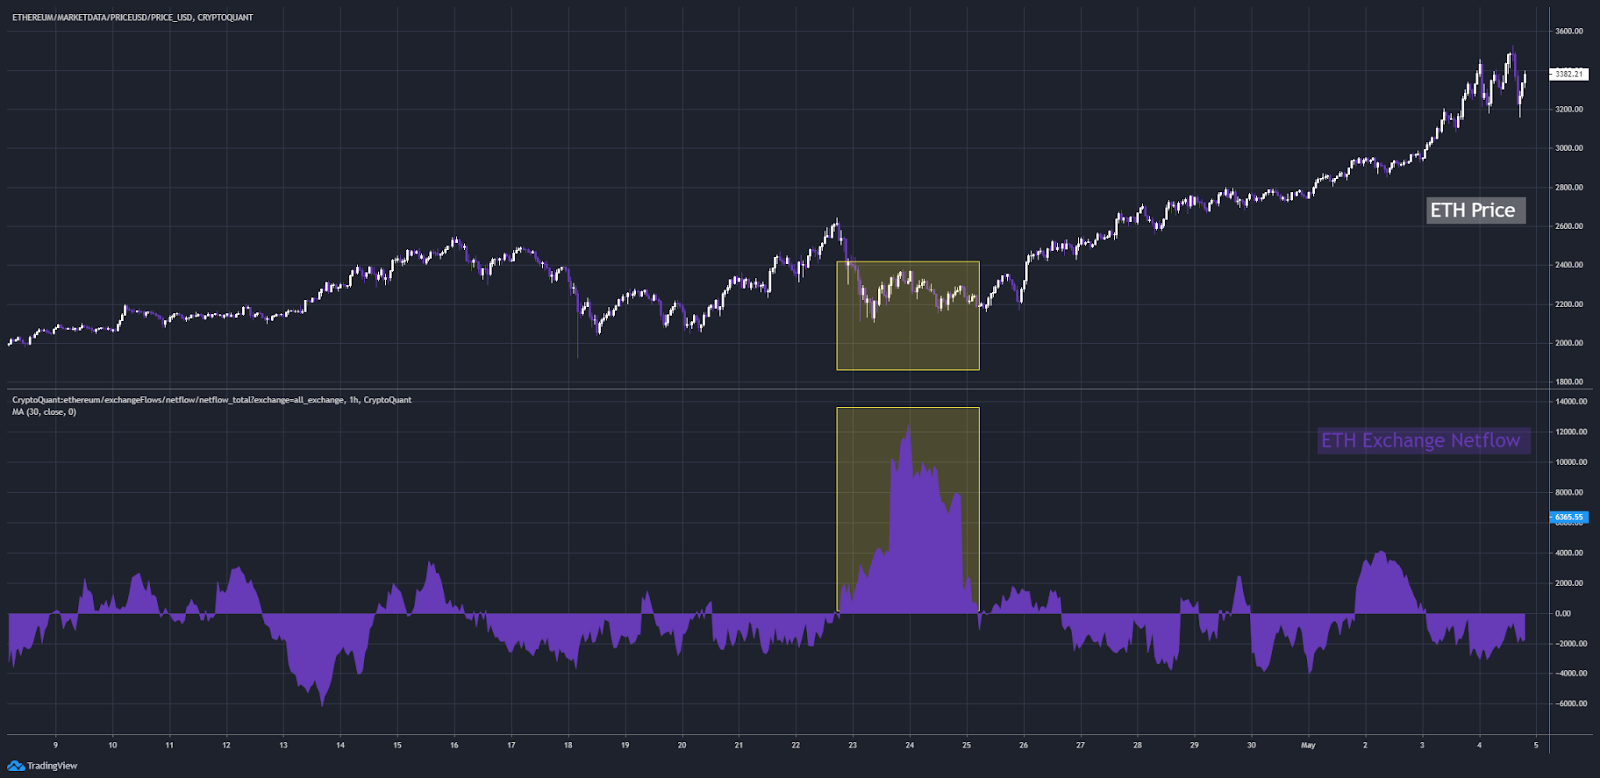
This was the last significant dip that we saw in price. ETH dropped from 2.5k to 2.1k.
Right after this dip, a swath of ETH entered exchanges to be sold. Price continued to move sideways.
Normally what we expect is netflows turn positive BEFORE the dip, signaling sellers have turned up and price is about to fall.
But this time we saw ETH turning up AFTER the dip...
Remember, this took place right after the Coinbase listing which was a bit of a let down. And bitcoin just posted a lower low. Add into the mix that we also had the news out of the US that the Biden Administration looks to whack Americans with a steep capital gains tax.
Traders were a bit on edge. And this reaction is somewhat typical of FOMO, responding after the event.
But you’re probably asking yourself, where’s the signal then?
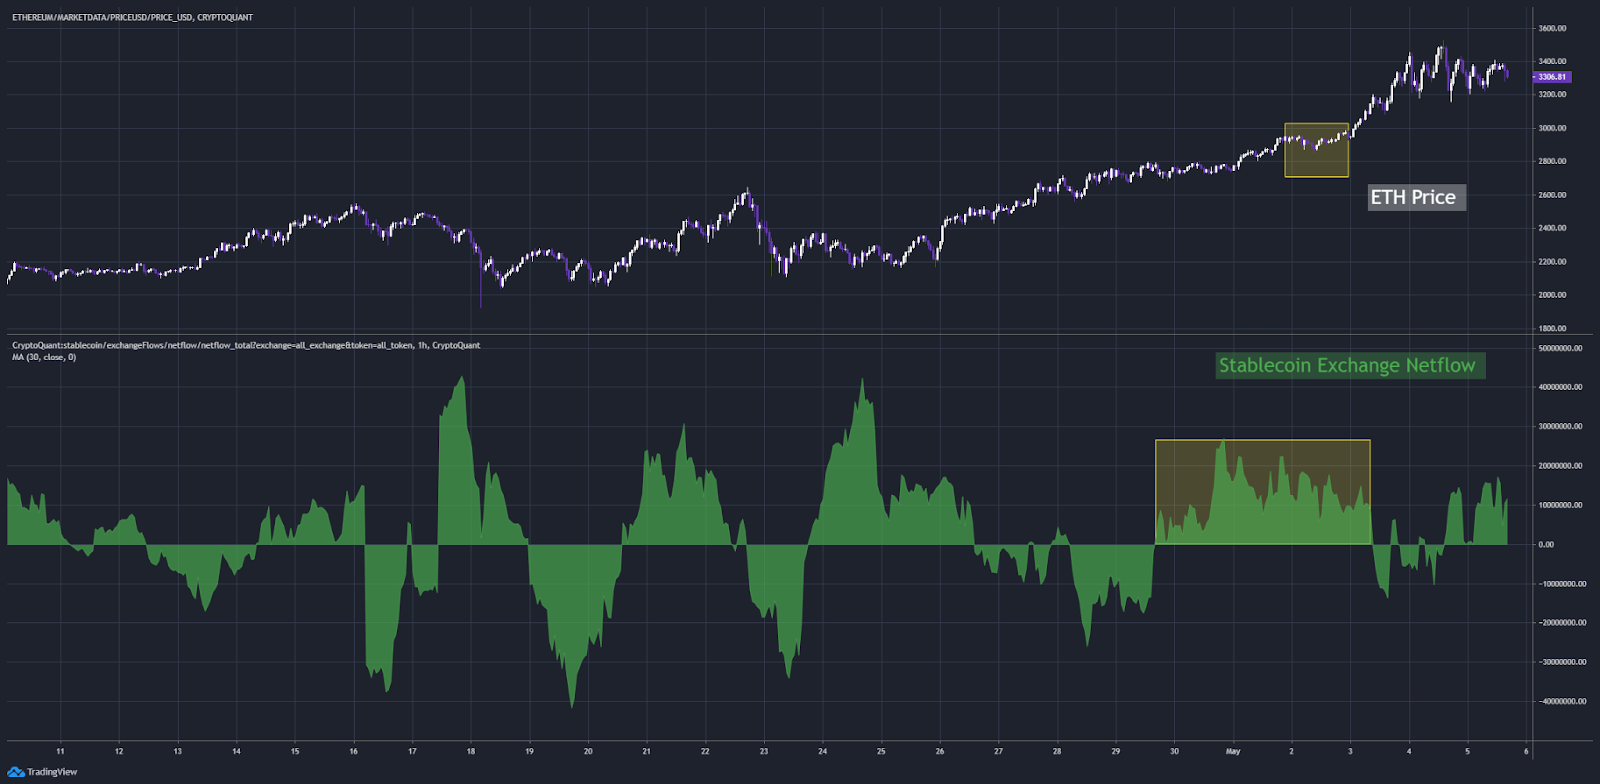
Well, we started to see huge amounts of stablecoins enter exchanges:
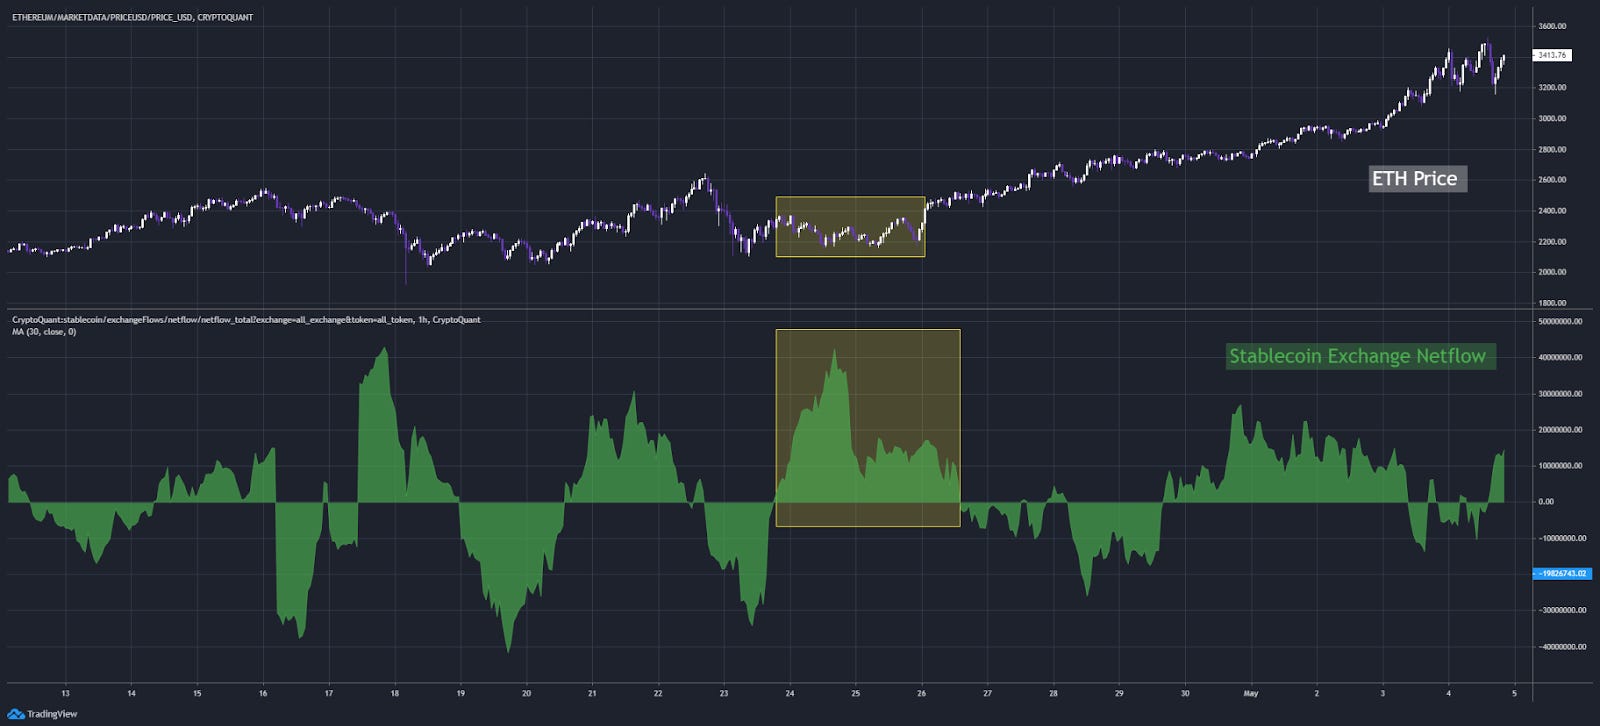
Its why we saw price go sideways. All these stablecoins were absorbing the excessive inflows of ETH.
It was a battle between excessive supply and excessive demand, but leaning on macro analysis that hints at higher highs ahead, the buying was likely to win out.
Now, exhibit B - back to the netflow chart, only this time near $3k:
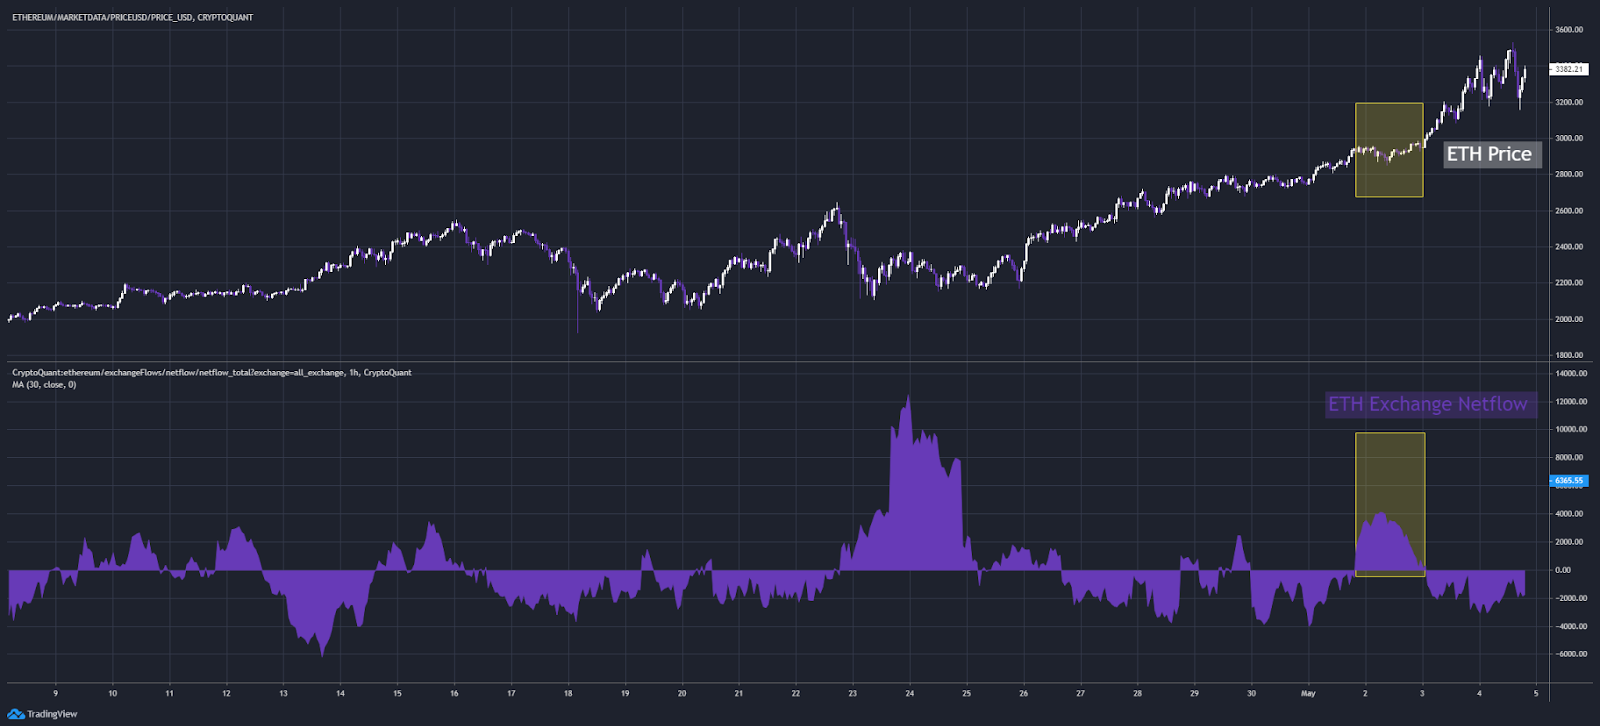
The second point of interest is when netflow turned positive once again, right before we hit 3k. This made sense because 3k was a big target for many traders, a psychological resistance area.
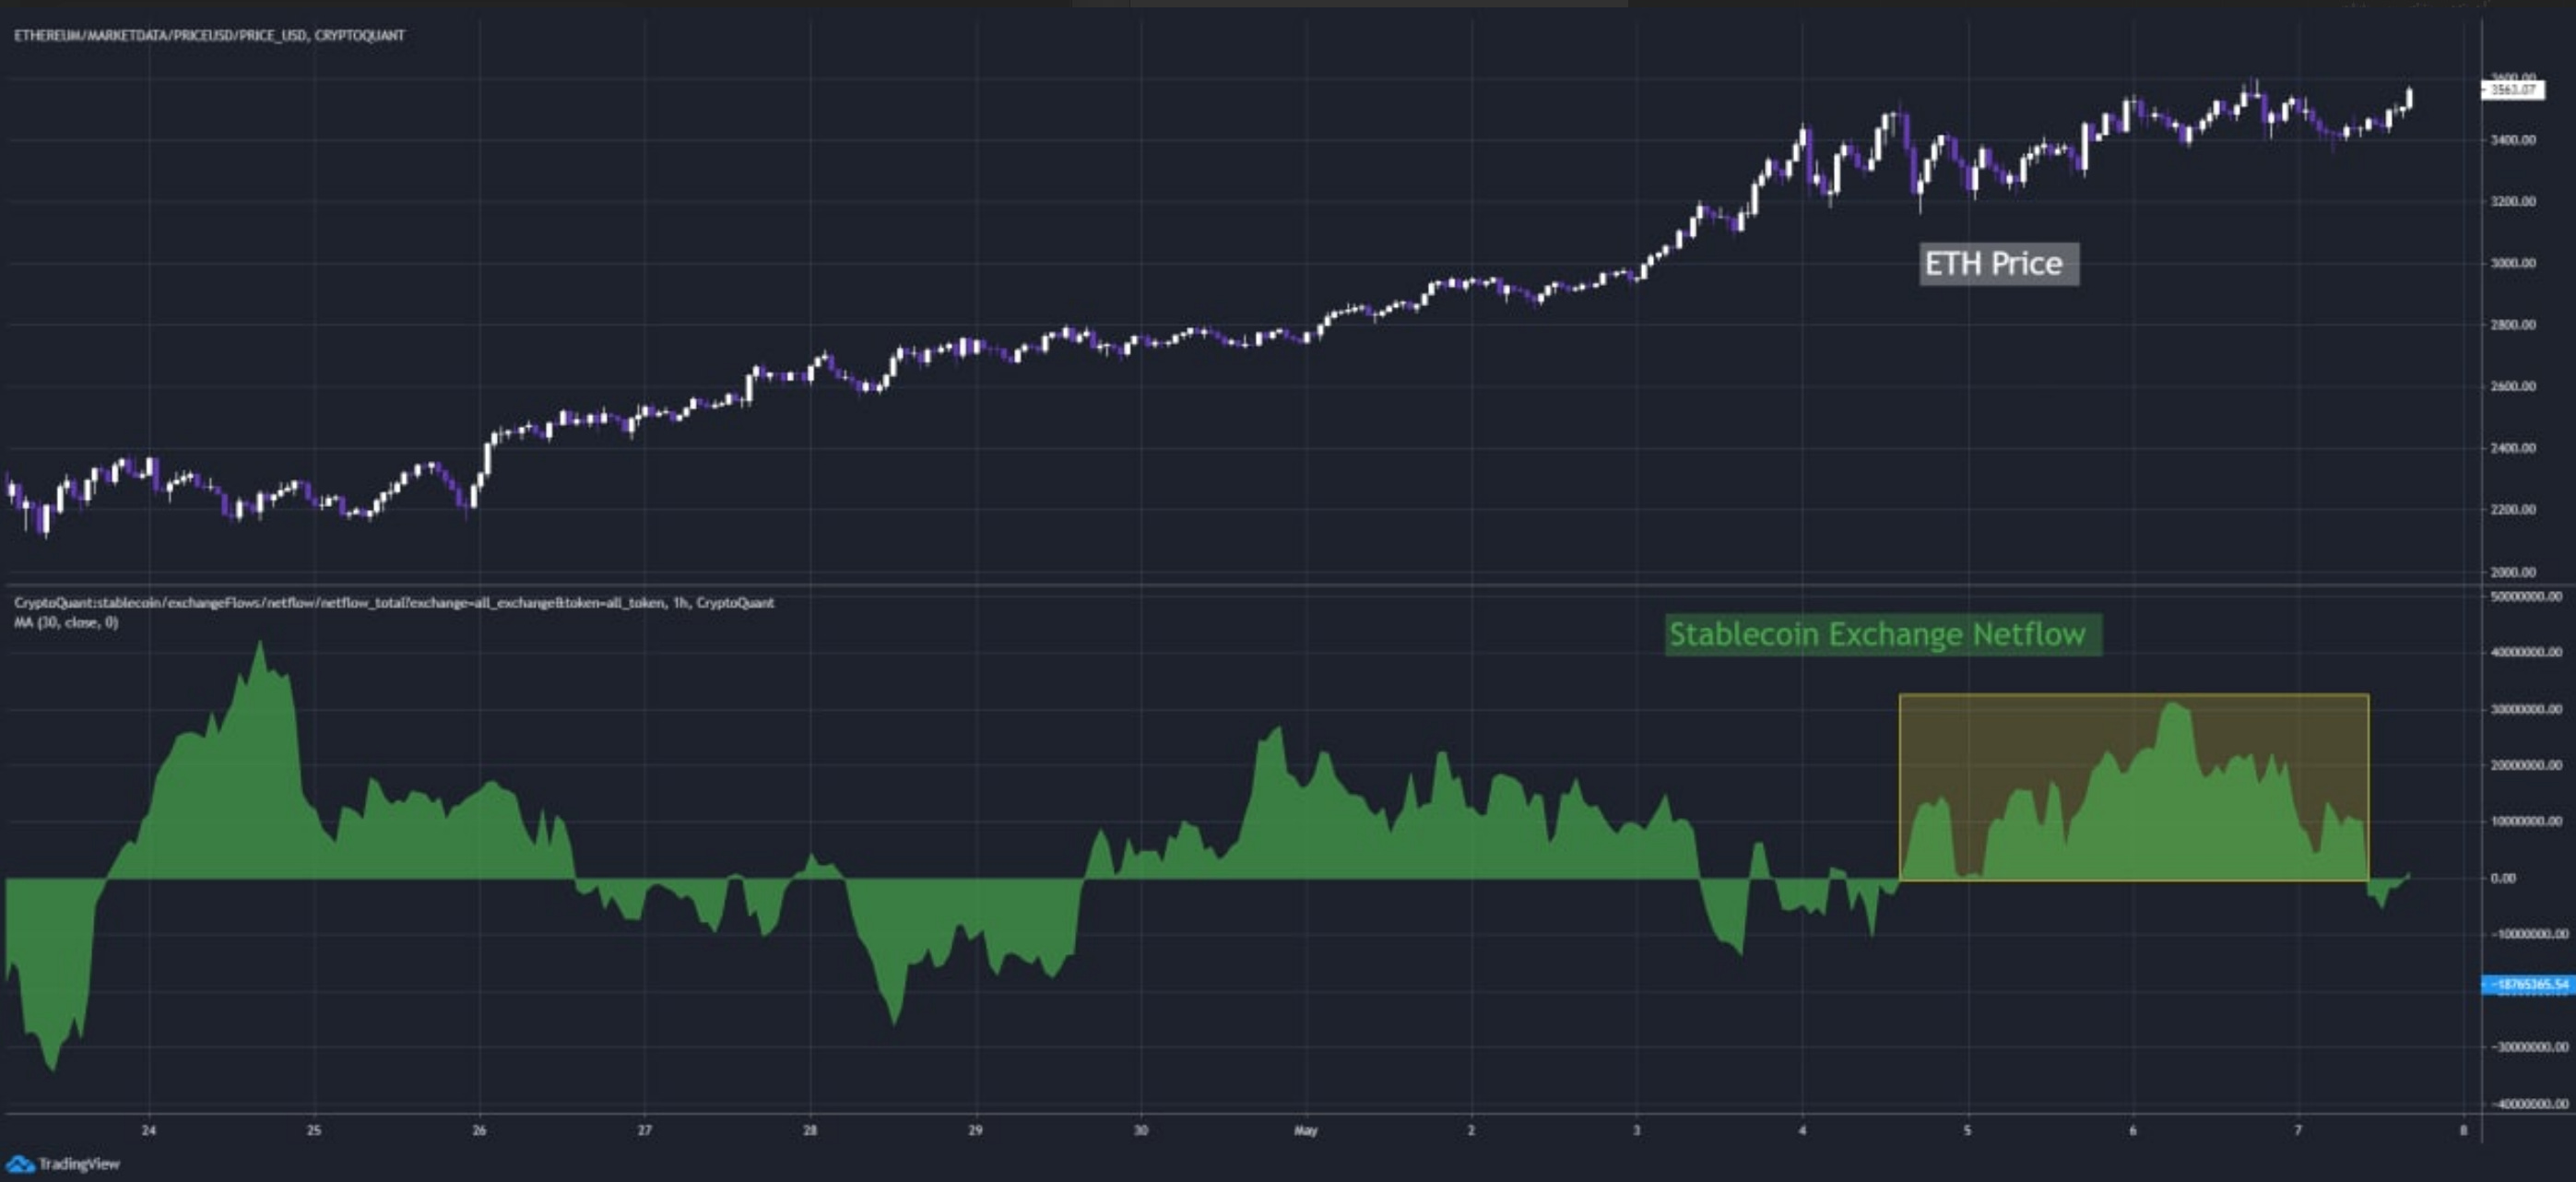
Leaning on the stablecoin chart once again, we can see that netflow remained positive throughout this time. It was an uninterrupted surge in demand.
Even as we hit this area of resistance buyers were clambering to scoop up any new ETH that entered the market.
We all know what happened next as ETH kept running passed $3.5k.
What’s Next?
So what is going to take place over the next week or so…
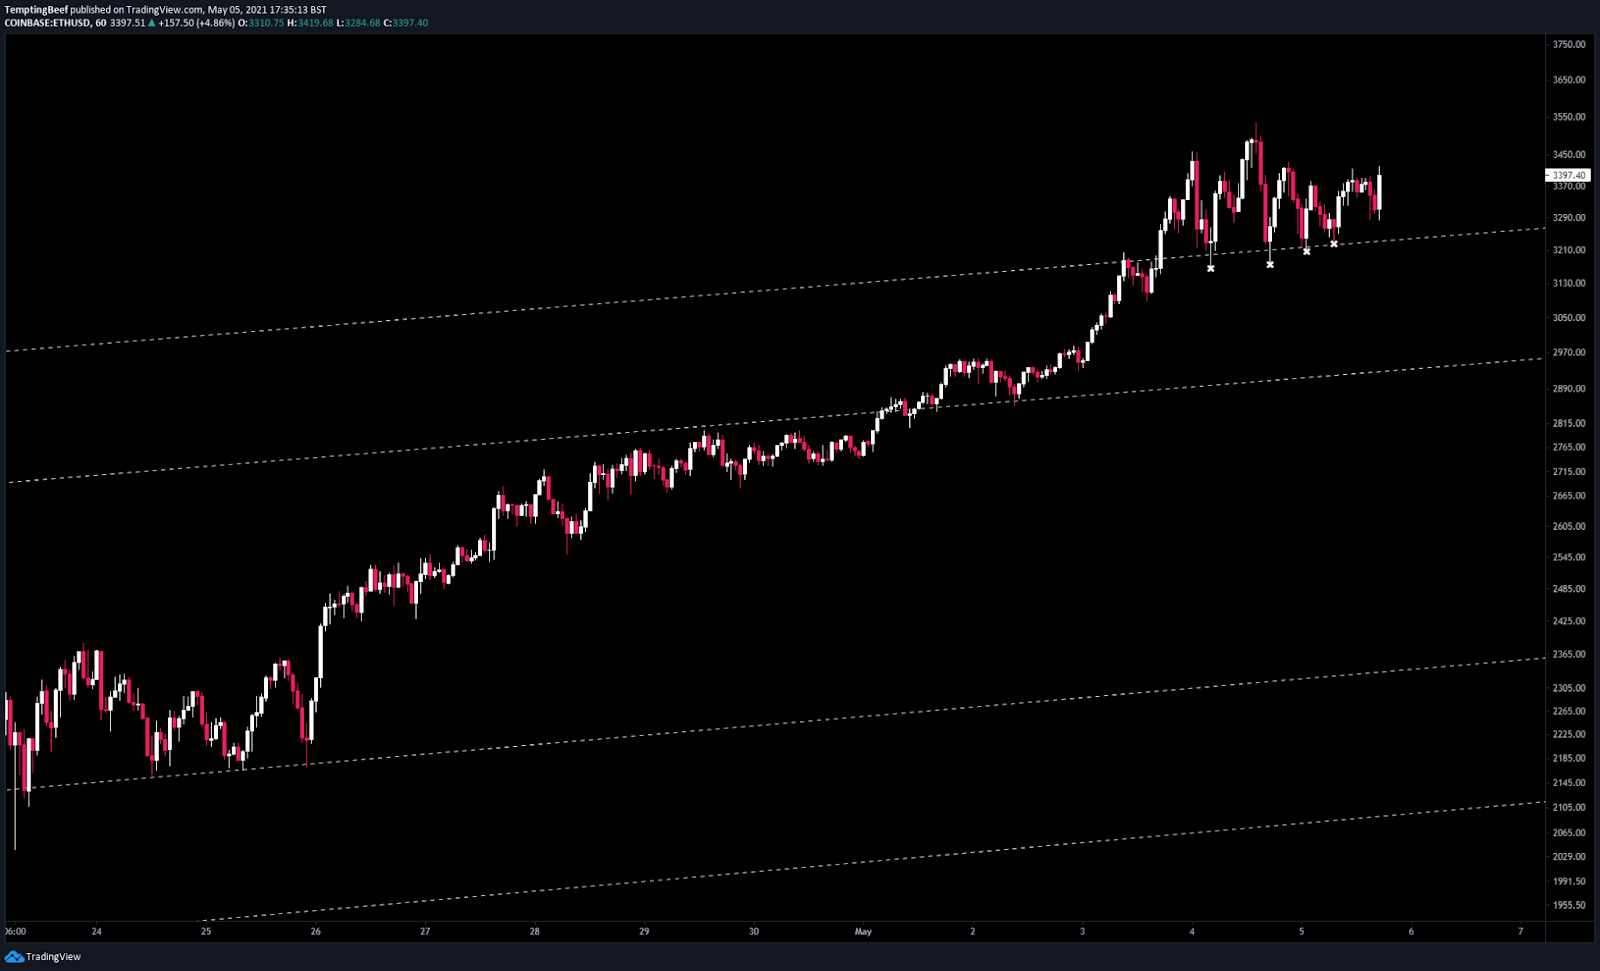
We’re seeing some incredible price action as ETH consolidates above the channel.
We have seen a clean S/R flip and four convincing retests shown by the x’s on the chart below.
During this time stablecoin netflows tell us demand is still high, absorbing any excess ETH when it hits the market. It’s likely died down just a tad because as you’ll see in the next chart…
There is no excess inflows taking place.
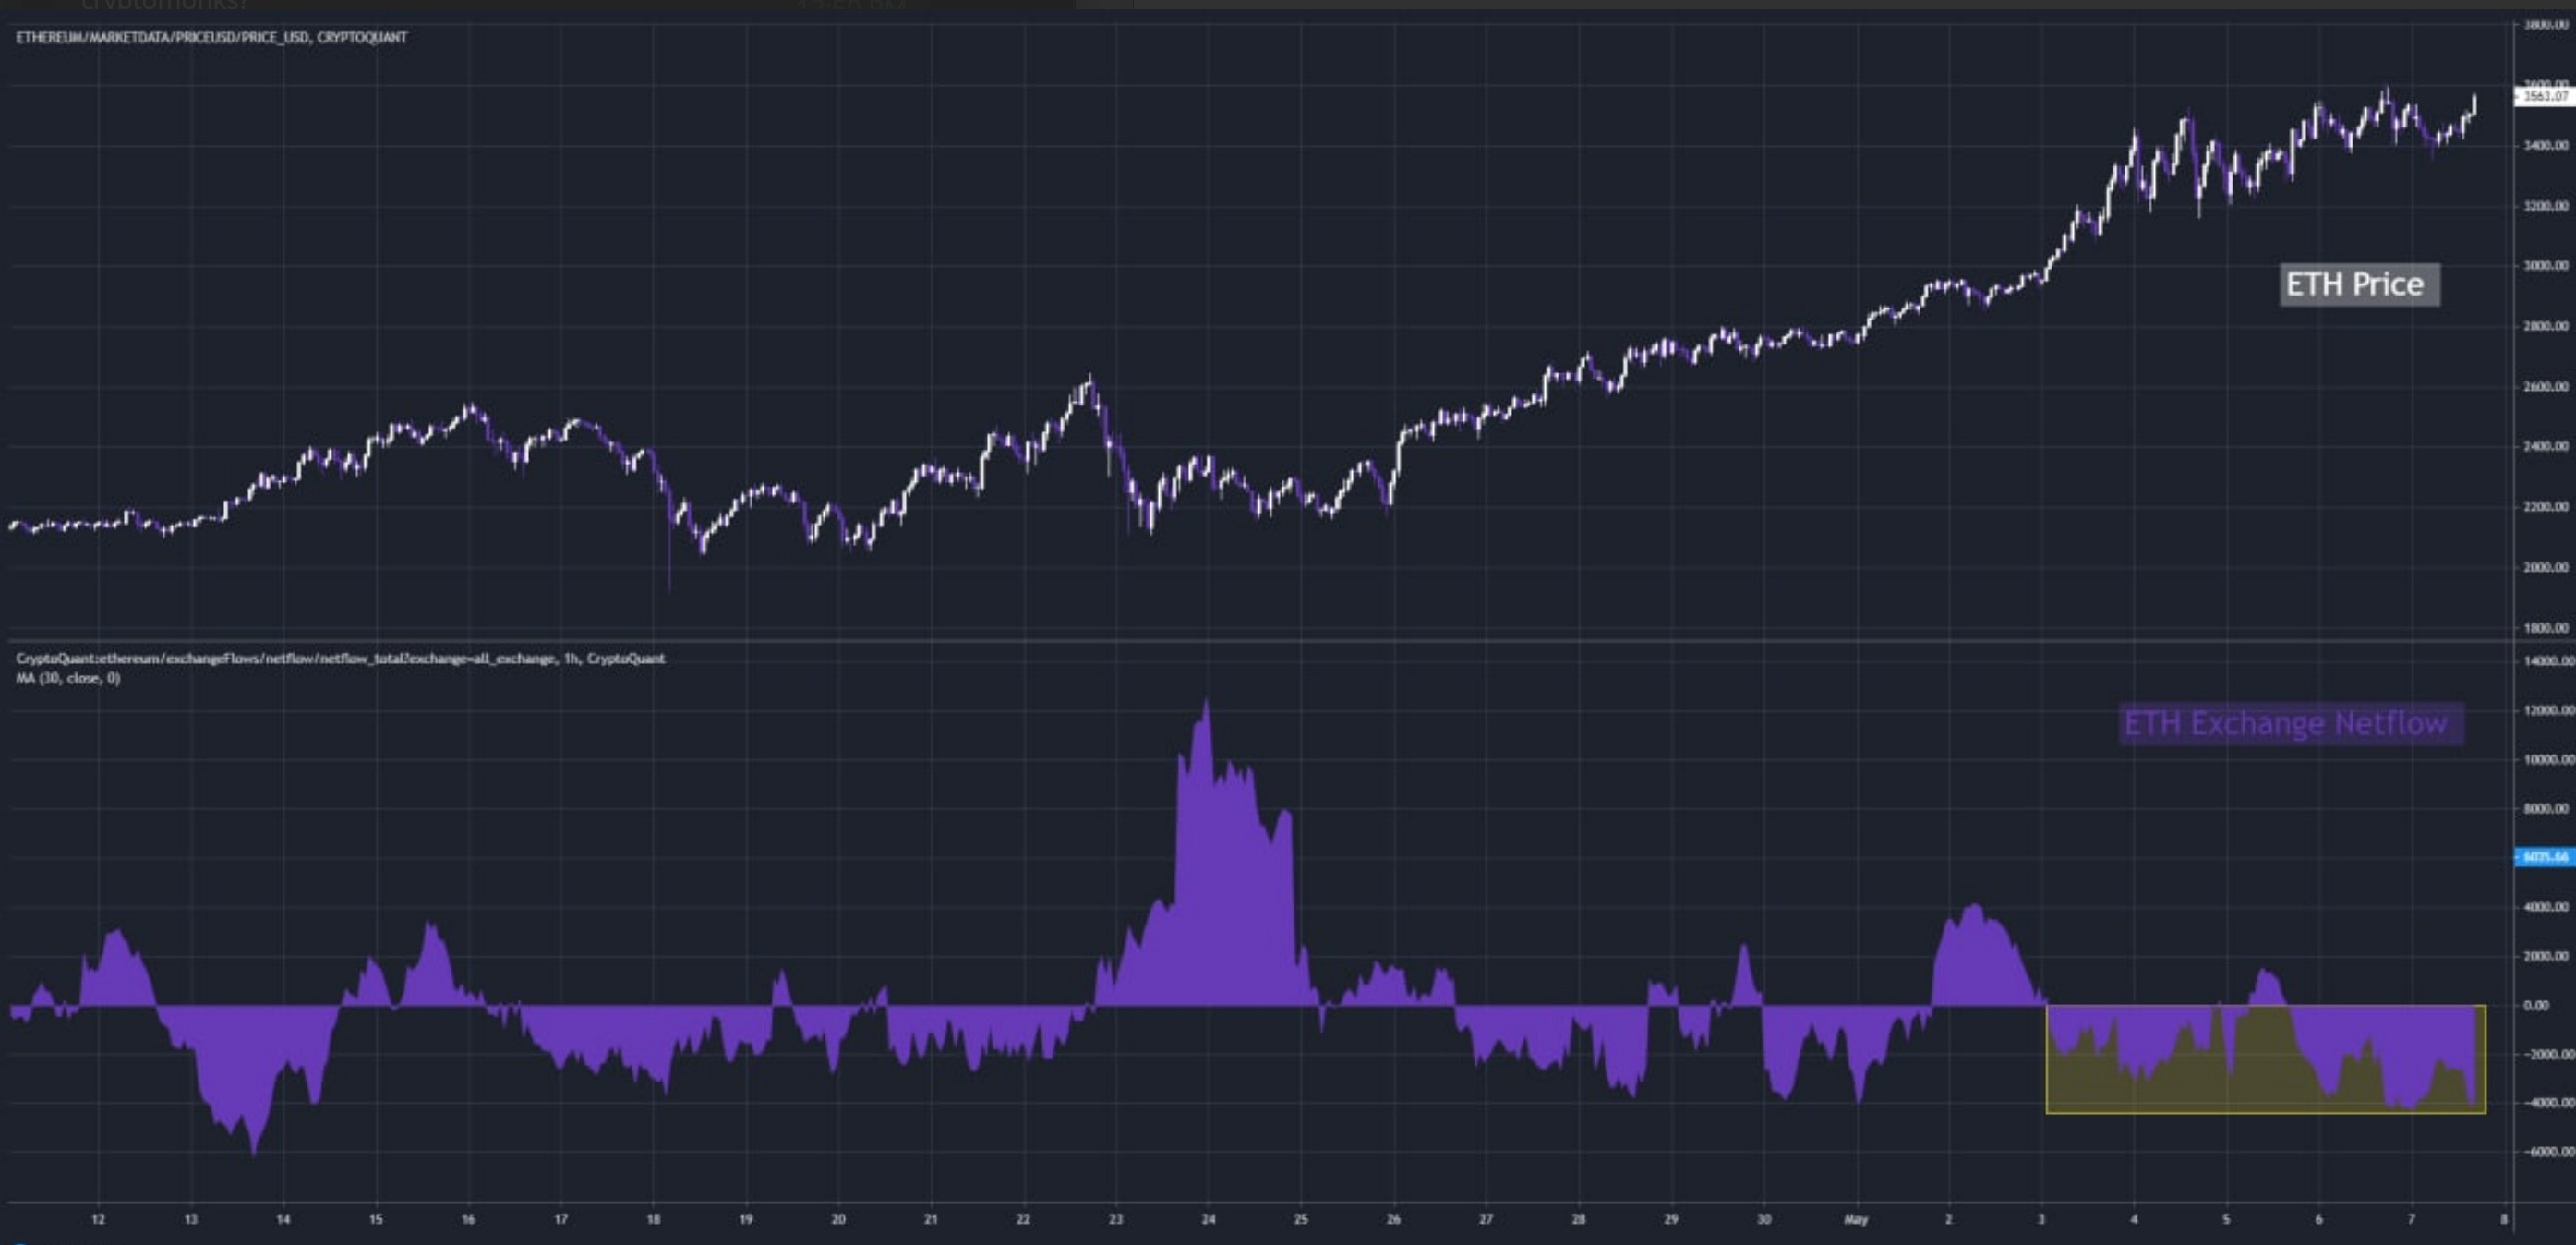
Netflows are consistently negative since May 3rd.
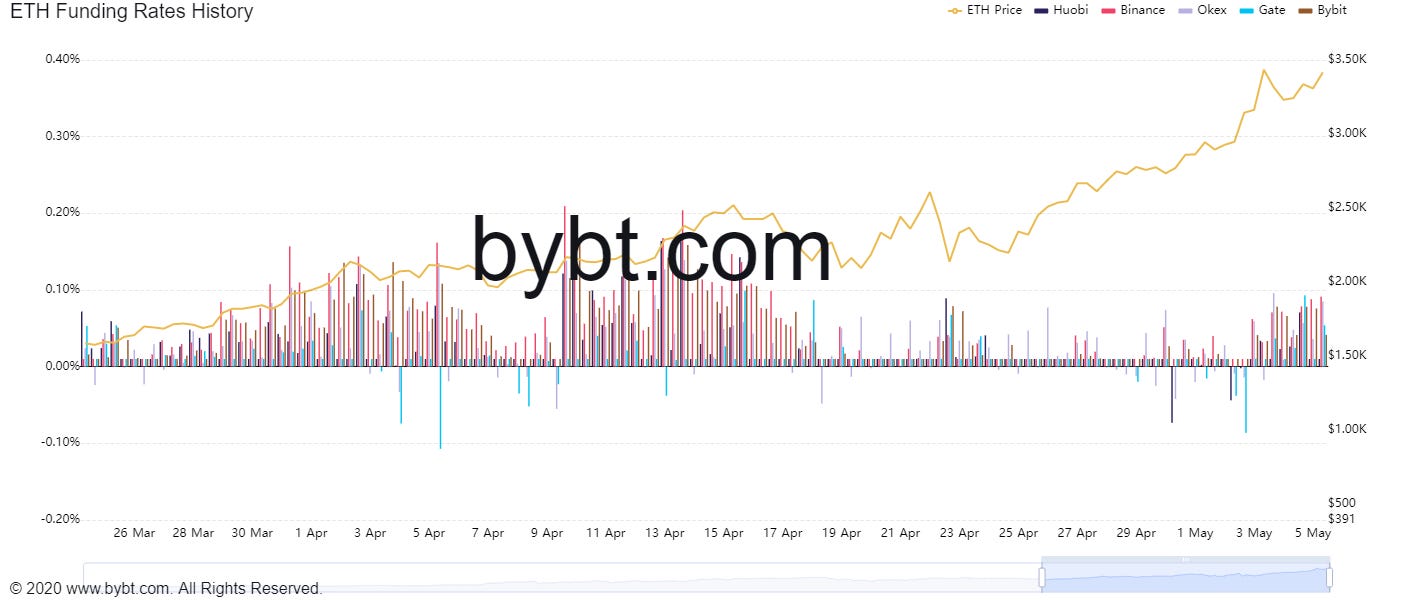
Furthermore, the run up to 3.5 was primarily driven by spot buying as funding rates remained very low.
This means derivative traders won’t be closing out their positions since they don’t have profits to lock in yet.
However, now that price has already broken we just noticing some uptick on funding rates as price whips off $3.5k. Nothing to get alarmed about yet.
Finally, when we pair this up with the weekly ETH/BTC chart, we can see ETH is in full breakout mode:
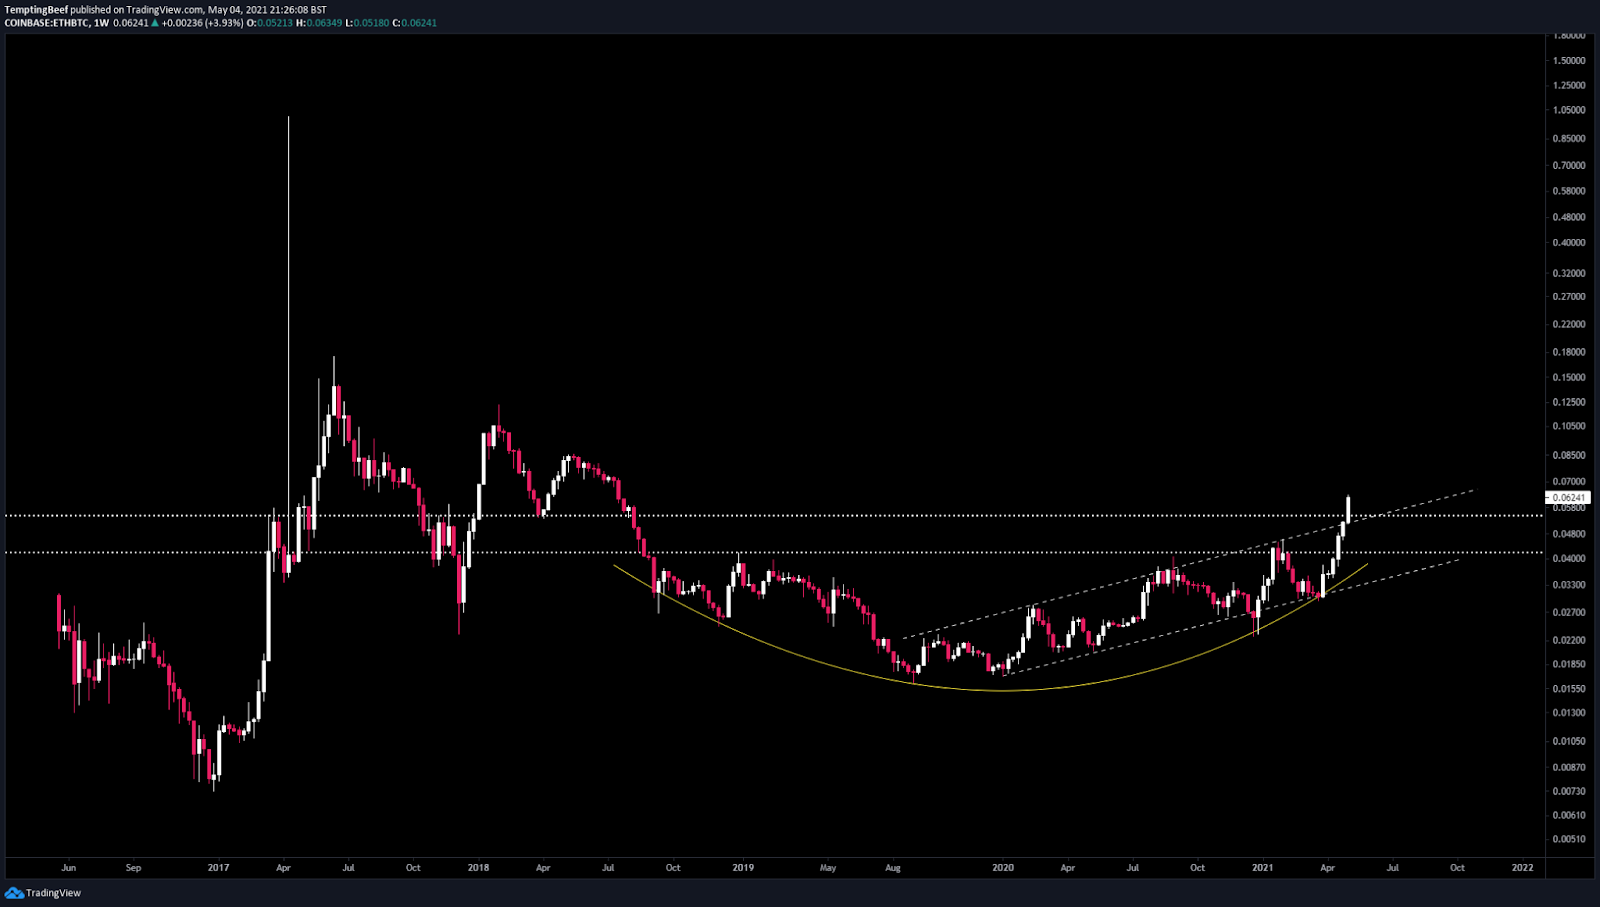
High demand, low supply, price clearing resistance, and room for funding to rise even more.
It’s a perfect concoction for an exciting and volatile weekend ahead for Ethereum.
Serving on-chain cuts,
@tempting_beef


