Bitcoin Trading Cheat Codes
Guest Essay from @TemptingBeef


Today we have a very special guest. It’s @Tempting_beef who writes The Coin Crypt at substack. He’s joining us today to talk about how he approaches the market. We think this piece offers a great explanation for how to use on-chain exchange flows with technical analysis (TA) in order to improve your trading. Consider it a nice primer.
Now, one thing you might be asking yourself is if this is promotional or paid content. The answer is no. This is content we helped curate because we believe it is valuable to you. Espresso is a place of conversation where the best in the arena can voice their thoughts. This includes you!
So if you want to write something please reach out to (ben.lilly@jarvis-labs.xyz), we are willing to work with you so showcase your insights that others may benefit from.
Without further ado, here’s Bitcoin Trading Cheat Codes. Enjoy!
Ben Lilly, Editor of Espresso.
I feel dirty.
Everyday at five o’clock I emerge from the dark underbelly of today's big data economy.
I work with digital analytics systems to capture your data on websites for companies like Google and Facebook.
The data is startling.
I’m able to see your ip address, what pages you visit, and what you type into the search bar.
I send this data to centralized advertising systems that collect your information from many different websites and build profiles of your activity online. This amounts to terabytes, even petabytes of data that need to be crunched every minute for the sole purpose of maximizing advertising revenues.
Companies pay serious dollars for this service. Prior to COVID-19 I would attend decadent conferences, get schmoozed by companies around the globe, and stay at the fanciest of resorts.
And frankly, this is not why I got into data and analytics. I do not want to enable organizations to harvest your data just so they can bombard you with “more relevant” advertisements. This ultimately led me to bitcoin.
The transparency is embraced. And for an analytics guy like myself, I was able to draw a gauntlet of insights.
Currently the bitcoin blockchain sits at around 330gb, and every block contains between 2500-3000 transactions. The block size limit ensures this is never going to change. And due to the design of bitcoin and the difficulty level, one block will always be added roughly every 10 minutes.
So, really, the problem we face from a data perspective is:
- Analyzing 300gb of historical data, an amount that’s a mere crumb when viewed by a data scientist as they deal with terabytes on a regular basis.
- Analyzing 3000 transactions every 10 minutes - at this point the data scientist begins to laugh as it’s once again a pinhead amount.
Despite the relative size of the data we’re working with compared to advertising and digital analytics, on-chain data and tracking is still extremely powerful. So powerful in fact, its helped track and catch criminals.
More importantly for our purposes, it can be used to predict price. Which is what I’ll be talking about today. To do so, let’s look at a few examples of how on-chain analytics and tracking can help you predict the next price move.
Know the Flow
Analyzing exchange flows is a great place to start for newcomers.
That’s because you can get a read on supply and demand, and see how it correlates with support and resistances identified via technical analysis.
So to start, let’s look when price broke out above 30k. You might remember price was moving faster than just about anybody could keep up with.
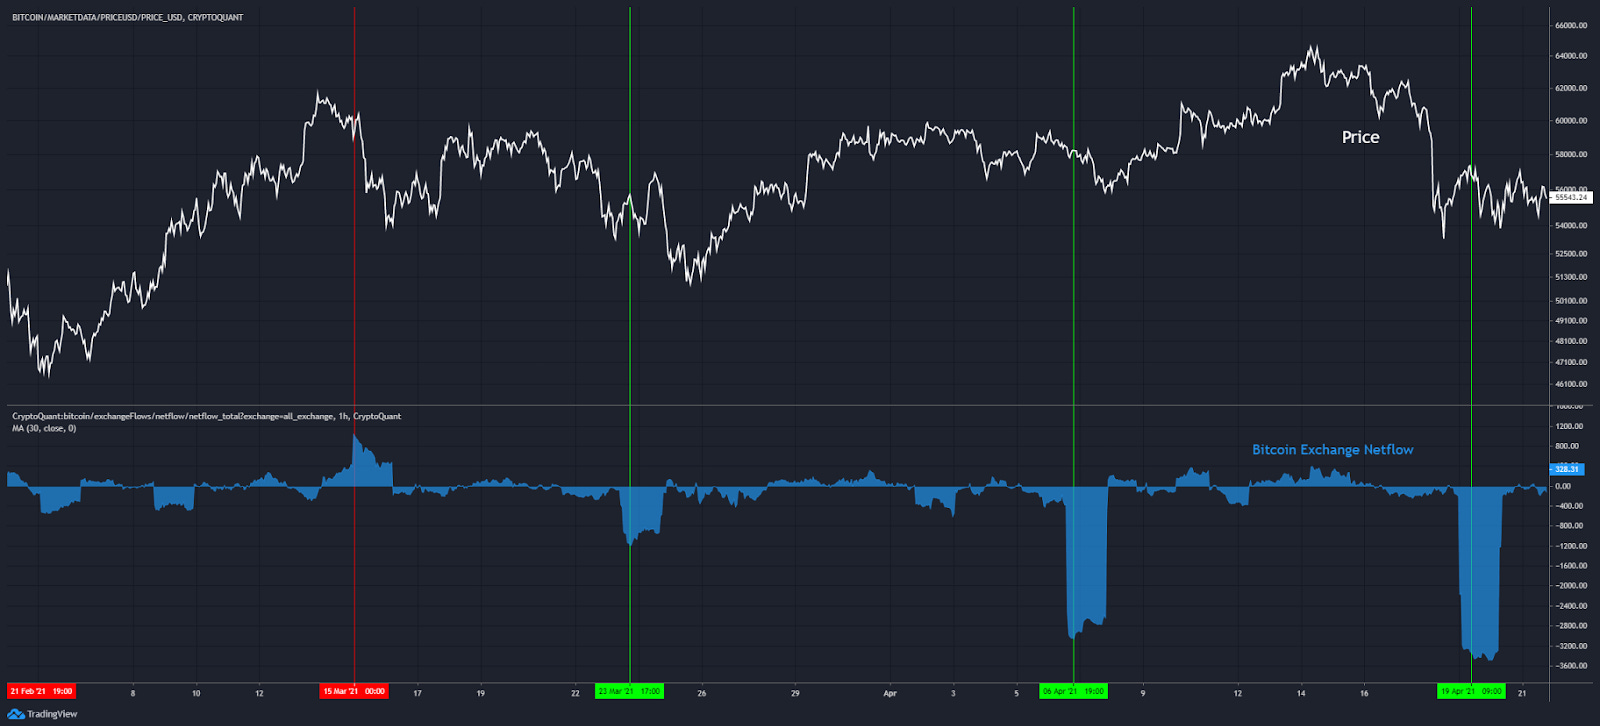
What’s interesting is the signals for this price action were seen on-chain both before and after the breakout. To find it I’ll pull up a chart with exchange netflow. It’s the difference between inflows and outflows. A negative number indicates the exchange has less bitcoin or stablecoins than it had prior.
In the chart below I’ve added netflow total to the bottom half and then applied a 30-day moving average to smooth it out. The white line is price.
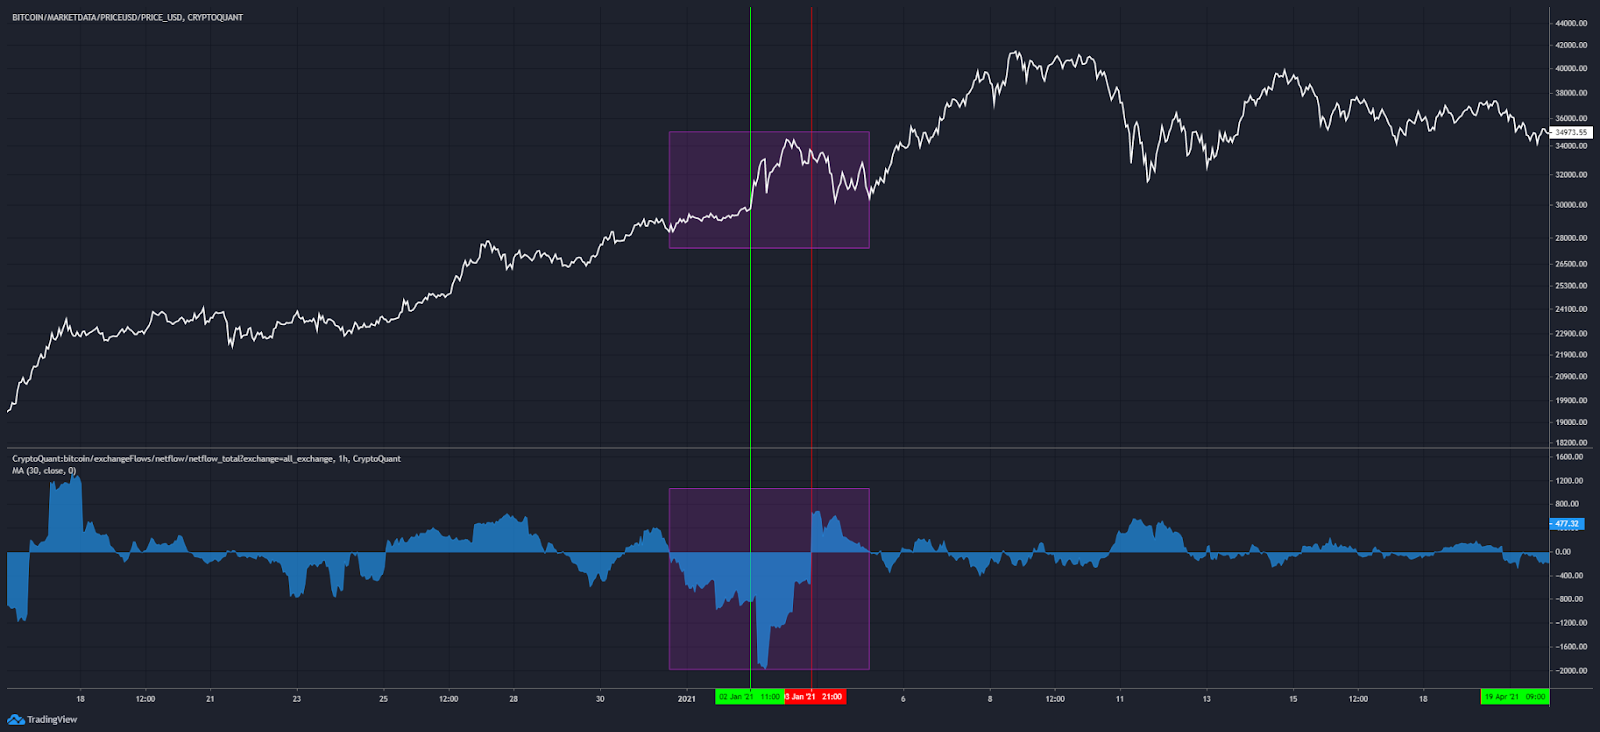
Prior to the breakout, netflow was already quite negative - this is highlighted with the green vertical line. Bitcoin was being transferred off exchanges and likely into cold storage. This is bullish as it takes bitcoin off the market where it’s no longer available for sale - creating scarcity.
Pivoting over to the technical analysis, there was a resistance level forming at 30k in addition to the price being a psychological resistance.
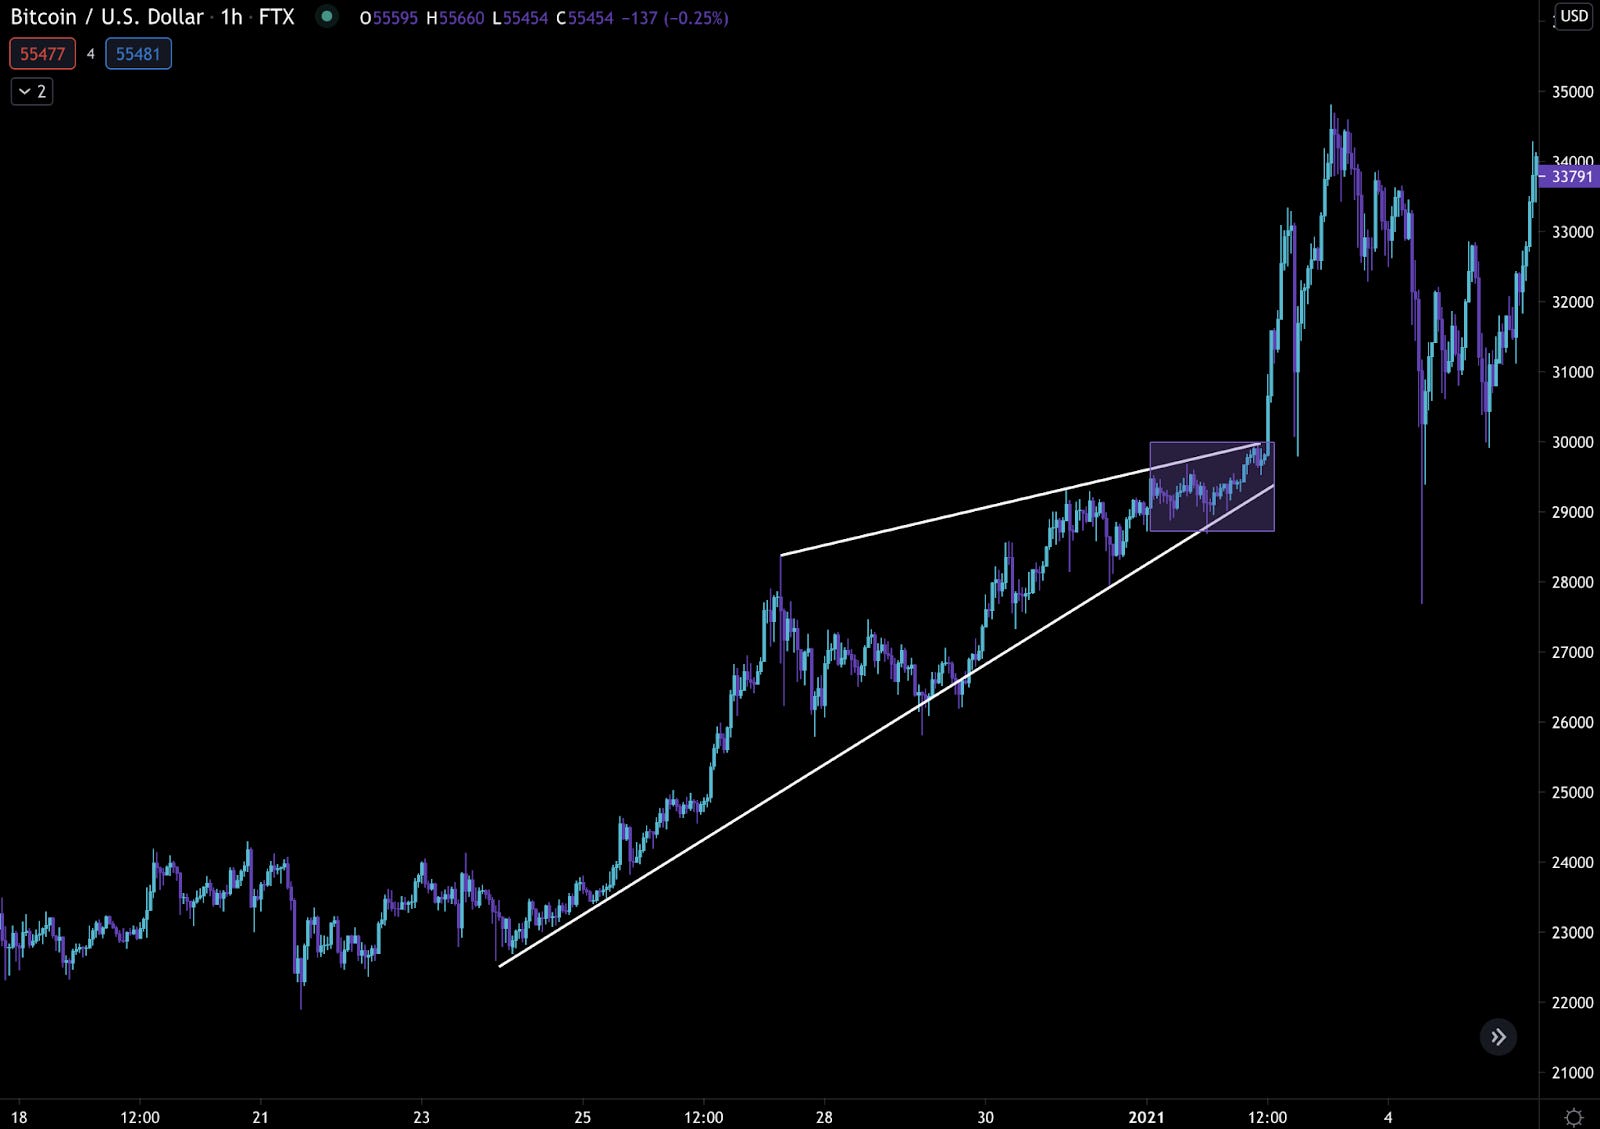
So when we pair up the technicals with the trend of netflows we’re able to get a clearer picture that the chances price breaks resistance was increasing.
We don’t stop there.
We can look at more than just bitcoin. Stablecoins is arguably the second best statistic in terms of exchange flows, and it’s one I frequently cover over at my newsletter: The Coin Crypt Newsletter.
That’s because with more stablecoins entering exchanges, this is likely to translate to more buying pressure. If stablecoins are leaving, that means there’s less ammo to push prices higher. To translate loosely, more stablecoins is bullish. Less stablecoins is bearish.
During the same period, inflows of stablecoins was well above average. In fact they were flowing into exchanges at a record pace leading up to the breakout. You can see it in the vertical green line and blue bar graph at the bottom half of the chart below.
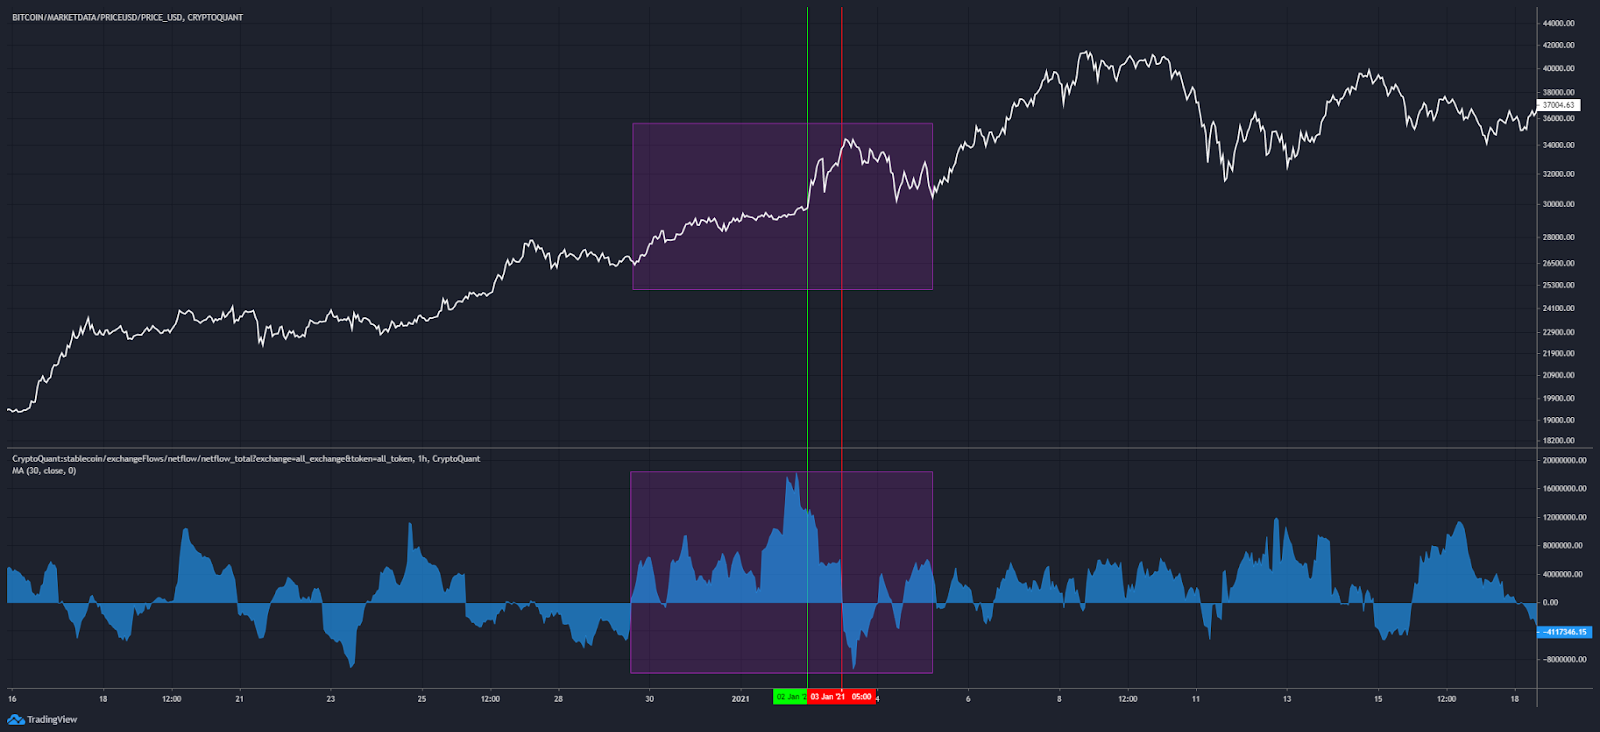
So, distilling this down into supply and demand:
- Supply was decreasing - bitcoins were leaving exchanges.
- Demand was increasing - stablecoins were entering exchanges.
Laying on TA:
- Price is approaching overhead resistance.
The picture gets clearer with these added dimensions. Demand was exceeding supply at a point of interest - resistance. This is what led to the fast price action we saw earlier this year where price ripped.
The Change in Current
Ok, so you know when to buy, but when to sell using on-chain signals?
That’s where the red lines in the chart above come in, as we see netflows for both measures flip in the other direction.
To say it differently, supply began to overtake demand.
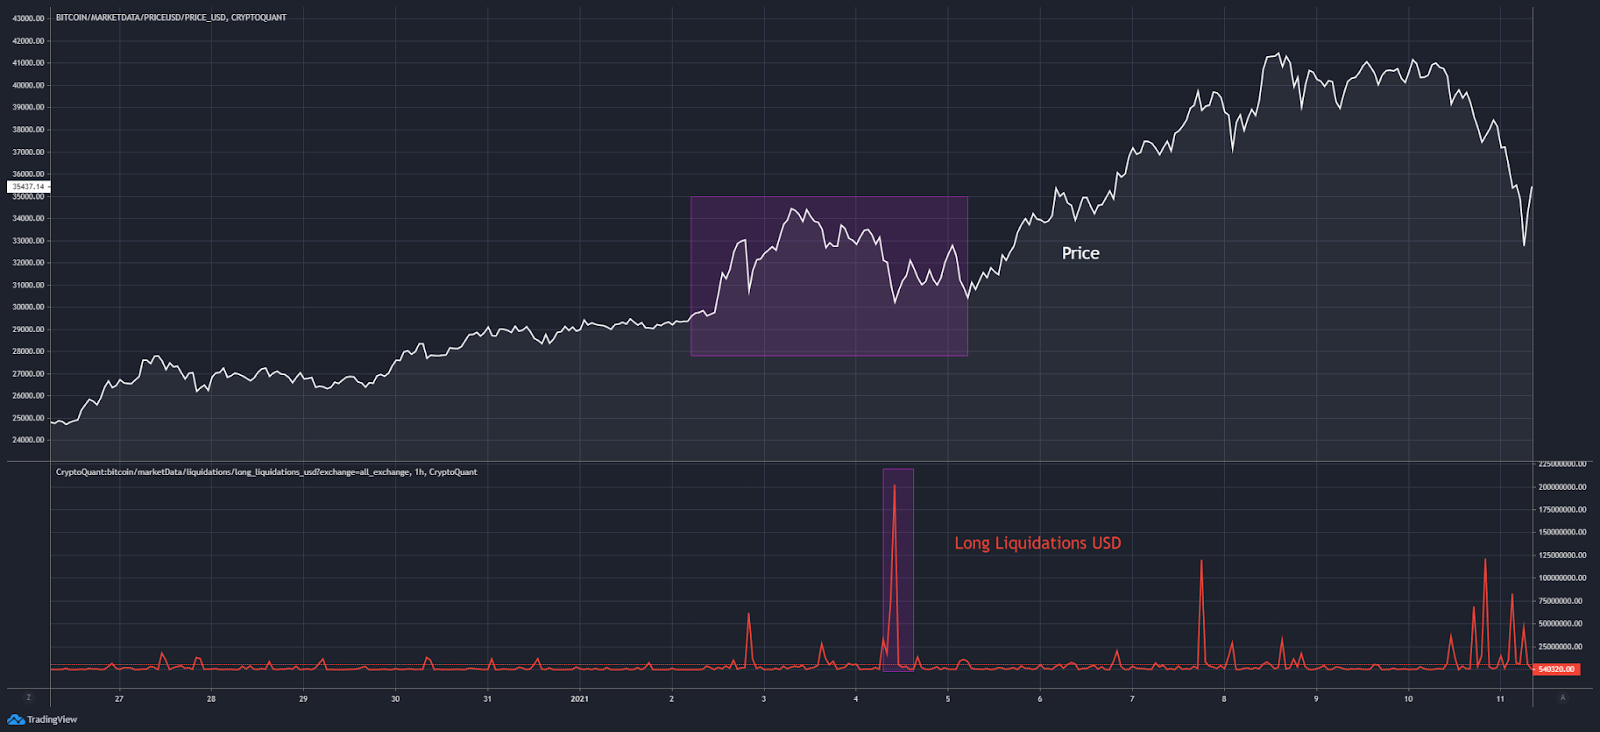
Looking at the price chart below, we were aggressively testing the resistance at the newly formed high set by the initial breakout.
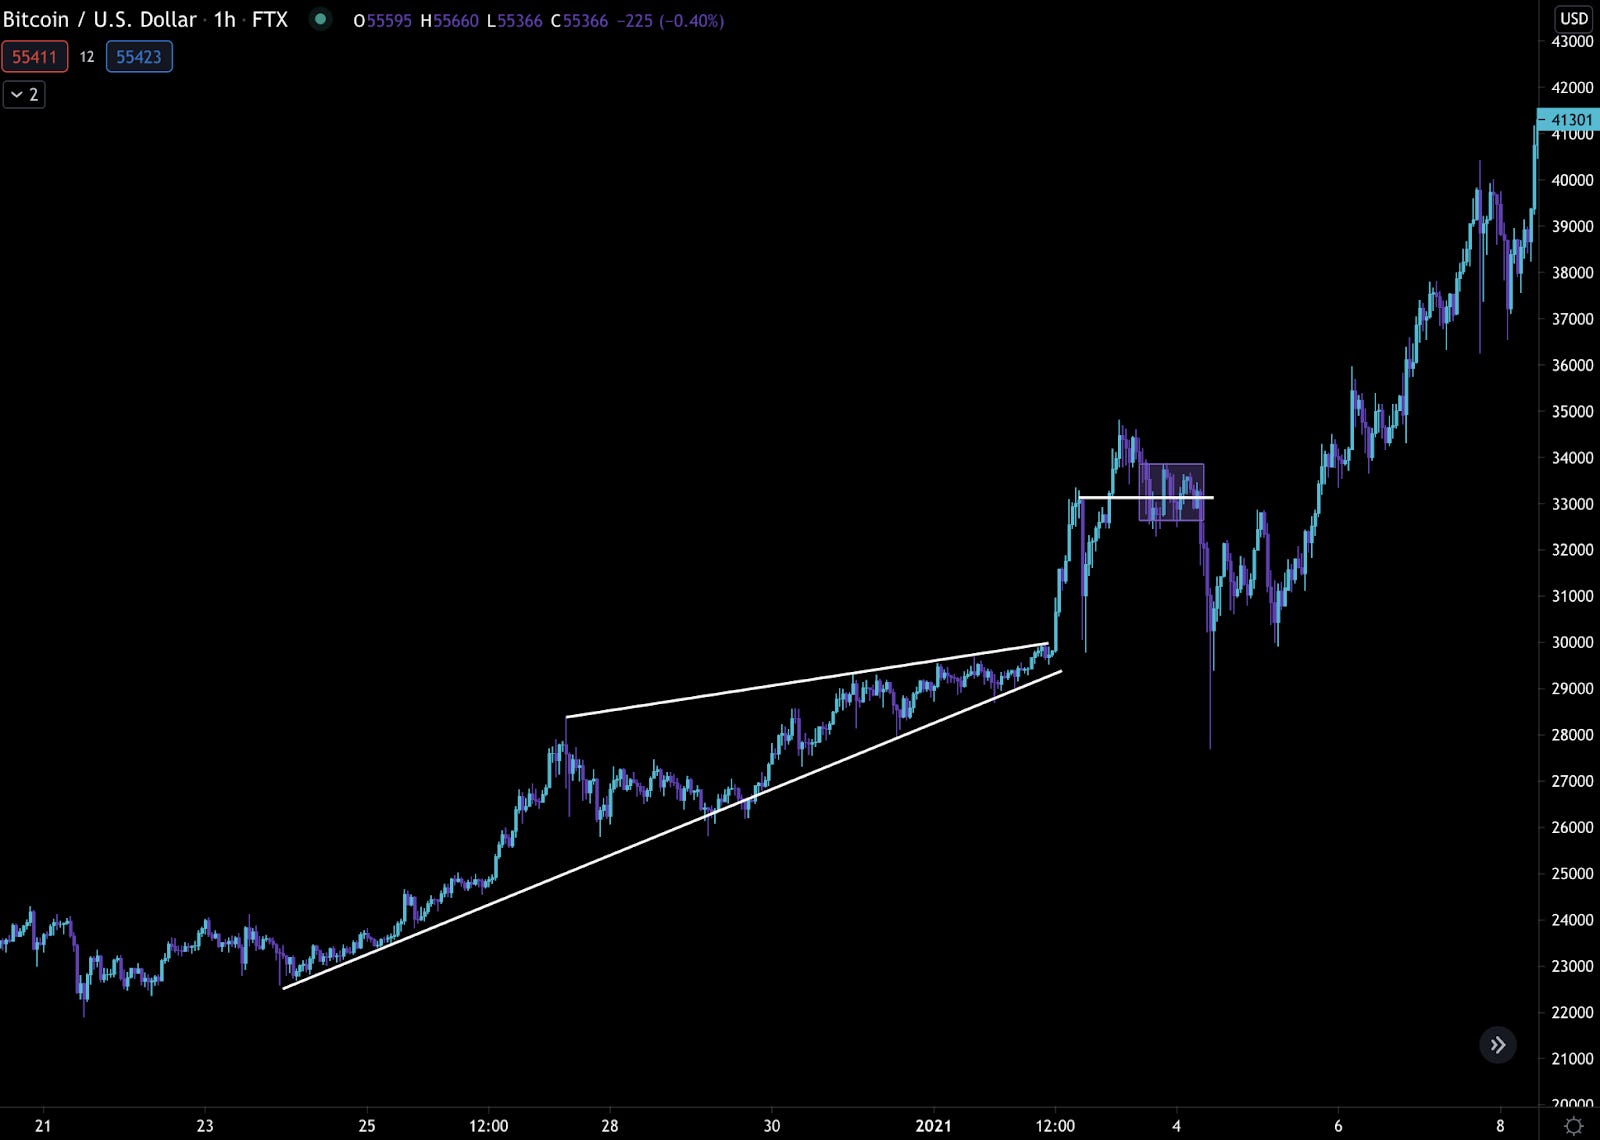
As we are testing this range we have:
- Supply increasing - more bitcoin entering exchanges than leaving.
- Demand decreasing - more stablecoins were leaving exchanges than entering.
Layering in TA:
- Price is testing support.
This is how on-chain can give you an advantage. As price tested support, supply exceeded demand. This was the sell signal to close your long.
Those that missed the signal became collateral damage in what was the largest liquidation event in the bull run at the time. You can see the liquidation figure in the red line within the chart below.
This is how on-chain can give us a signal that can be paired up with technical analysis. It’s how we can gain an edge in predicting price’s next move.
Now, before we wrap it up let’s quickly take a look to see what’s currently going on in the market using the same set of indicators.
The Flow Forecast
Bitcoin recently tried breaking out last week around the time of the Coinbase listing. It was rejected and subsequently broke to the downside. Support was found around 53k.
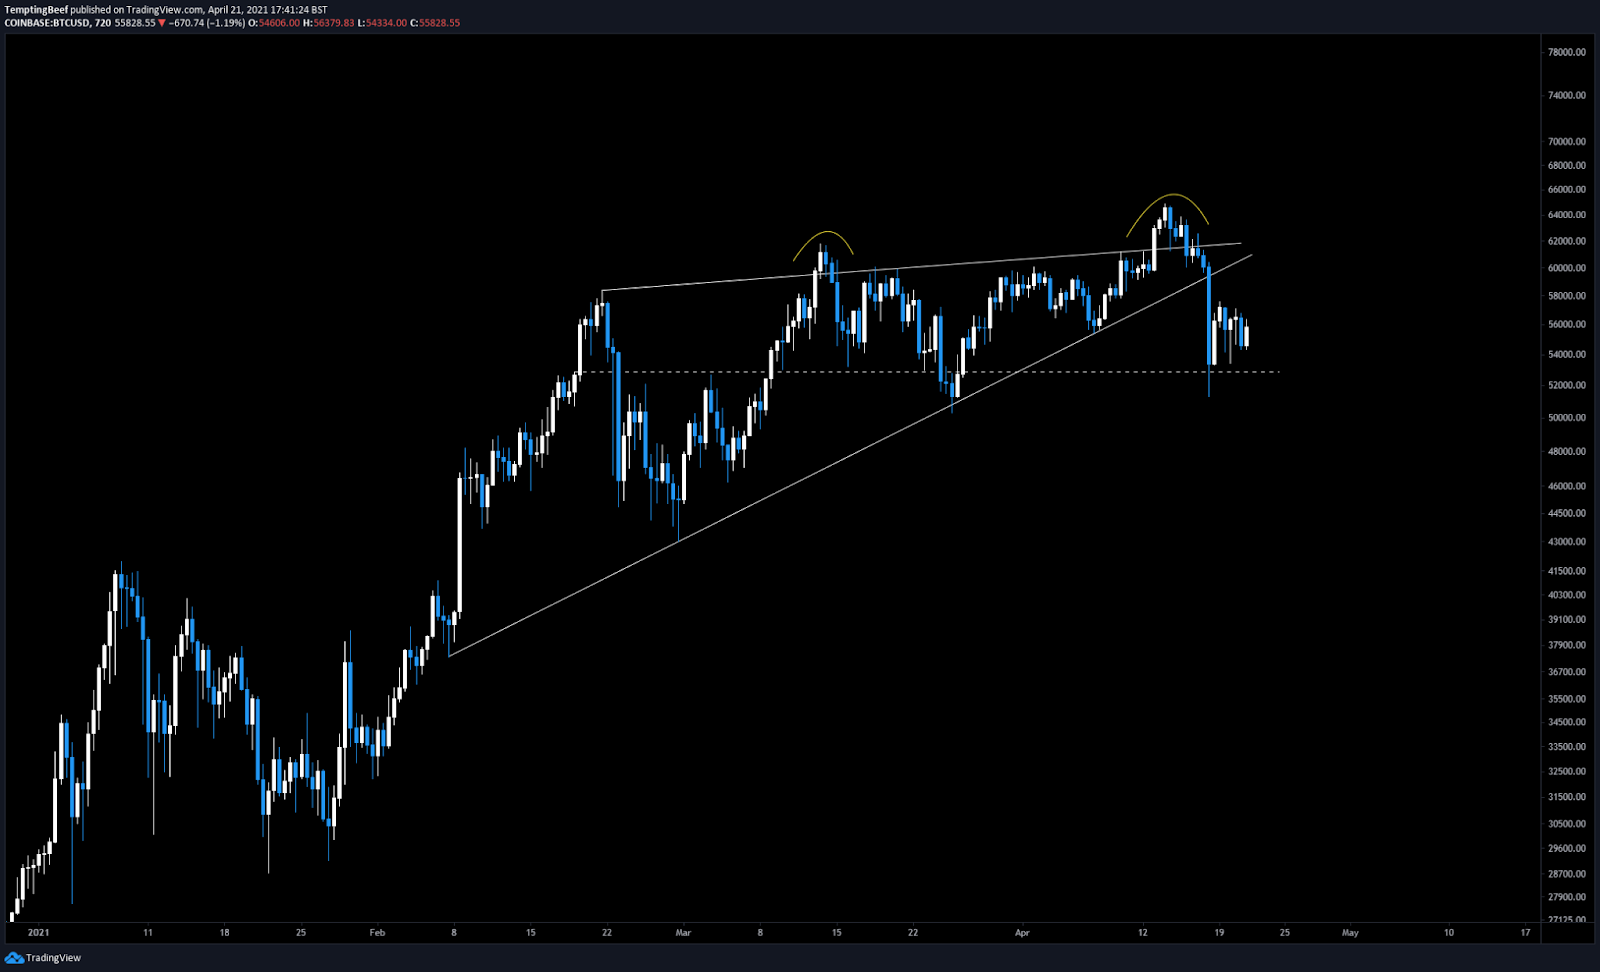
This dip resulted in another record breaking amount of liquidations, near $10bn over a 24 hour period.
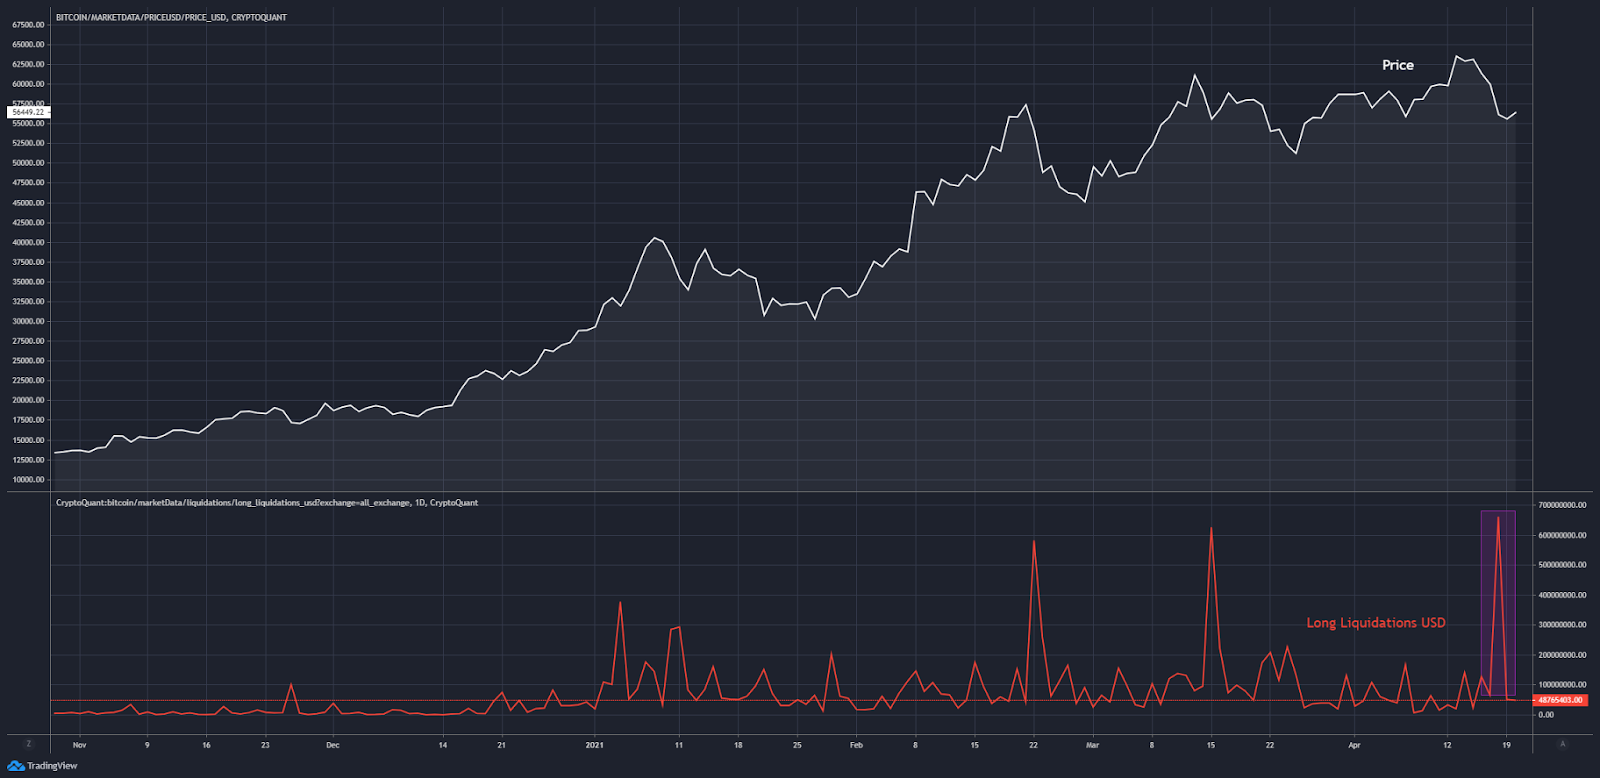
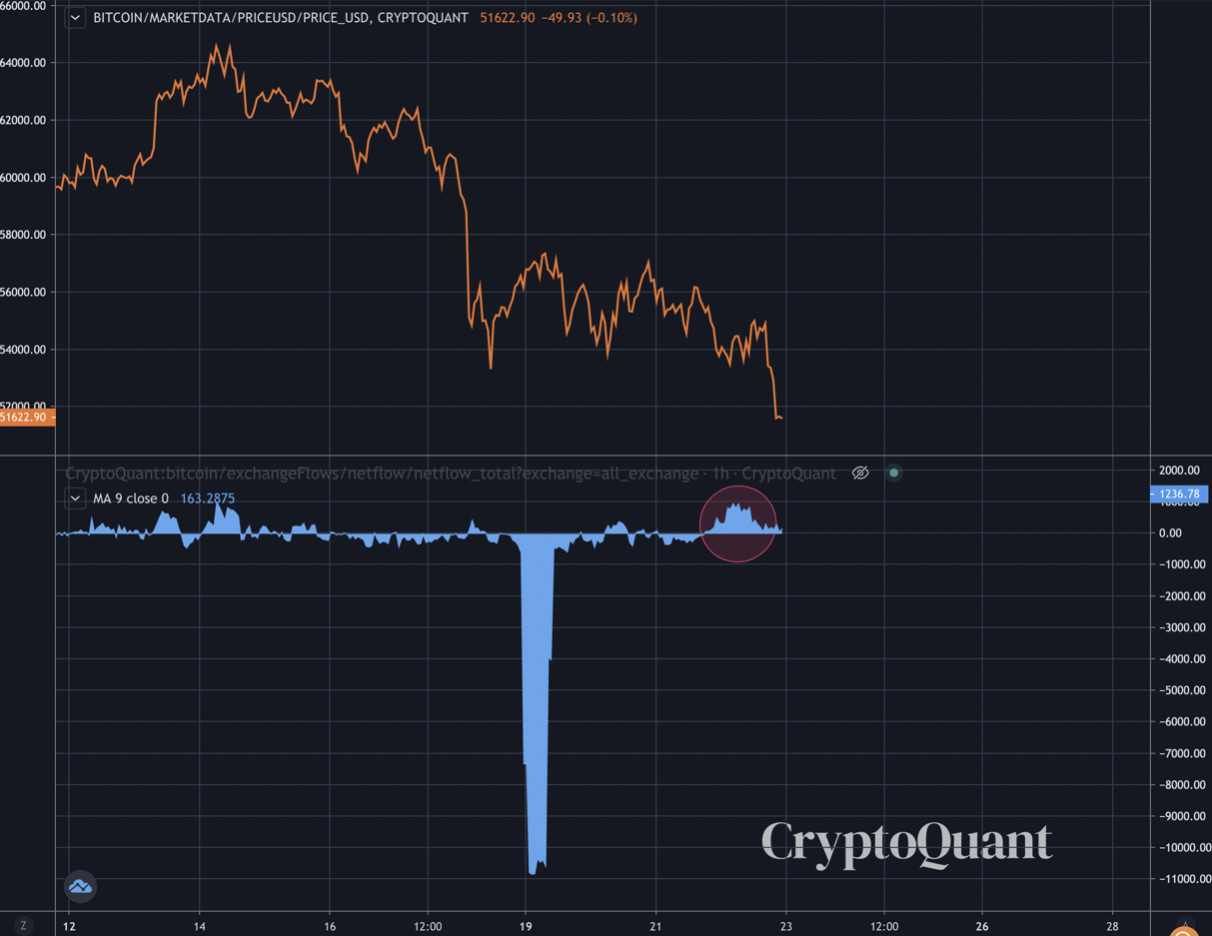
Despite this, bitcoin netflows are bullish. In fact, we’re seeing some of the largest outflows of bitcoin from exchanges in recent months. You can see it with the major readings of the blue indicator in the chart below.
The large blue readings with green lines can be interpreted as bullish. As you can see, there was a massive outflow of bitcoin, suggesting larger players bought the dips.
And based on prior readings these significant outflows are lagging, in terms of influencing price. A price reversal isn’t something that happens at the snap of one’s fingers.
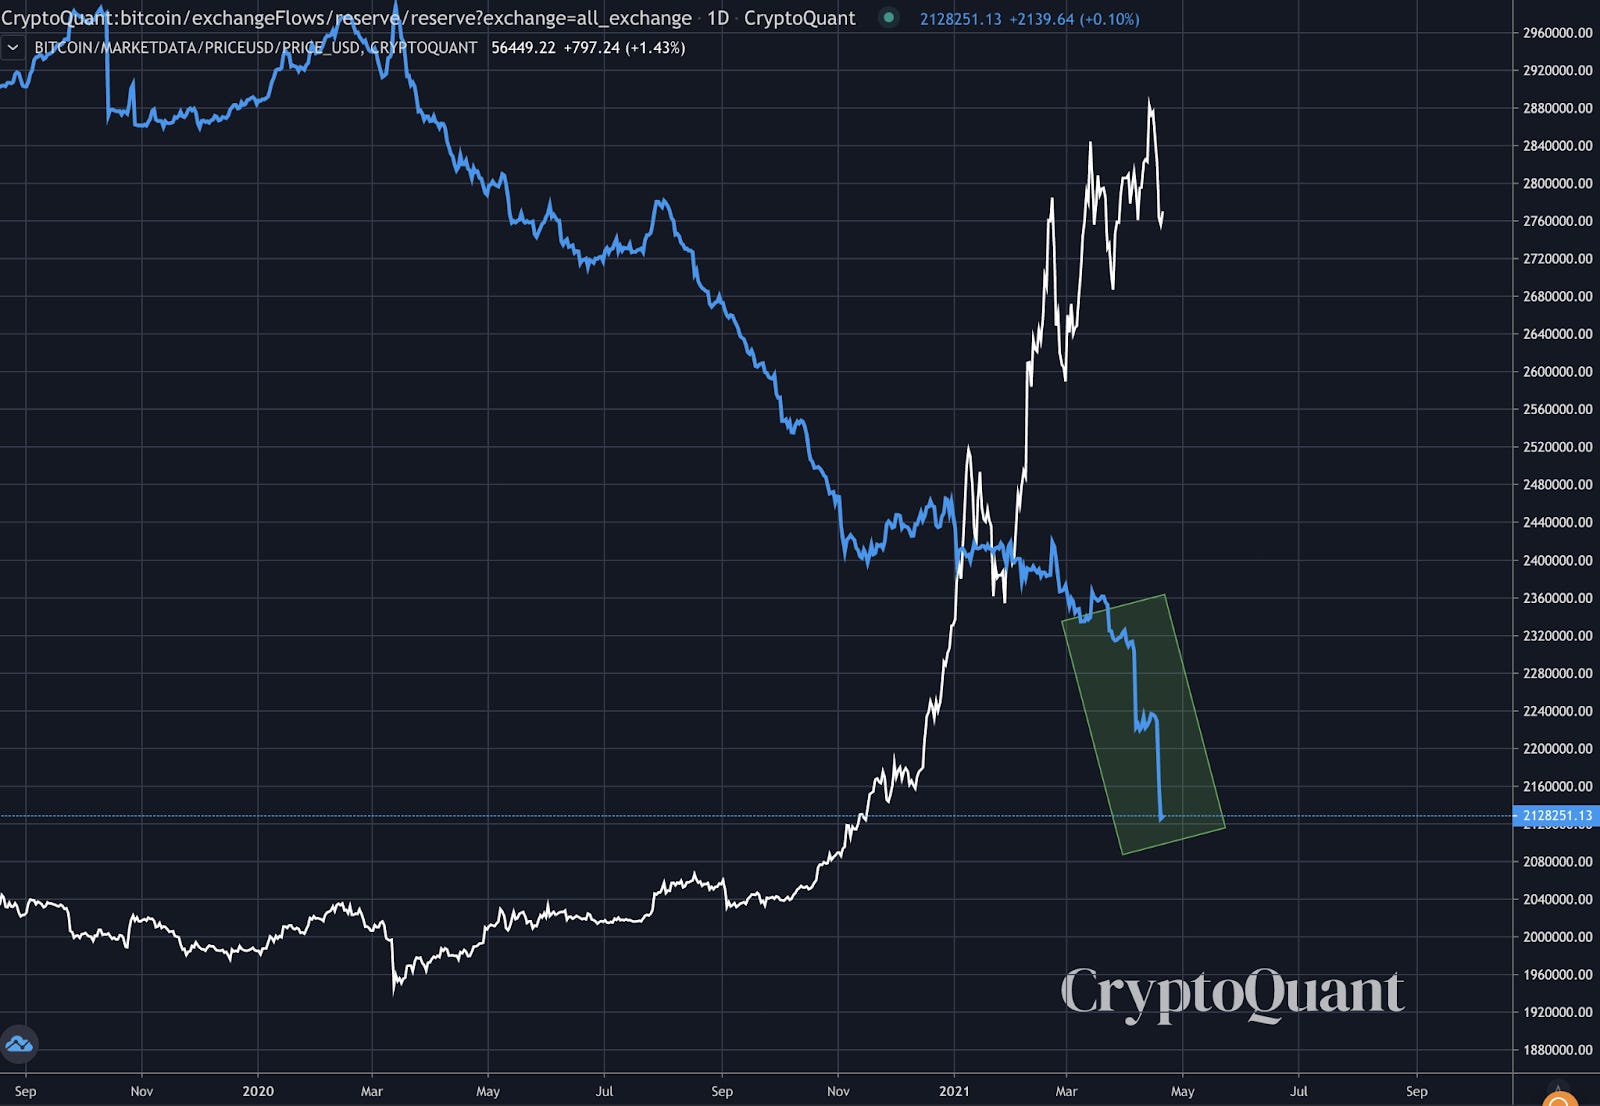
If we back up a bit and see what these netflows are doing in terms of exchange reserves. Reserves are going vertical…
Vertically down.
This illustrates just how large these outflows are impacting the big picture.
Stablecoin netflows are interesting as well.
We currently saw stablecoins oscillating a bit. Stablecoins entered exchanges during the dip, and more recently since the dust settled. This means there’s sufficient liquidity to buy assets.
It’s also a good sign as we continue sideways because we’re not witnessing excessive profit taking.
In terms of the big picture of stablecoin flows… Reserves of stablecoins are growing again, fast. This is generally a signal of growing demand.
When we pair this information with TA, we can begin to form a roadmap of what to watch for.
Price is consolidating after the drop. And as this pattern progresses, supply of BTC on exchanges is dropping while demand via stablecoin inflows grow. This is a good sign for higher prices in the long-term.
But honestly, it’s not enough to draw a clear trade in the short-term.
If price gains momentum and tests resistance to the upside, I’d want to see another flash of bitcoin outflows or a jump in stablecoins inflows to gain confidence. Or, wait to see what happens near support and possibly consider shorting if netflows look bearish.
Last minute update: (Ben here) - Bitcoin dropped to $51k prior to publishing. This piece was written about three days ago. Here are the netflows for bitcoin as it sat on support, notice the red circle. Bitcoin was flowing into exchanges as price tested support - bearish.
Stablecoins flipped bearish as well slightly before the selloff.
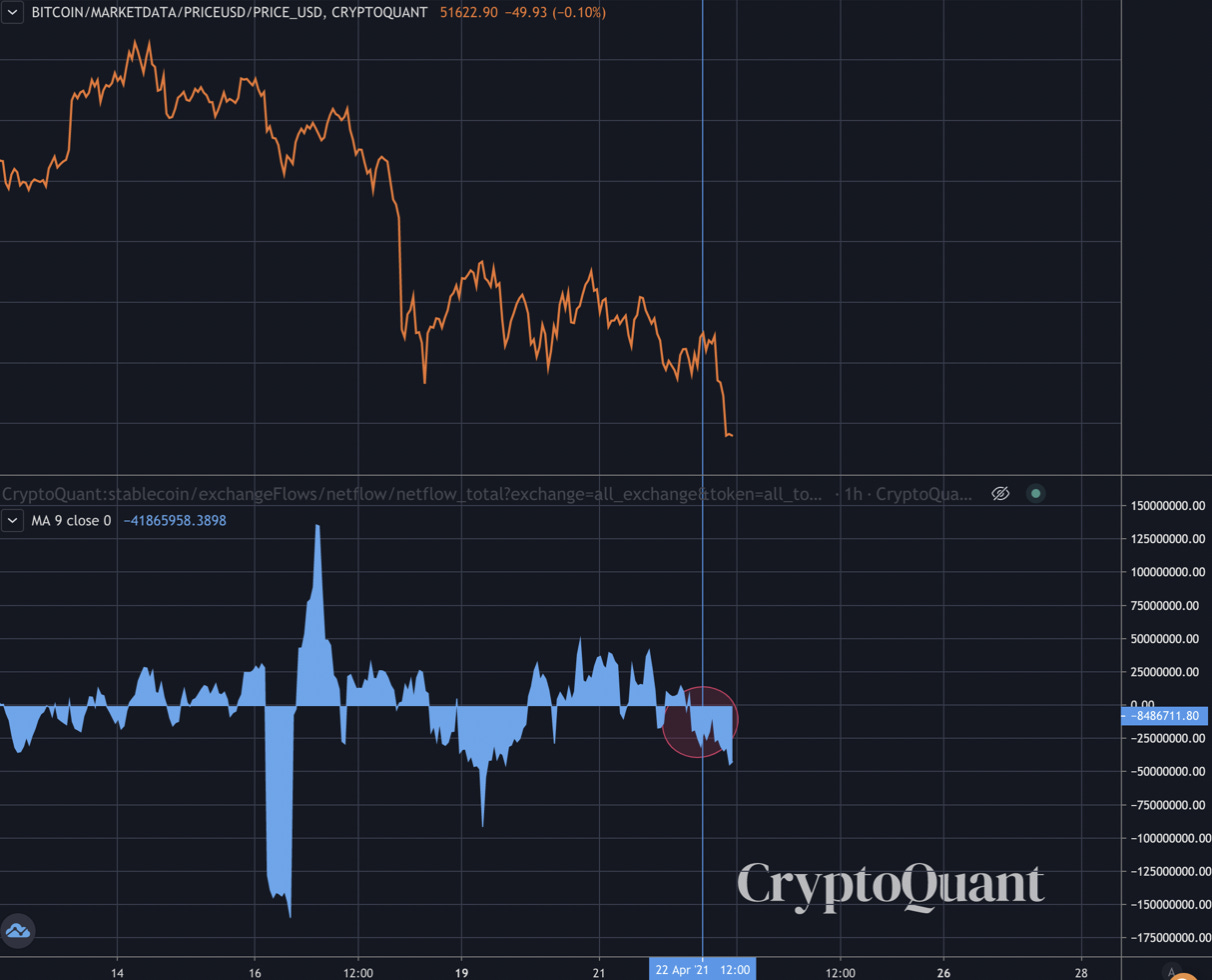
As of this writing (23:30 UTC, April 22) ChainPulse picked up 7.53k BTC being sent to exchanges. Also, 571k LINK moved in. There were also about 18 million stablecoins flowing out. Bearish flows, not at all the time to go long.
There you have it.
Hopefully this piece helps you understand why netflows are a helpful tool in determining potential price direction, and how to pair it up with TA.
Be sure to follow me @tempting_beef on twitter where I’ll keep you up to date on my thoughts and analysis.
Serving on-chain cuts,
@Tempting_beef
P.S. - Ben here. I noticed a lot of people coming in from Korea (@naver.com). If you are one of these readers and would like to translate, please reach out to me at ben.lilly@jarvis-labs.xyz.


