Wise Advice
End of Week ChainPulse Update


It’s Friday.
Which means this is short and to the point.
Today we’ll provide you with an update on our Chart of the Week, a few ChainPulse metrics, and a chart from one of our guest analysts.
But before we get to the Chart of the Week… Let’s first look at a few interesting transactions that Jarvis AI saw over the last few days.
Recall on Wednesday we mentioned the major exchange outflows of ETH and Link. Well price responded within 48 hours and they rose 20% and 36%, respectively.
That’s a major move. And it’s important to note we’re beginning to see transactions create more noticeable and immediate moves like this. It seems to be a new trend taking place.
In terms of what we’ve seen lately outside of those major moves… There was one pattern that stuck out in 24hr exchange flows. Here’s what ETH exchange flows looked like over the last 72 hours…
Tuesday: 123k ETH leaving
Wednesday: 34k ETH leaving
Thursday: 48k ETH leaving
Pretty consistent.
When we overlay that data with our Liquidity Crisis issue on ETH, it gets interesting. Recall that in the analysis we detailed the supply crunch taking place. These flows tell us the trend is picking up speed.
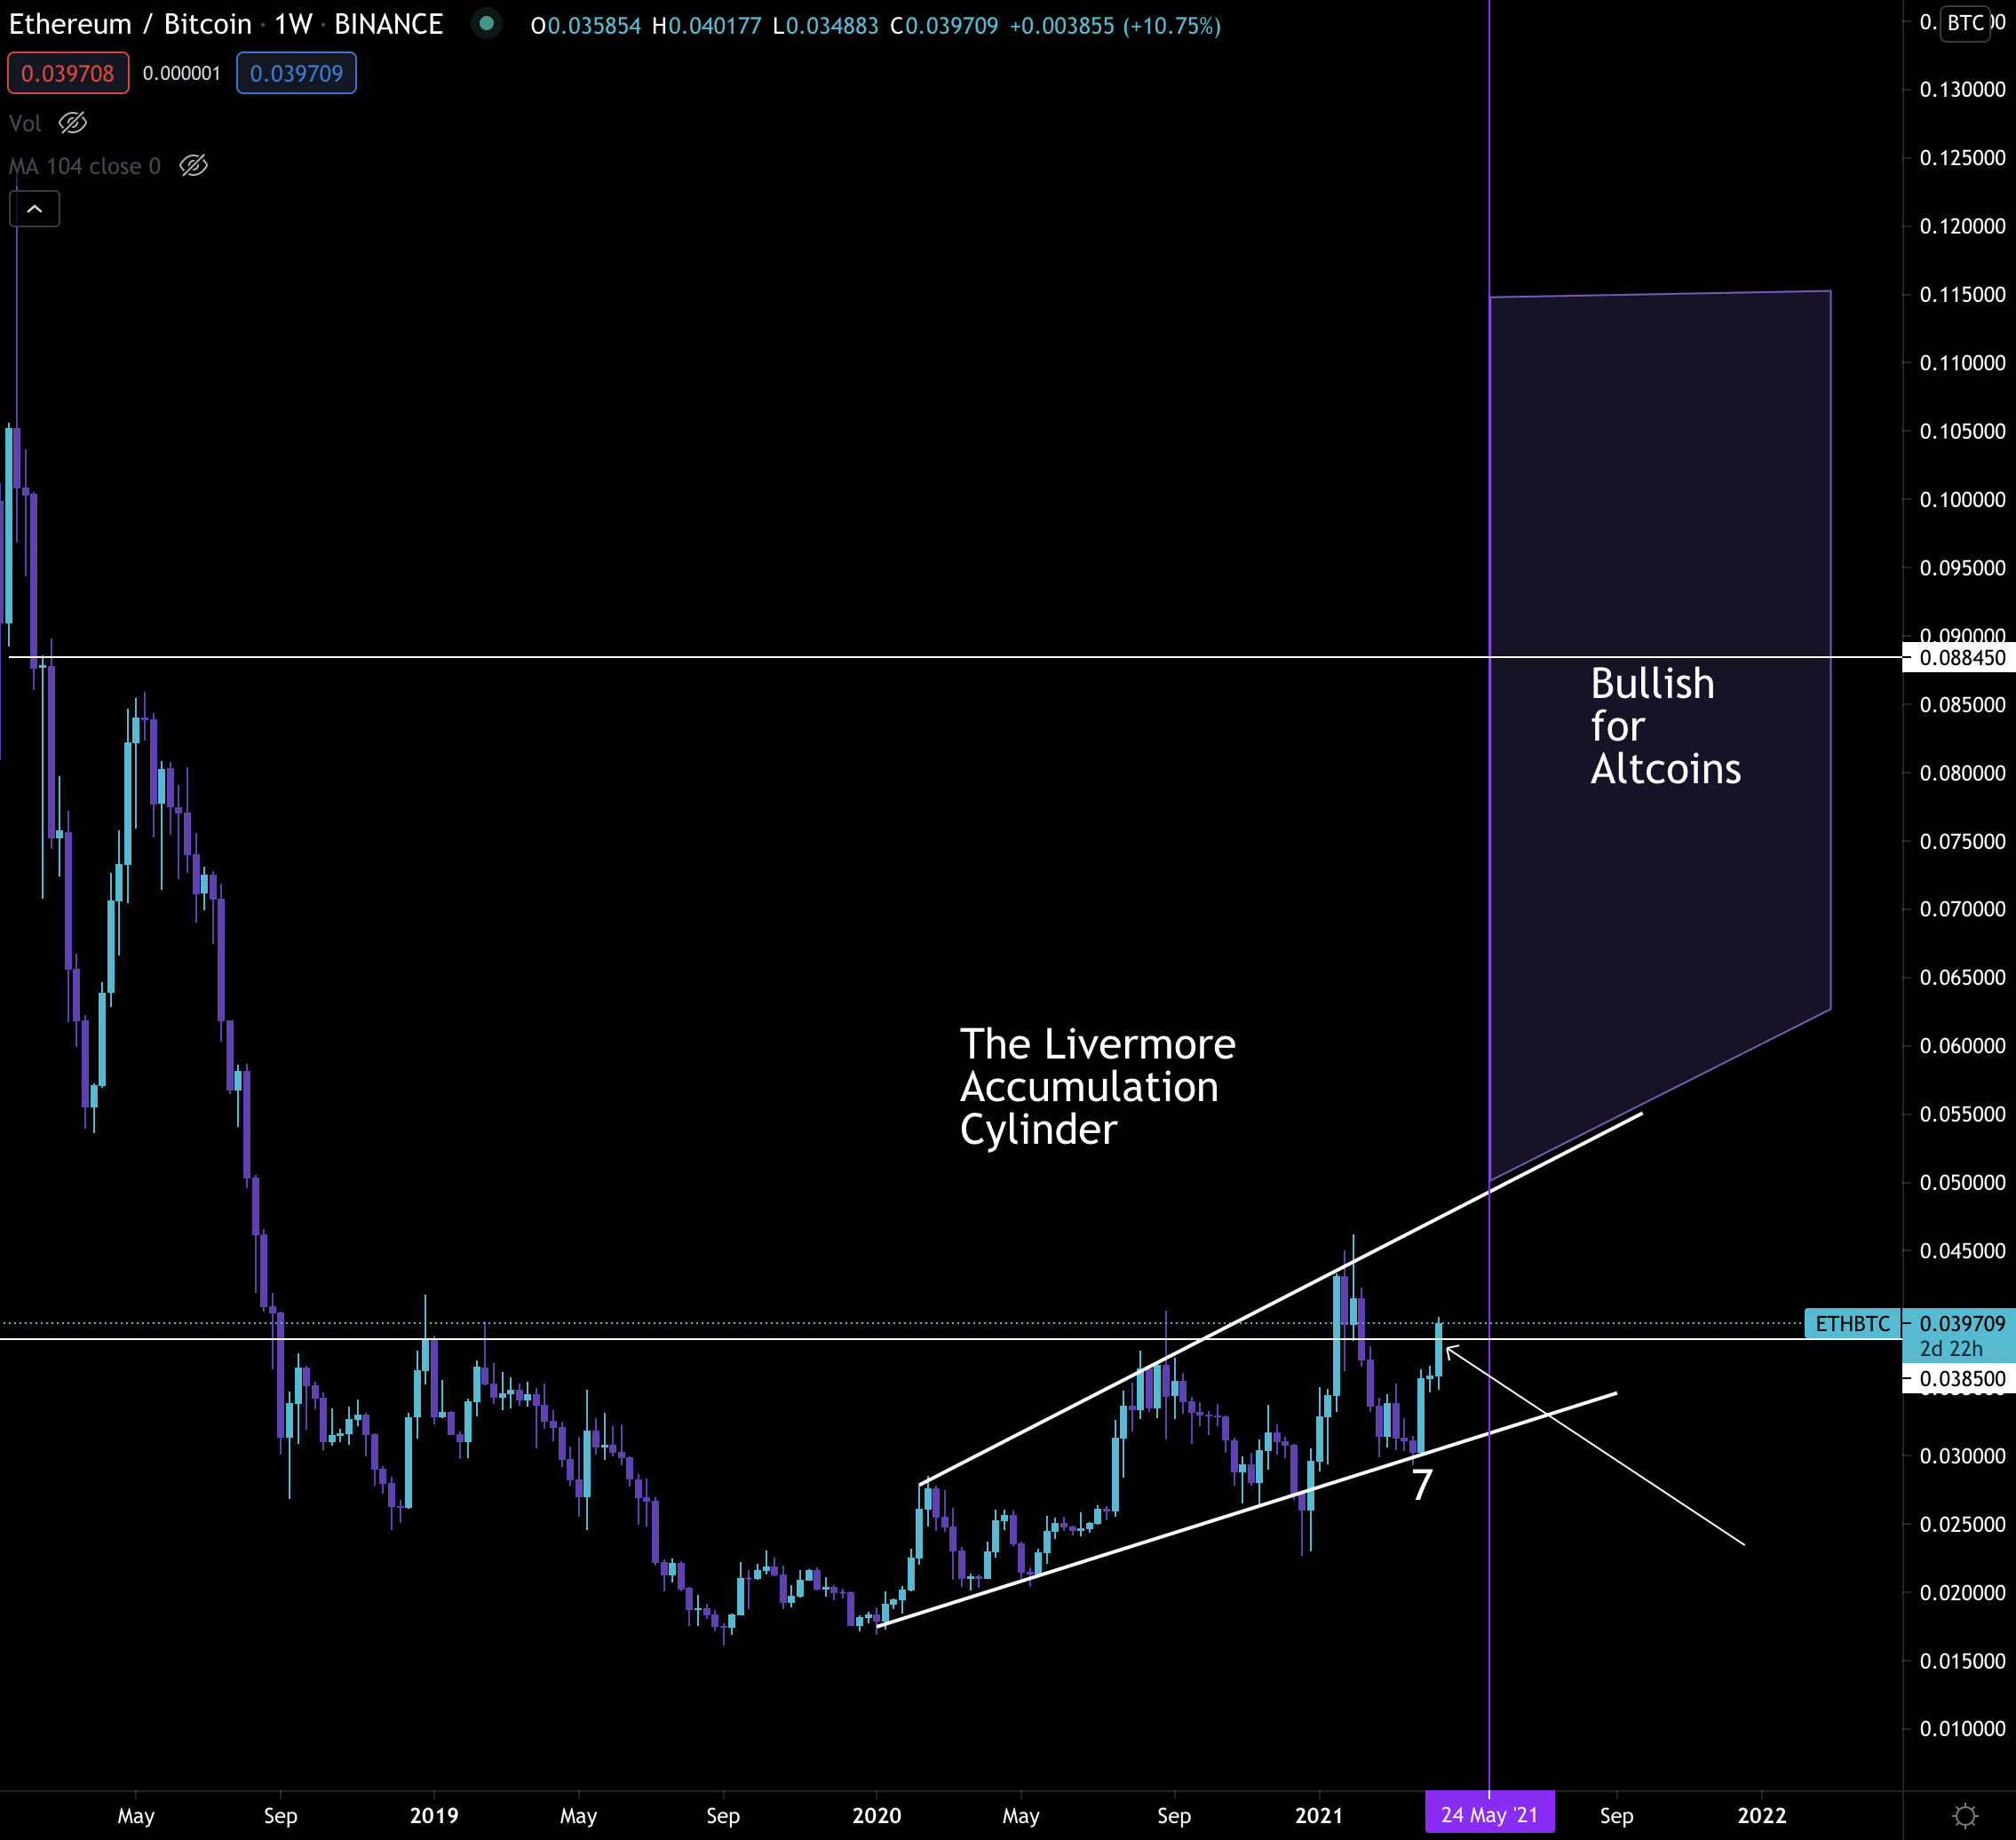
The price action on ETH/BTC is already reflecting it as well. Here’s the updated Chart of the Week.
Right now price is above the 0.0385 line. If price closes above it that’d be a strong move historically. We’ll see how that plays out over the weekend.
Moving on to ChainPulse…
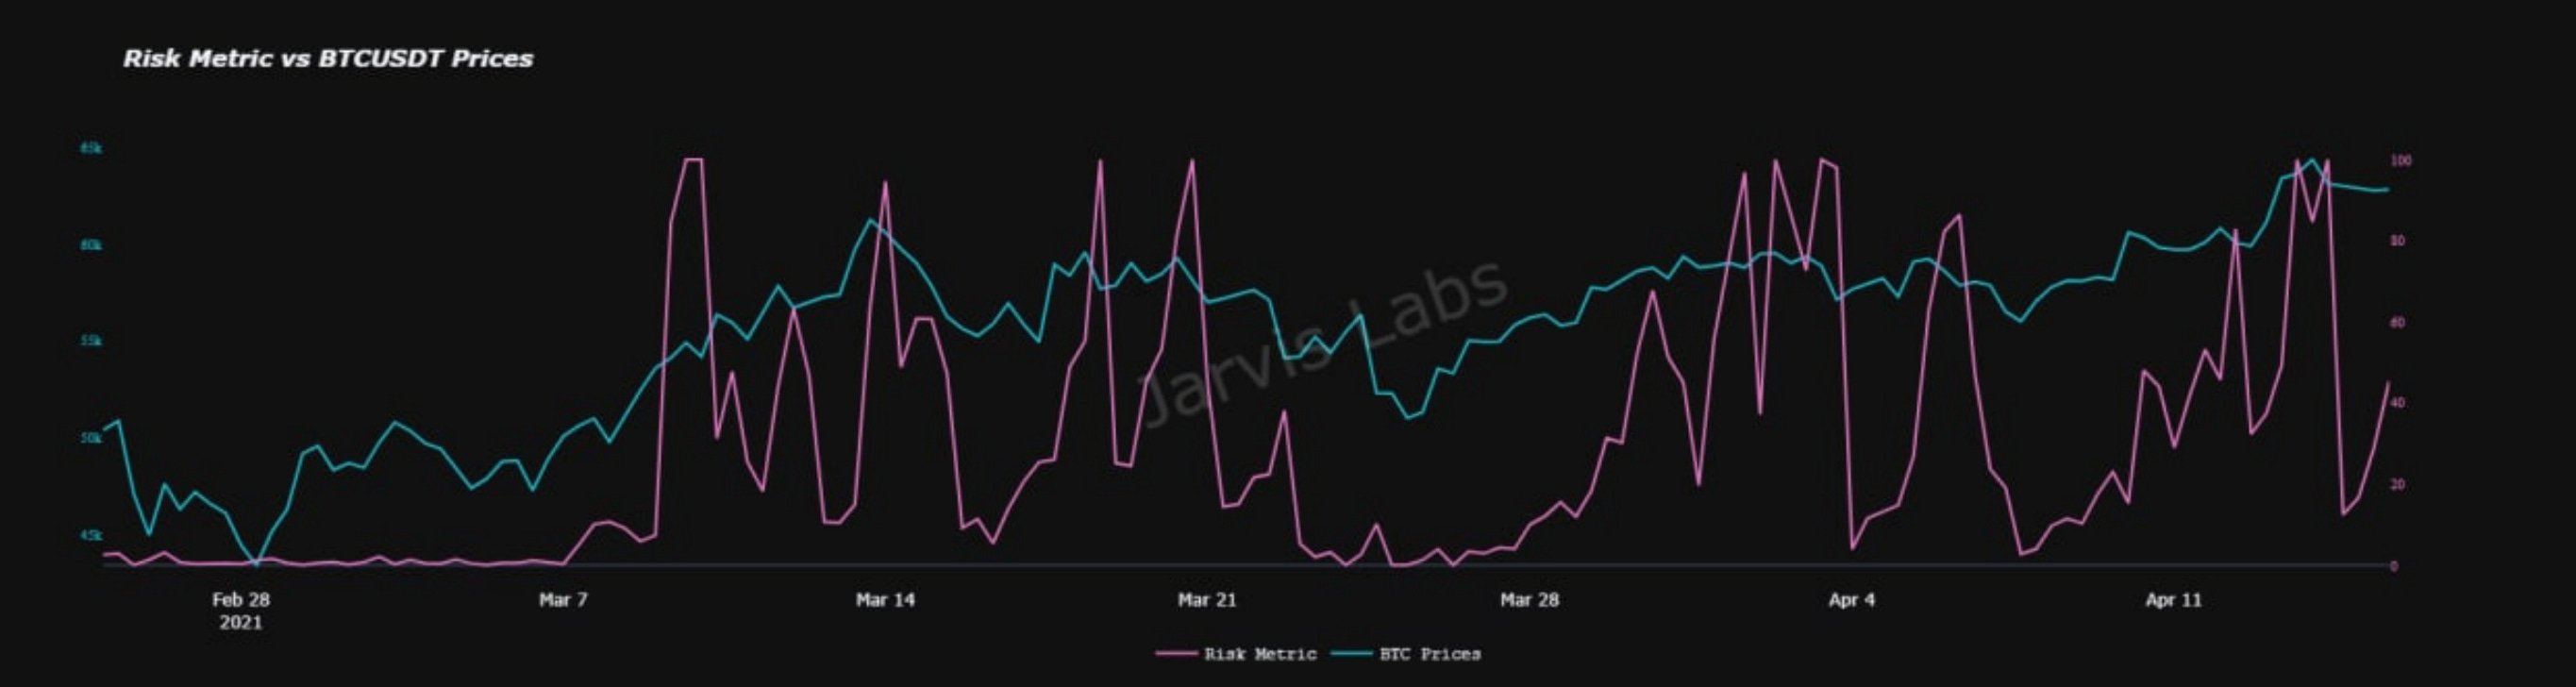
Our hybrid metric that takes into account funding rates and unrealized profit and loss saw a noticeable reset with the volatility surrounding the Coinbase listing.
It’s currently sitting at unalarming levels.
If bitcoin makes a move higher I wouldn’t be surprised to see this reading hit 100 (very risky) within the hour.
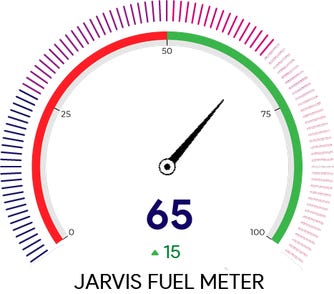
Other than funding rates and exchange flows we are still seeing healthy levels of dry powder. This is in part why our Fuel Meter is sitting at such a strong range.
Now, what I’m going to say next might feel like a bit of an aberration from yesterday’s analysis. In it we went through a handful of on-chain metrics showing how this cycle still has room to run, and if anything, is about to change its trend to a higher trajectory.
This does not mean it starts tomorrow. It might take a week or so. It’s why we keep such close tabs on fuel meters, risk meters, transactions, and exchange flows. This helps us get an idea of the day-to-day moves.
We also like to keep an eye on what our peers are saying. There is often alpha out there that we did not consider.
One of those peers is our friends over at Material Indicators. We shared a guest essay from them a few weeks back where they discussed their firecharts and unique CVD metric - we find it incredibly value.
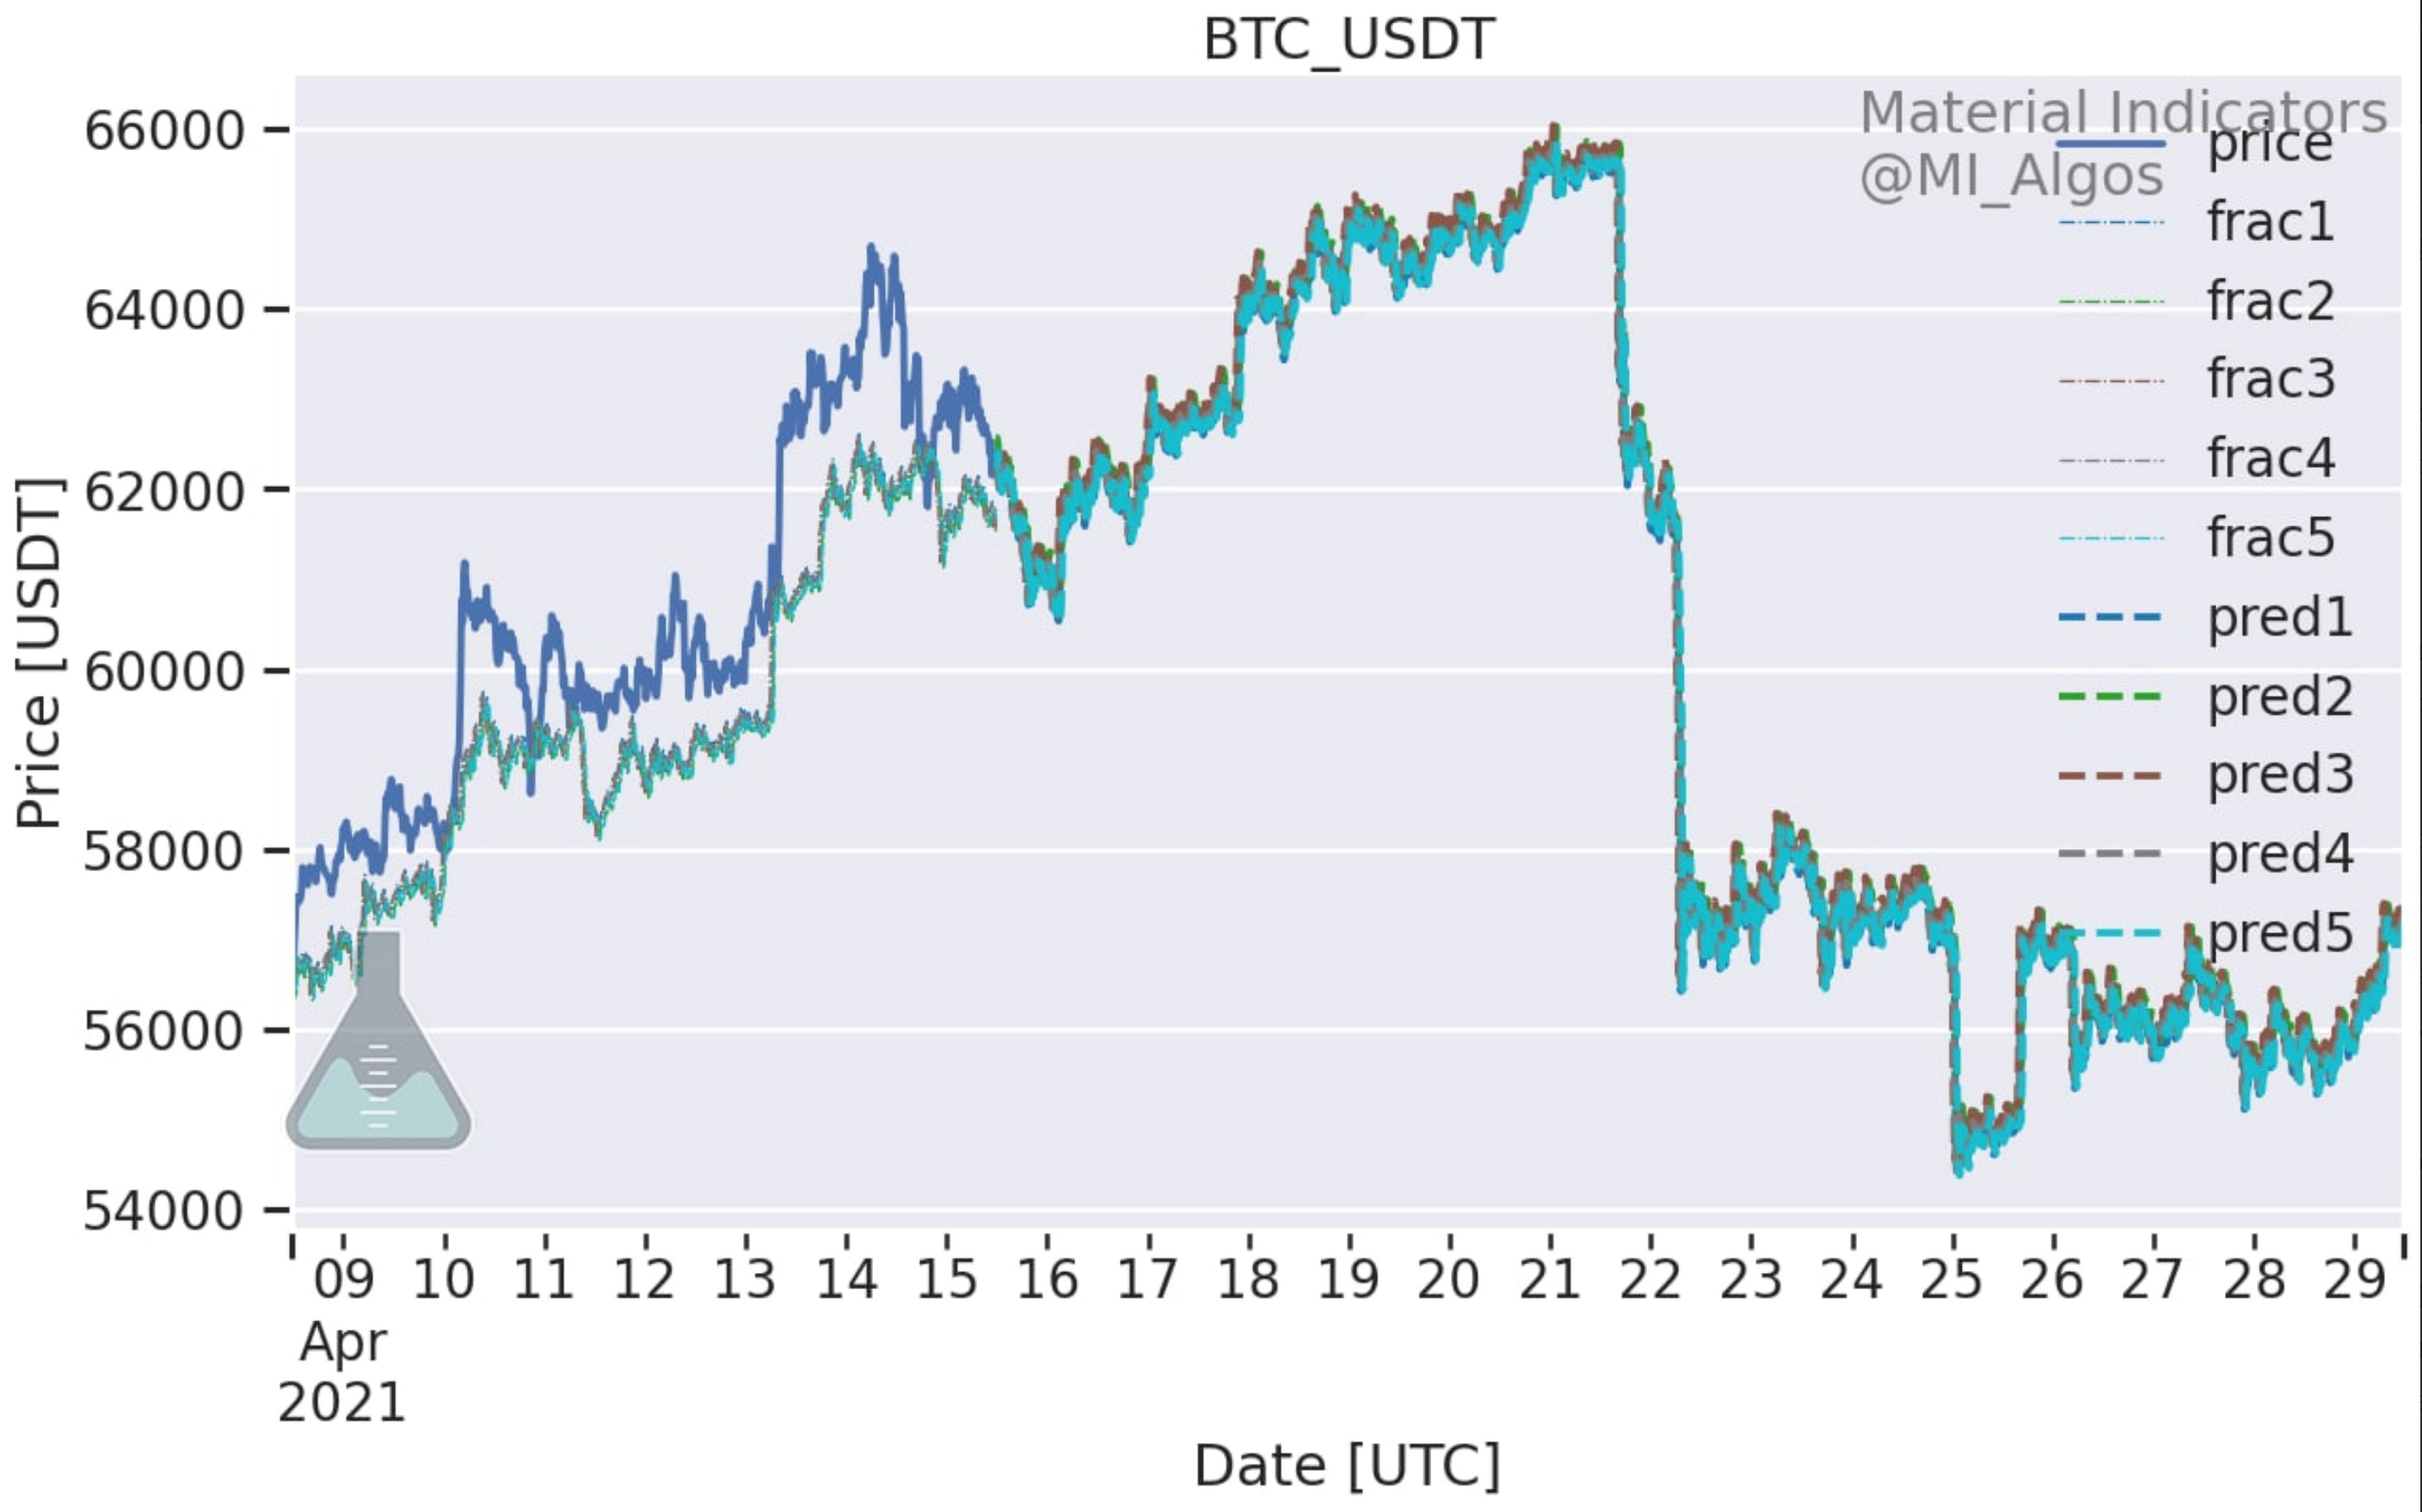
Well, most recently @MI_Algos and @Mtrl_Scientist shared their fractal model with us.
It’s been relatively accurate in the past, especially in the past 3-4 months. Just keep in mind these are just projections and not written in stone.
Right now the fractal shows a potential near-term top of $66k. If this fractal holds true then we have another leg for both BTC and altcoins. So it’s a scenario we need to entertain among several others.
Here’s the fractal. The blue line below is the current price action. The drop off in the fractal looks to take place in about a week, so we’ll monitor it until then.
Here’s what @Mtrl_Scientist had to say in our private discussion…
While fractals rarely repeat in exactly the same way, the current price-action has remarkable similarities to the August 2018 period. It might present an opportunity to lock in profits on riskier positions and set funds aside for a potential correction. It may never come, but you’ll be lad not to get caught off-guard if it does.
It’s wise advice to always have dry powder on the sidelines. This looks to be a decent place to consider doing so.
Until then, we’ll monitor the fractal and ChainPulse metrics to see what materializes. We hope you have a great weekend.
Your Pulse on Crypto,
B


