Will JPow Sweep the Leg?
Market Update: Spot Demand and Rate Expectations


Yesterday, Bitcoin led the way on, “Sell in May and go away.”
Bitcoin (BTC) down 4%, Ethereum (ETH) dropping 2%, and the rest of the total crypto market cap down as well, on the first day of the month.
Pair this up with the turmoil at First Republic…
And the realization that deep concerns in the banking system remain.
In fact, things got so bad it required JPMorgan to swoop in and acquire the company, which now constitutes the second-largest bank failure in history.
And the upcoming FOMC meeting — in which the market thinks with 97% certainty as of Monday (and 86% certainty as of this morning) that the Federal Reserve will raise rates again — is likely to also create some jitteriness.
But despite the negative news and price action, the market seems indecisive overall.
That’s even after the whipsaw in price and open interest (OI) at the tail-end of last month.
Truth is, if you read our our last update… you’ll know we expected some of this indecisiveness. And if anything, much of the recent price action is hinging on spot demand, a topic we also discussed last week. It’s a topic we will expand upon here as we also factor in an upcoming Q&A with the Federal Reserve Chairman.
And as you’ll soon see, we think JPow looks primed to catch traders off-guard and sweep the leg with the current setup, let’s dive in to learn more.

Ben Lilly here.
For those who have been looking for a new exchange, consider checking out ByBit.
They operate in 160 countries. They have more than 270 assets trading on spot and over 200 perpetual and quarterly futures contracts. They even offer options contracts and NFT trading.
Simply put, ByBit has a lot to offer any trader. And right now, they are offering a $10 welcome bonus if you open a new account and complete some introductory tasks. They also have additional ways for you to earn.
If you are looking for a new platform to trade on, consider ByBit today by clicking here. Also, if you simply want to support Espresso and the Jarvis Labs team, consider giving a click.

History Repeating Itself?
As we mentioned last week, spot volumes and spot demand in general is waning.
I liken a drop in spot-driven markets as taking the gas off the pedal. Your top speed is sort of realized. The main movement, or possible change, is the side-to-side steering on the track. Sure, there might be some downhills (e.g. — gamma squeezes) or interesting wind conditions… But these are shortlived events.
The market is merely making the most of the energy already realized. And any new energy added tends to dictate things.
Which is why we need to pay attention to any gas that does get exerted as the market bends to the whims of derivatives.
What do I mean here?
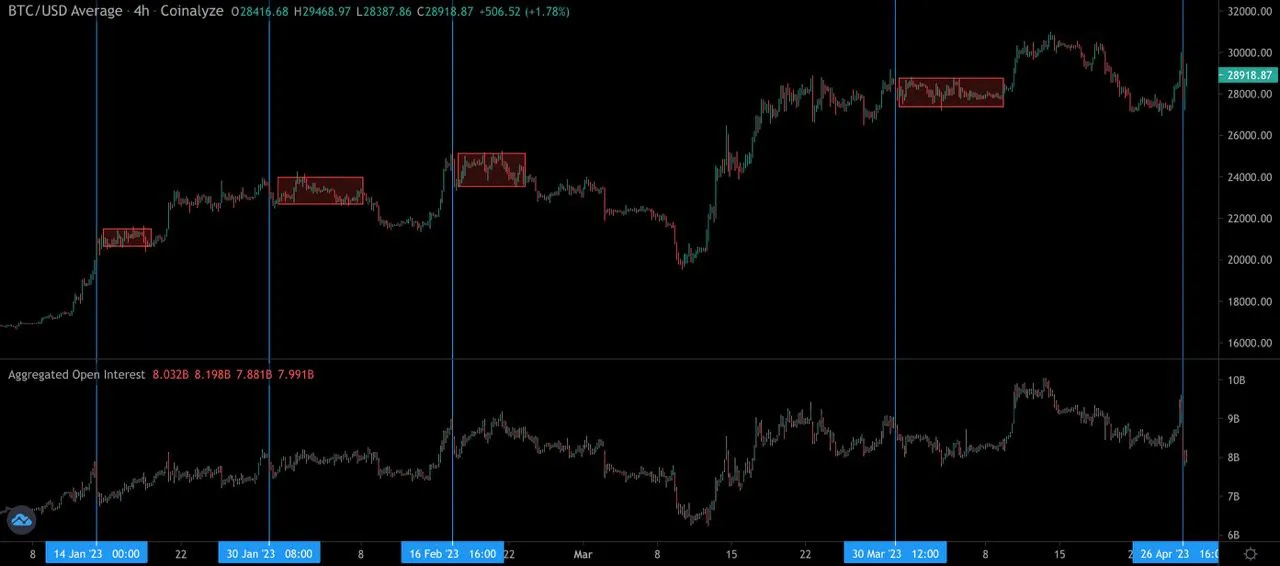
Here’s a price chart of Bitcoin with aggregate open interest at the bottom that we shared with Jarvis Labs OEMS system users. If we take a hard look at the blue lines below, we can see new trading ranges don’t materialize each time the open interest of derivatives begins to run higher.
Instead, they tend to cause significant swings within the current trading range — steering side-to-side. And when this side-to-side whiplash takes place with OI, price tends to consolidate over the following week.
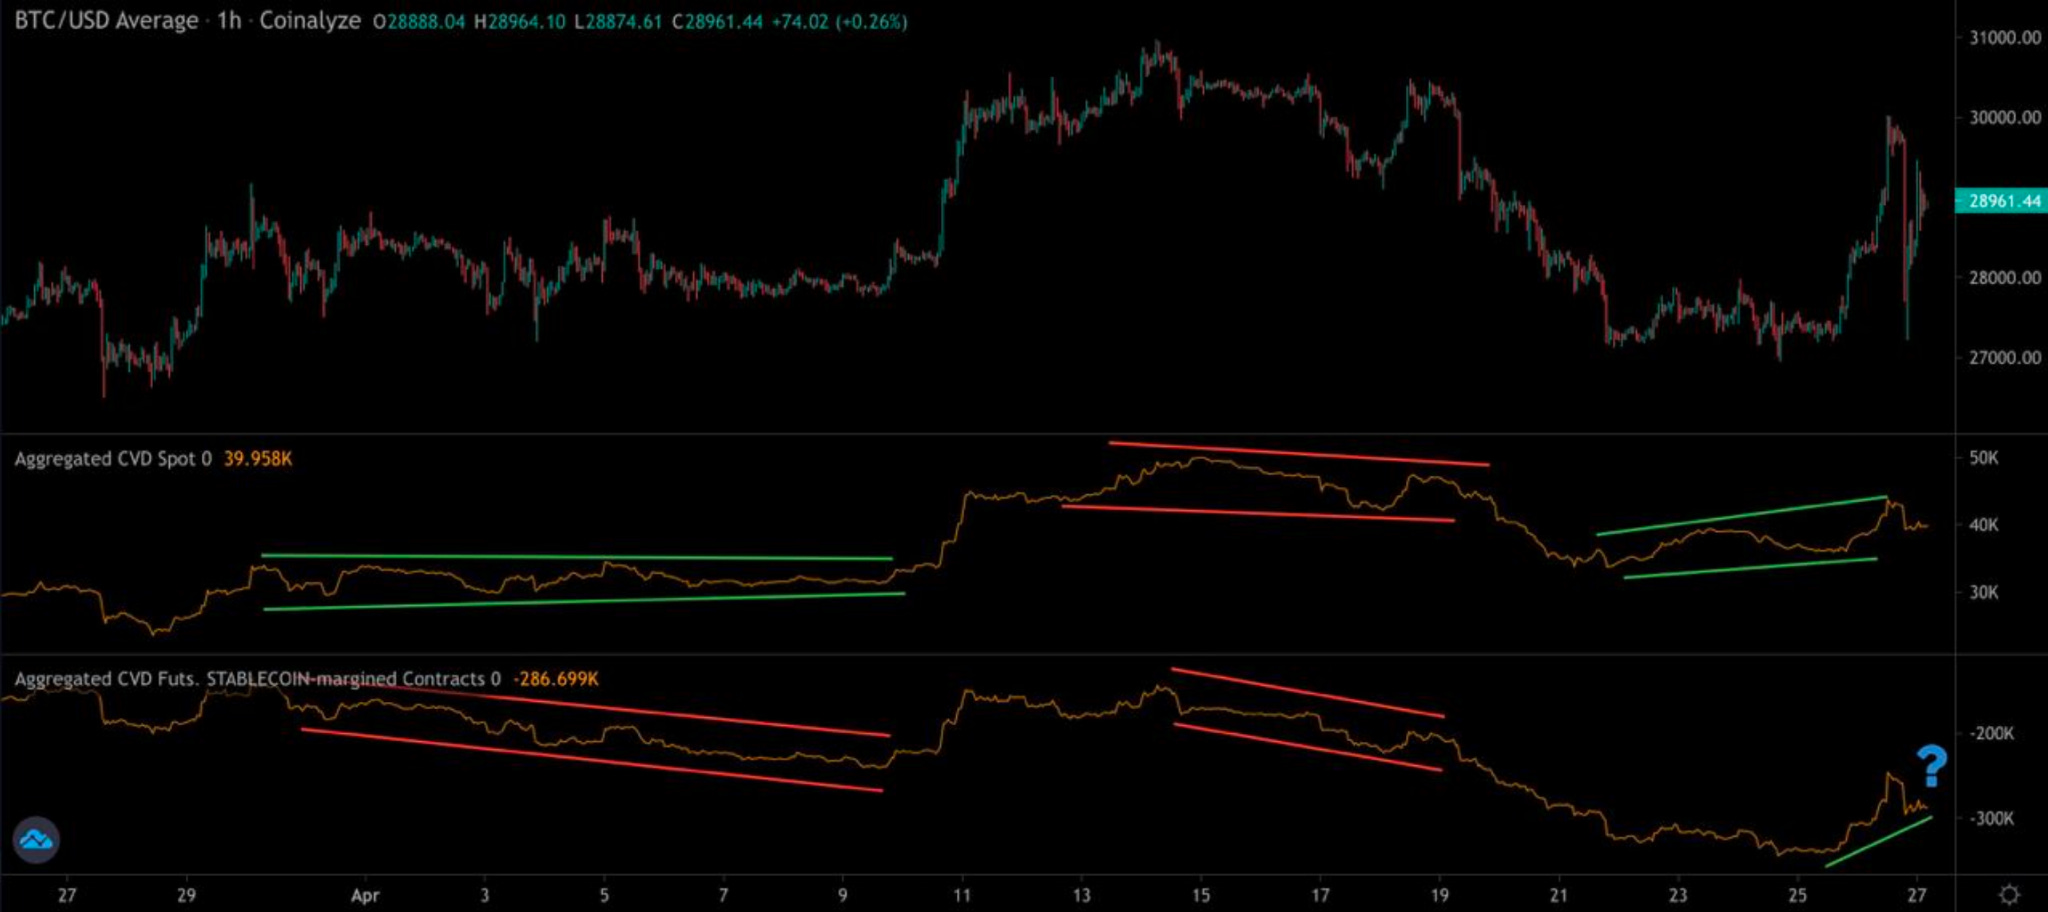
Now, if we want to better understand when the gas is applied to the market, we can zoom in a bit on this chart and layer in the change in spot demand (spot CVD) and derivatives demand (futures CVD). This helps us see why price can break a range.
The green lines below indicate a rising trend, while red lines indicate a falling trend. Once we apply these lines, it helps us see that spot demand trends (middle chart) determine the direction price will run once it breaks a range.
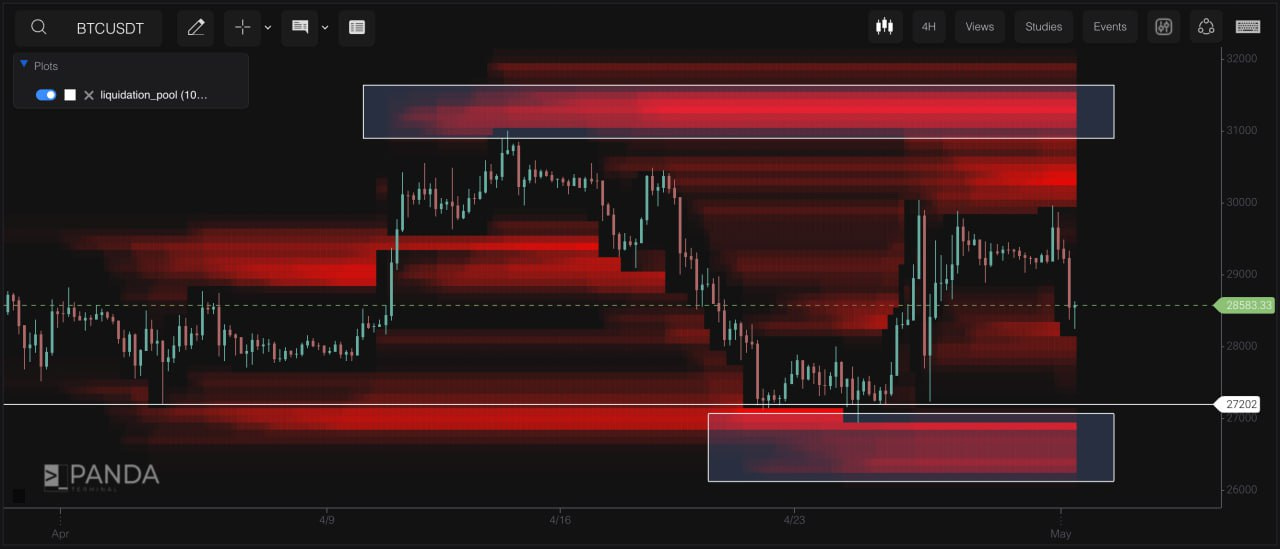
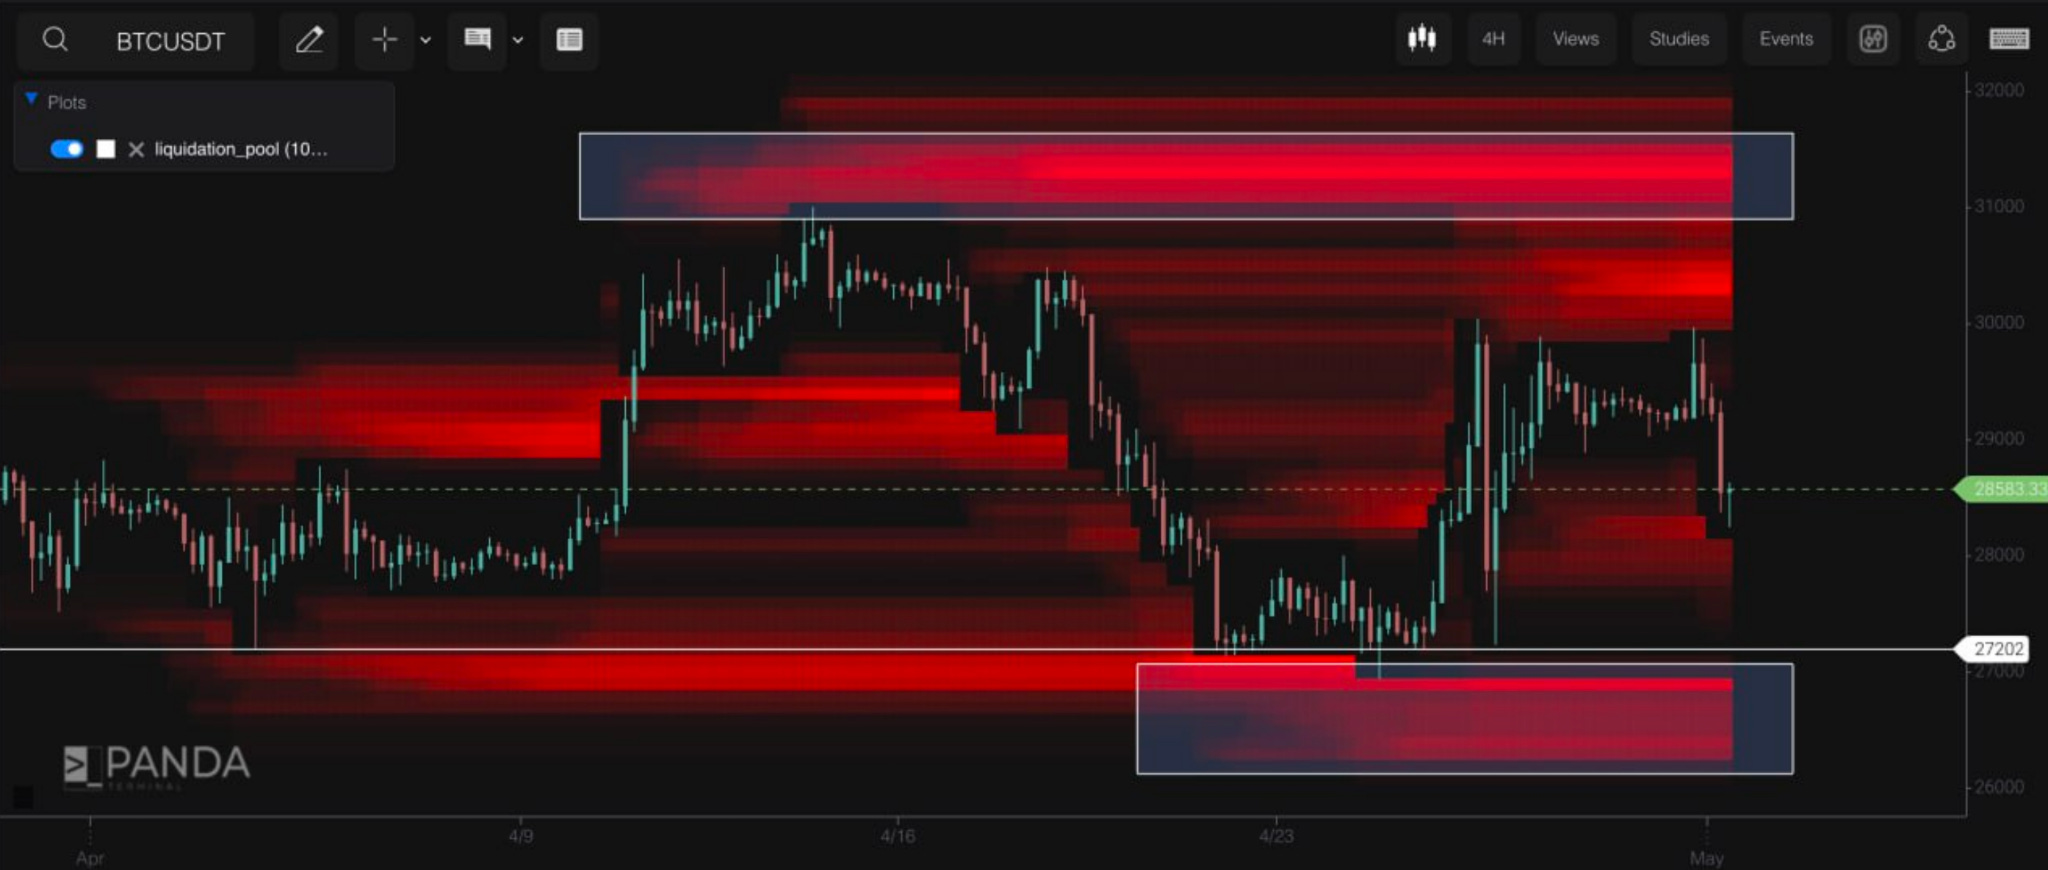
To help guide us even further, we can layer in liquidity zones to see just how much price moves when it does break its range.
In the liquidity heat map below, price consolidates between bands of liquidity. Then once spot demand determines its trend, the market tests the next band of liquidity.
These form nice price targets for any trader in the market. And they help us even more once we see the trend of spot demand.
This level of understanding in terms of how the market is currently behaving begs the question of what is happening now…
Spot Is Regaining Control
To quickly recap, CVD measures how much of the volume in an asset is coming from buyers or sellers. The higher it is, the more buyers are dominating the market, driving up price – and vice versa.
And when we break CVD down by spot or derivatives, it gives us an idea of whether the market has more long-term momentum building (spot) or short-term (derivatives).
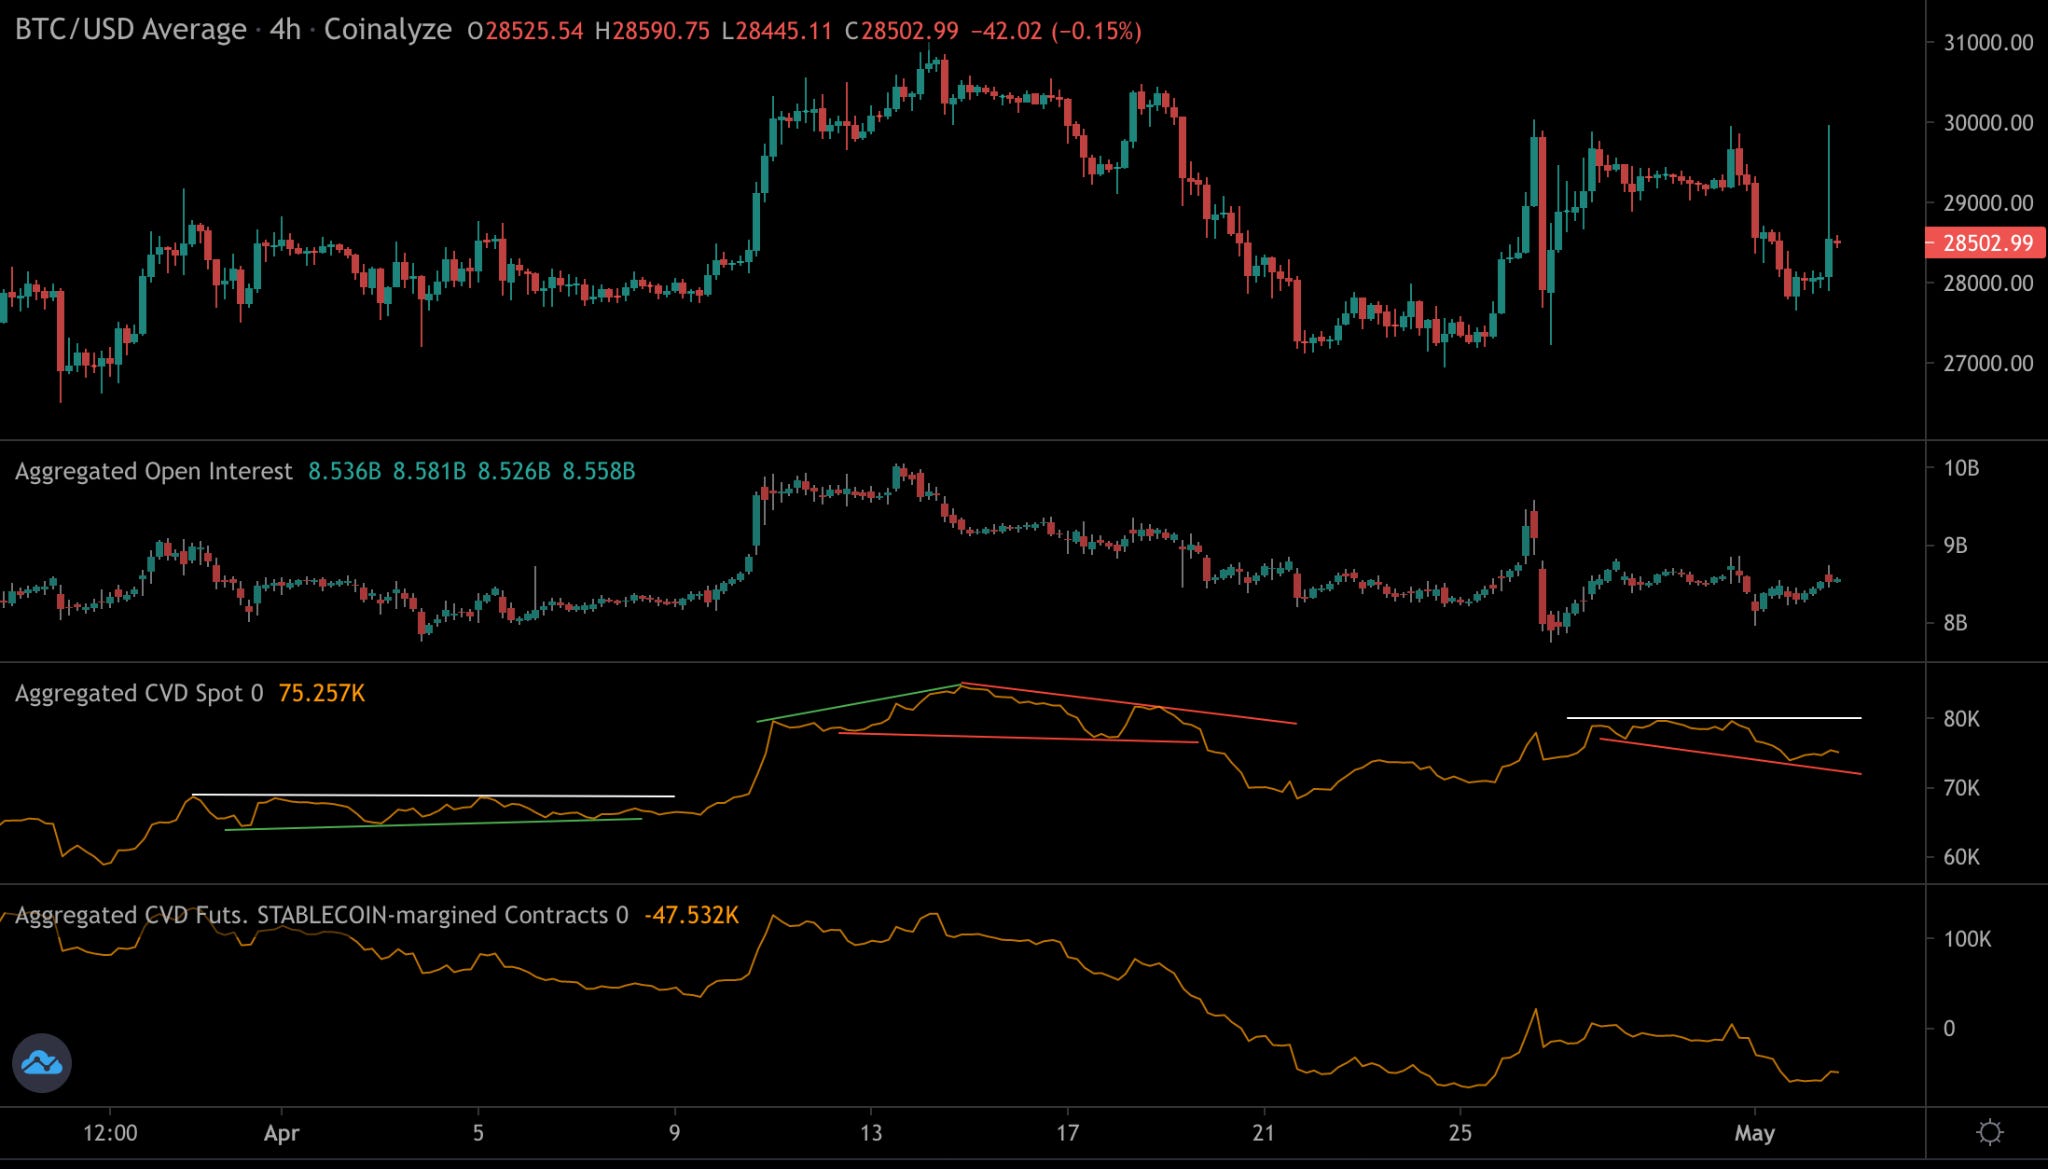
The chart below shows us BTC, with CVD measures for spot and futures derivatives at the bottom.
We went ahead and placed red lines to denote downward trends and green lines for upward. White lines signal a flat trend.
Right now, the current trend is making lower lows for CVD spot. If we see this trend form a new high in the coming days, then price should reflect this. But as of now, the trend since the OI whiplash event from last week isn’t looking good as we consolidate.
What to Expect
Based upon what CVD is showing on spot, we should at least be prepared for price to look at liquidity to the downside. Liquidity begins around $27,000 and is building near $26,000.
If we want to consider what a trigger might be, the FOMC meeting presents a nice opportunity for a run on this band of liquidity.
And once we factor in what we expect to happen tomorrow with JPow, this sounds more possible. Specifically, we think JPow will talk in such a way that he changes the market’s rate expectations for late 2023.
The current highest probability for late 2023 is a target rate between 425 and 475 basis points (bps). Assuming we get the expected rate hike to 500-525 bps tomorrow, this chart below of target rate probabilities looks due for a correction. This would imply some hawkish language on the docket that mentions tighter conditions for longer.
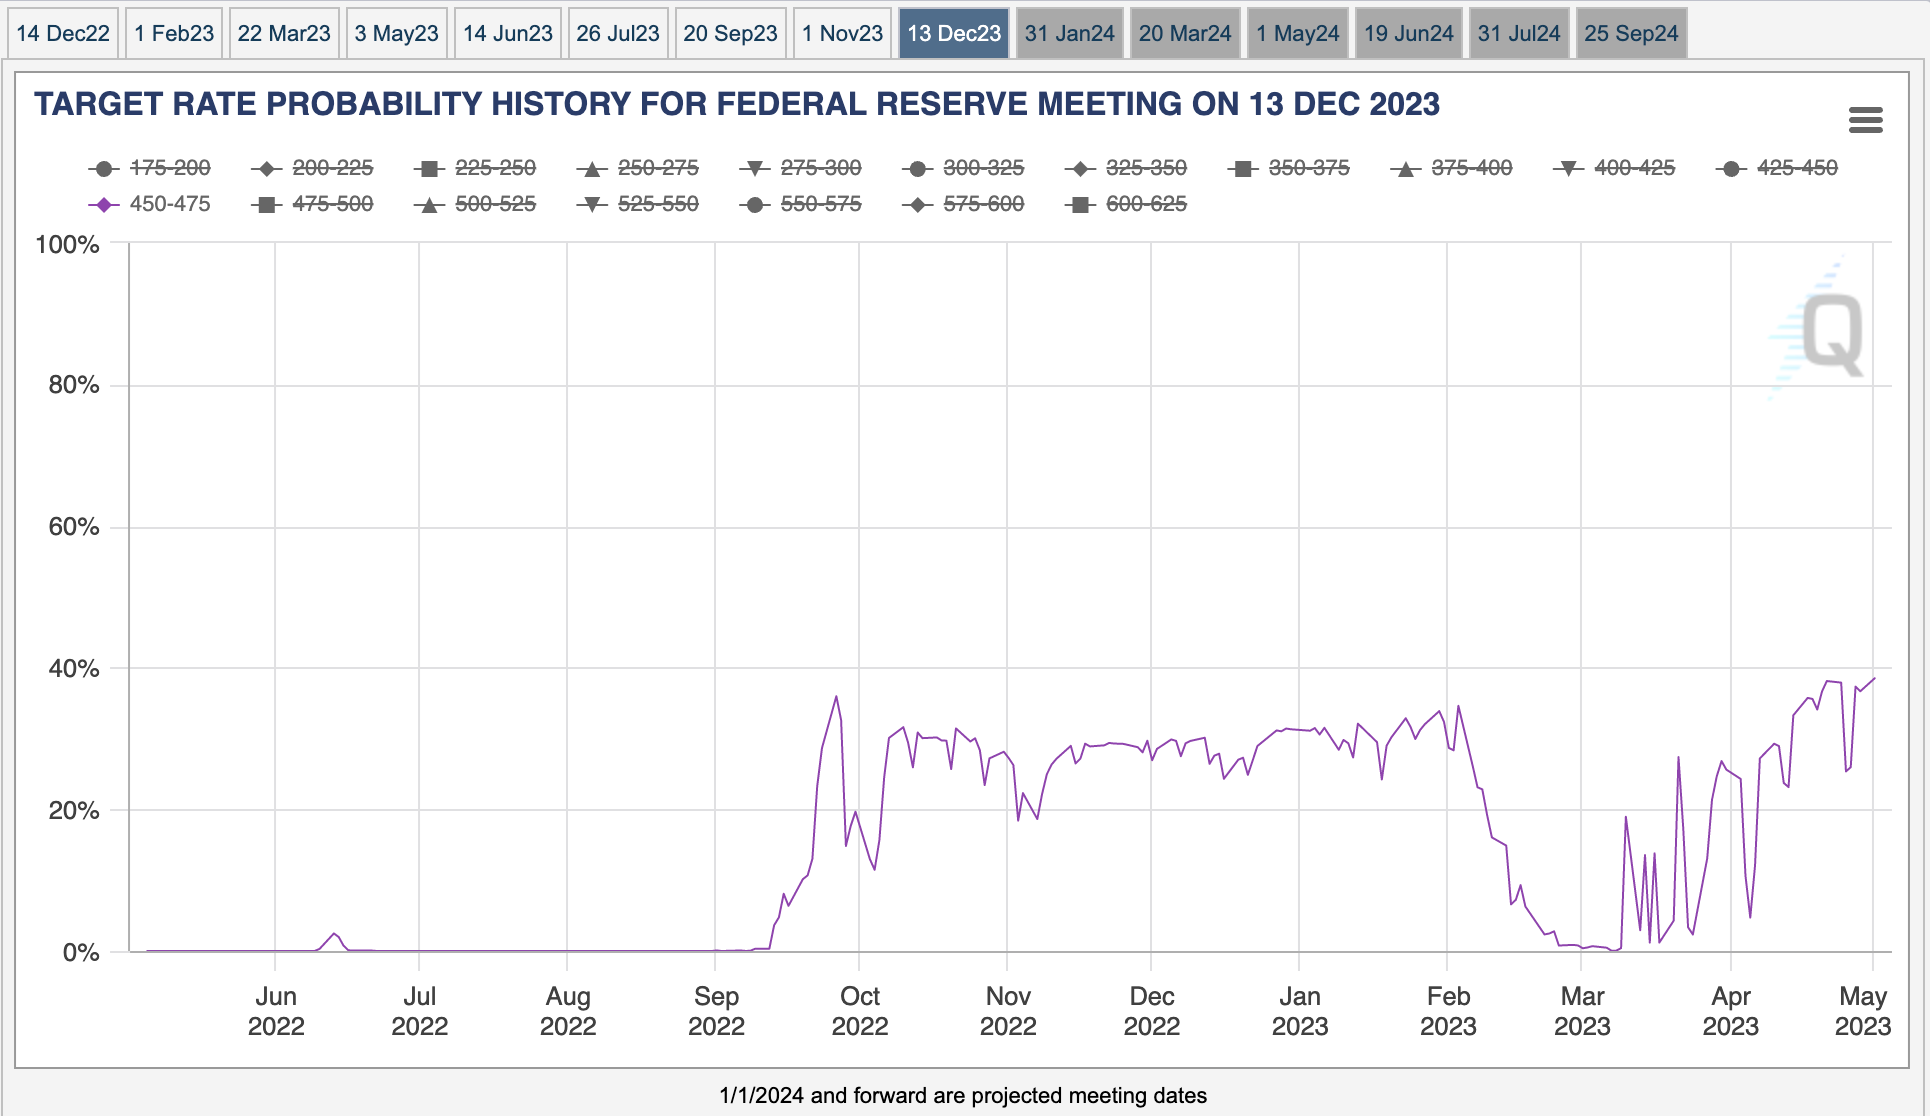
It might just present the perfect opportunity for a sweep lower. In the chart above, the last time we saw such a maneuver was early February. The price of Bitcoin dropped by $2,000 in the days that followed as this “correction” unfolded in the target rate market.
Your Pulse on Crypto,
The Bens
This newsletter is sponsored by Bybit. Be sure to try out the exchange here, and take advantage of all they have to offer today.


