Wen Bloom
Market Update
If the bottom is in, would you be upset?
Many of you read our last issue “Developing Conviction”. In there we discussed how the market was preparing for a selloff.
We didn’t need to wait very long to get a response as the market sold off nearly 10% within 24 hours.
And as the market was diving towards $53k many of you were eagerly awaiting our team to say our Reversal Onchain Sentiment Indicator (ROSI) signaled a bottom is in.
But the signal never came.
In the silence that followed while the market bounced up towards $58k some of you were wondering why.
There are a couple reasons why, and I want to hit on them before we get into our market update. I feel diving into this will help readers understand the importance of indicators and how we approach them at Jarvis Labs.
To start off, let’s hit on a topic that is often discussed, but rarely understood in crypto - Risk/reward.
You have likely heard many different takes on this matter, so consider this my hat being tossed into the ring among others.
When it comes to crypto, most traders over trade. They think each top and bottom should be traded. And that the most successful traders are constantly getting these calls correct.
What often goes unnoticed is the group of traders who wait for the market to come to them. The patient traders who don’t tweet ten times a day. These traders wait for their ideal setup.
The reason is familiarity. If there is a type of setup - whether it is in market trading, the ideal distance to hit a golf shot, the ideal pitch for hitting a baseball, a pass setup in football (soccer for the Americans), a flop in poker or some other scenario - you perform better when this ideal setup unfolds.
In trading we can file this under risk-to-reward. And for the Jarvis Labs, one of our indicators / ideal setups is ROSI. We know when ROSI fires it means the sentiment is reaching an extreme.
You see, when the price action in the market gets ugly enough, the activity that unfolds onchain can get pretty chaotic. Exchange flows for instance tend to realize an excessive amount of inflows that are more reactionary versus in anticipation of an upcoming event.
These reactionary onchain flows we track and view them similar to the way that a coil can be compressed… And the minute the flows ease up, the coil can release all the storage kinetic energy to spring back. These are the market reversals that our system looks to get in on.
And it’s the type of market swing ROSI looks to capture.
Now, when price dipped into $53k over the weekend the onchain flows never got excessive. There was no capitulation or extreme fear taking place onchain. Instead, we witnessed complacency. There was some fear, but overall nothing excessive. And nothing that suggests the weaker hands were shaken out.
That’s why ROSI didn’t fire. And it’s also why ROSI might fire later on when price creates a higher low in the coming days to weeks… OR if a new low is created.
ROSI looks for excessive fear, and that’s the entry and setup it hones in on for swing type of entries. When you pair this up with other indicators and even supports/resistances, you can quickly understand how a trader can confidently sit back and let the market come to them.
This is the purpose ROSI serves and it’s what the artificial intelligence system appears to be doing as well. The market is not giving a good setup right now, and instead appears to be looking for solid footing that can serve as a jumping off point.
To explain why, let’s dive further into what the in-house array of special sauce metrics look like.
The Sauce
The metrics suggest we are waiting for people to get uncomfortable.
In various chat rooms, twitter postings, and forum there was complacency in the last drop to $53k. Nobody felt uncomfortable as the market trended down. It was almost a given that this dip is nothing to rush to a computer for.
For a market to form a nice bottom, there typically needs to be a bit of pain. Many call this shaking out weak hands, bottom sellers, or panic sellers. They are all valid names, and as mentioned before we encapsulate this with ROSI.
Looking at accumulation statistics we can see this type of behavior is typically met with whale behavior buying the dip. This is a visual showing bitcoin being transferred from weak hands to stronger whale hands. And when whales take part during a price rise, there is significant strength that follows. You can see this with the yellow to orange hues that happen near bottoms or as price starts to rally in the chart below.
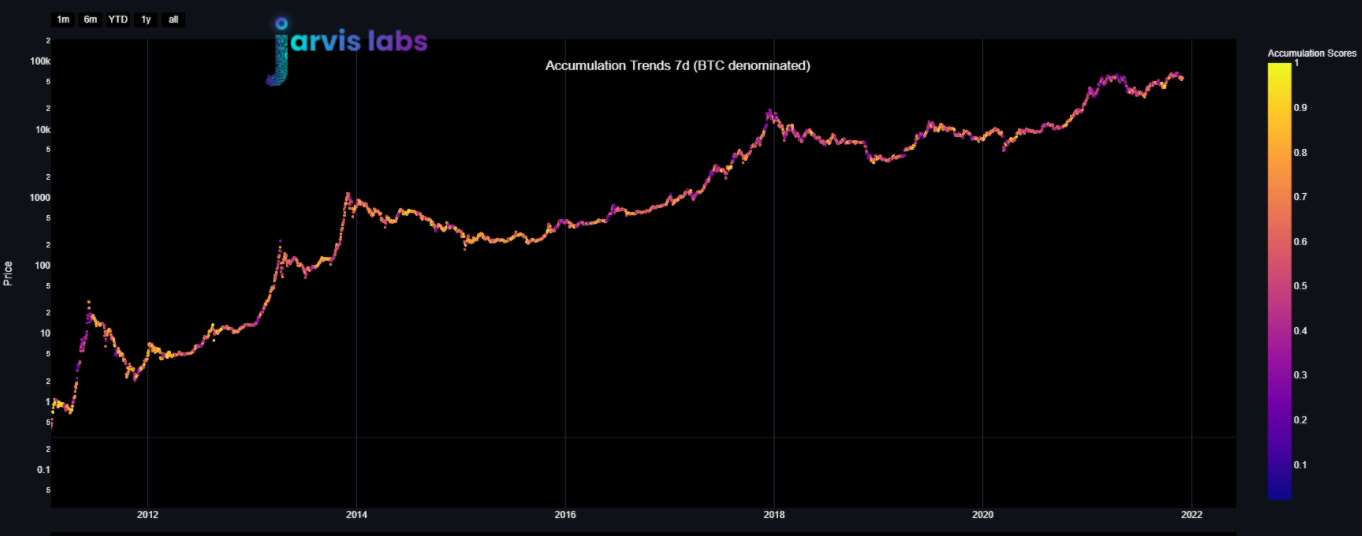
The issue at the moment is whale buying has momentarily let up. The most recent data point below suggests over the last week whales are absent. The accumulation score from yesterday was 0.17, which is very low.
And it comes on the heels of several strong accumulation data points.
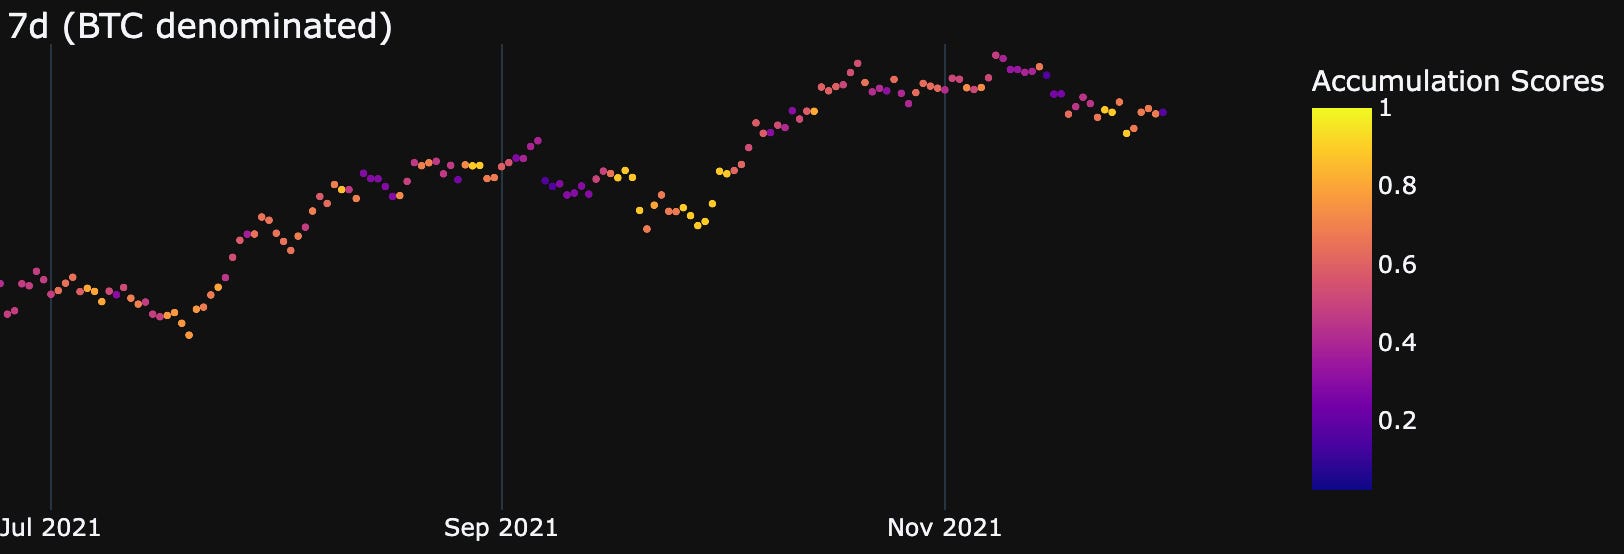
This means the confidence in the market is not as strong as many believe after we bounced off $53k.
But like we said earlier, we think the market is getting close to finding solid ground to jump off from. So the lack of strength we see on the 7 day chart might be more transient, and likely to show up if we flush lower.
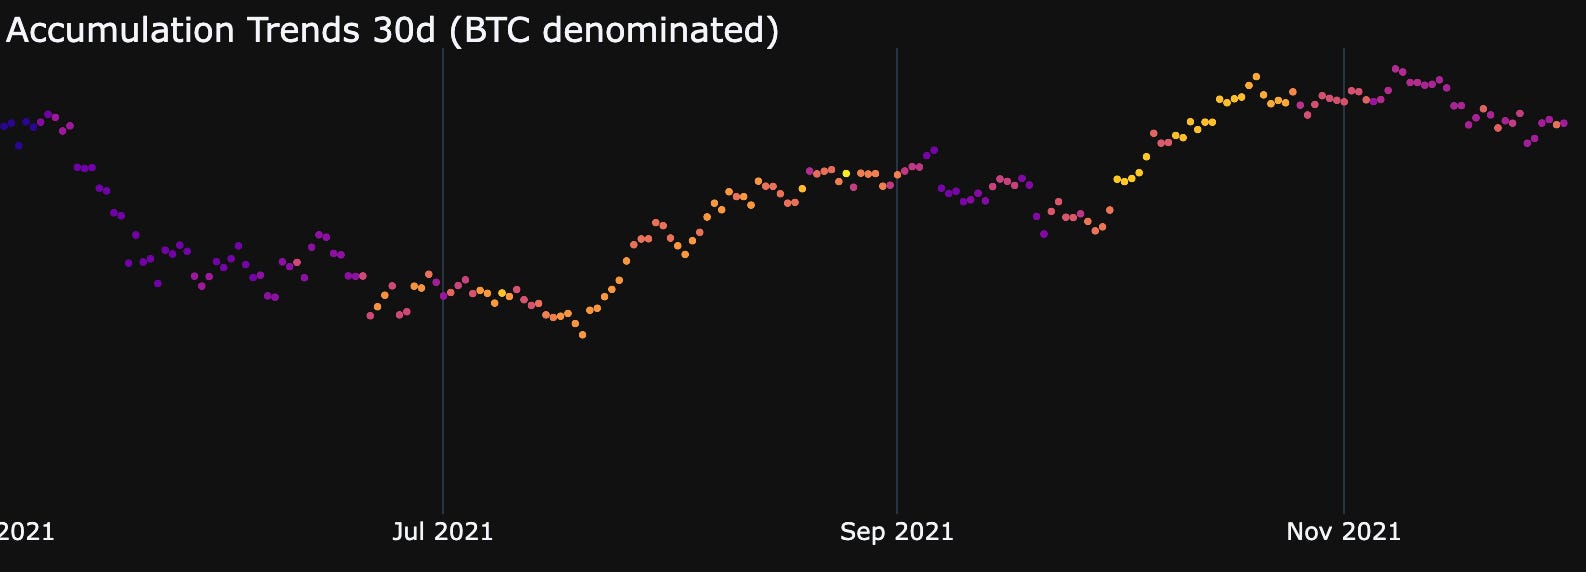
In terms of the 30 day accumulation trend, which is to say what does the last 30 days look like if we squish it into one single dot? That’s what we get below… Yellow is indicative of whales while purple and blue is indicative of retail and smaller buyers.
Hues of purple tend to populate tops while yellow and orange tend to populate bottoms. It is pretty much what we would expect to see.
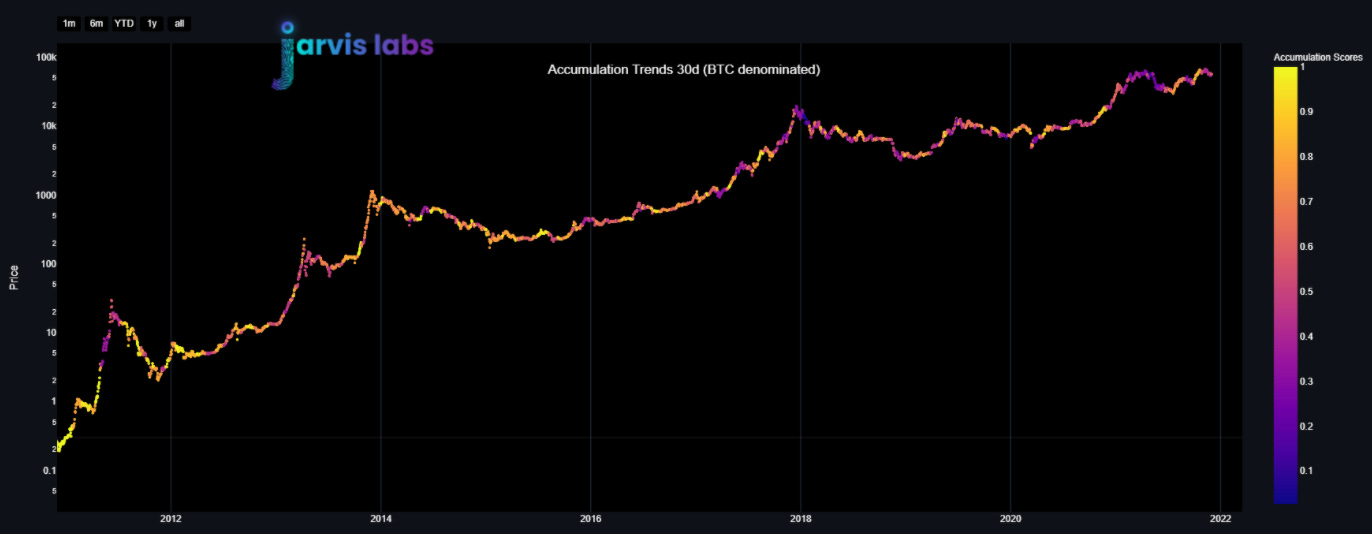
If we zoom in on the last six months, we can see the hue changes from purple to orange/yellow around these local bottoms as well.
Pairing up the last few data points from the 7 day accumulation chart - which are mostly yellow and orange - and witnessing the 30 day data points being purple, it wouldn’t surprise me to see the 30 day data points become more orange in the coming days.
This is what I mean by the lack of strength we see on the 7 day chart might be more transient. And with a flush lower the whale buyers would return again - creating a strong 30 day reading.
Now, these charts aren’t perfect. They don’t always coincide with market tops and bottoms. I’m merely using them to see if the current demographics in this leg from $28k to now are anything to be concerned about.
As of now, I don’t see cause for concern.
But if the 7 day accumulation chart lacks orange and yellow dots over the next seven to ten days, then I’ll get a bit concerned.
Why?
It’ll mean we are likely grinding lower with nobody buying OR we are pushing higher with no support from big buyers - means we are about to top out.
But as it stands today, we see whale buyers pausing a bit and perhaps waiting to be more active after a drive lower. This would create strong readings on the longer time scale 30 day trend.
Now, I know these accumulation charts can be a bit confusing when interpreting. And that’s ok. The main takeaway here is the longer timeframe looks fine while the shorter timeframe shows a bit of a pause happening. And this is why we expecting ROSI to pop up again soon.
But before I go I’d like to bring up one more chart that builds on this takeaway. It’s open interest (OI) for BTC.
Open interest tells us the amount of open positions there are in the futures market.
As we can see in the white line below, we are near recent highs of OI. In early September that was a local top, in late July/early August it was a local bottom. In late April it was a local top.
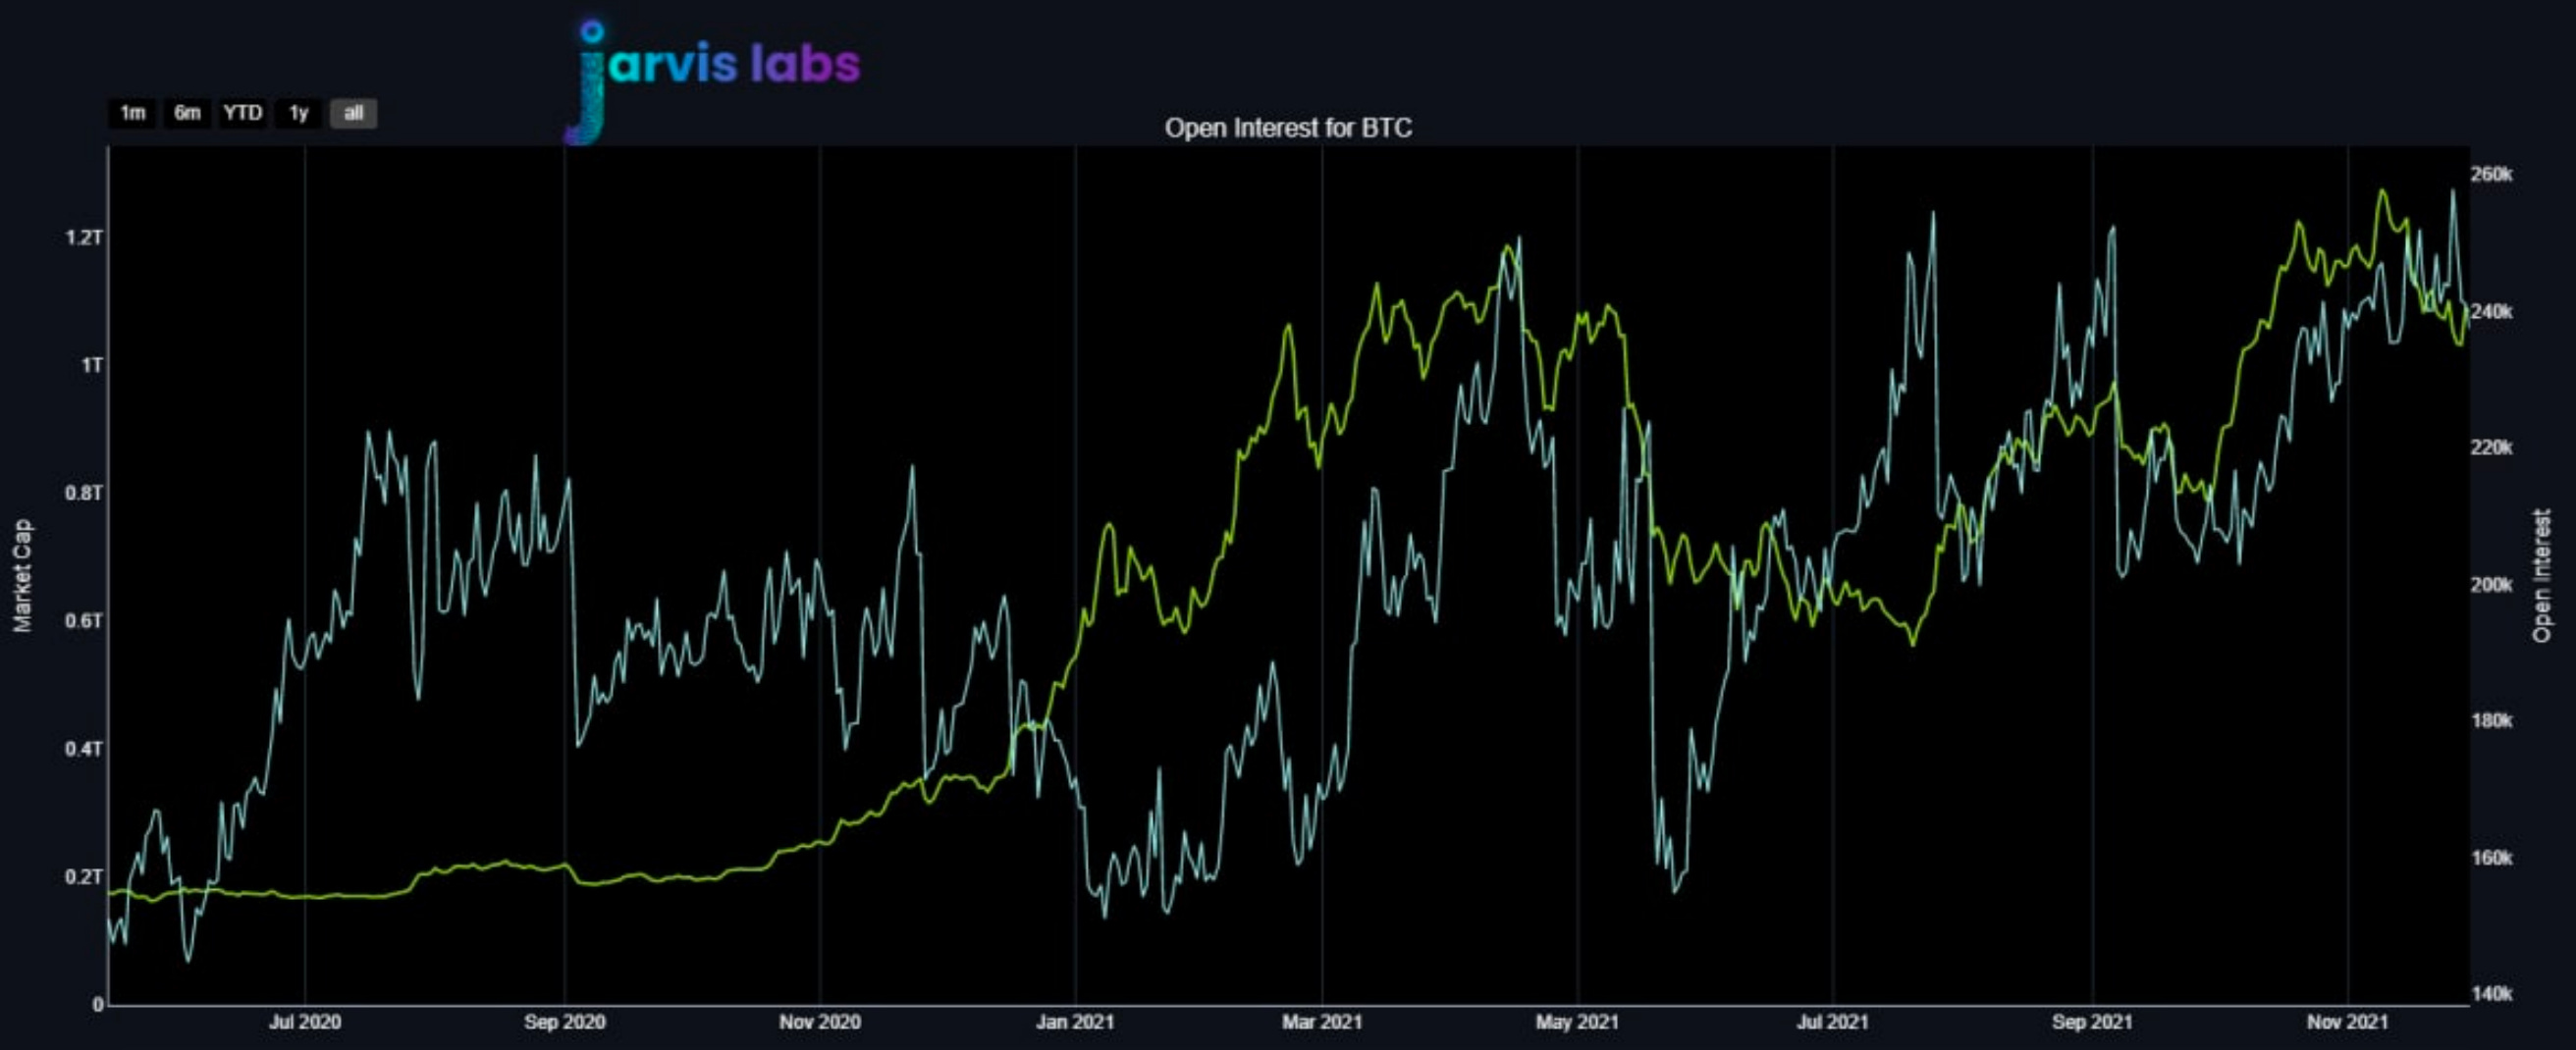
When the market “flushes” out the OI it allows price to be discovered once again. That’s an odd way of saying traders can open up new positions that influence price.
So to sum up what we have here…
ROSI never flashed - it’s why no code word was mentioned. We still think ROSI will provide a great entry point and be a signal for when panic sellers get extreme.
And if we do get a ROSI indicator the other metrics we want to watch for:
- Negative funding rates to appear during a drop - provides fuel to move higher
- A flush in OI to reset the market
- The whale accumulation trend turning yellow in the days that follow to signal a strong and healthy recovery taking place.
In the meantime, we wait patiently for the ideal setup to form. No need to chase every market move.
Your Pulse on Crypto,
Ben Lilly


