Waiting for the Powell Pivot? Watch This Indicator
Macro Update: The Market’s Ticking Time Bomb


The Houston Astros were a formidable team in the National League back in the 1990s and 2000s.
Prior to their current success (the Dusty Baker squad, not the sign-stealing squad under Hinch), the Astros had a title-contending roster for quite a long stretch. From 1997 to 2005, the Astros reached the postseason six times in nine years, winning four division titles and playing as the wild card team twice. Unfortunately, they only brought home one National League Champion pennant to show for.
The key to their long stretch of success? The “Killer B’s.”
The “Killer B’s” refers to three prominent players on those dominant Astros teams: Jeff Bagwell, Craig Biggio, and Derek Bell (Sean Berry, Lance Berkman, and Carlos Beltran sometimes get included in the group as well). Both Bagwell and Biggio are Hall of Famers, and Bell had a pretty solid career.
Prior to the TV/media contract era when teams did not have the money to lure away and sign star players like today, the Astros had a solid batting line up with the Killer B’s, who were a nightmare for opposing pitchers.
While the Killer B’s stood out in Major League Baseball, today, we will focus on a different group of Killer B’s that also have a prominent role in their own respective field: BBB-rated corporate bonds.
The corporate bond market is still flying under the radar. Right now, the media is too focused on equities, real estate, and sovereign bonds. But these three markets have made it difficult to predict or hypothesize what is around the corner for the economy.
More importantly, they don’t offer many clues as to when Federal Reserve (FED) Chairman Jerome Powell will pivot from hiking interest rates, which could be the ultimate sign for when markets shift back into buy mode.
But the overlooked corporate bond market, especially one key indicator, could provide some answers on when the Powell pivot will come.
Unprecedented Debt
Most investors might look to the stock market to gauge the health of the economy, since it is based on companies’ current and potential profitability.
But an economy can’t flourish without a healthy private sector. And that depends on a good environment for corporate debt issuance, which is a lifeline for private companies.
Along that line of thinking, the corporate debt market reflects the overall health of the economy based on how easy and cheap it is for companies to borrow in order to keep running. This is crucial, because most corporations issue debt to cover their operational expenses and expansionary costs.
When companies can borrow money cheaply and with ease, it means the economy is booming.
When companies have to borrow at sky-high rates, it usually indicates the economy is facing serious headwinds.
So what’s the state of corporate debt in the U.S.?
For one thing, it’s never been bigger.
In Q2 2022 (the most recent data we could find), the size of the U.S. corporate debt market hit $23.9 trillion.
The chart below shows the rise in corporate debt from Q1 2018 to Q2 2022.
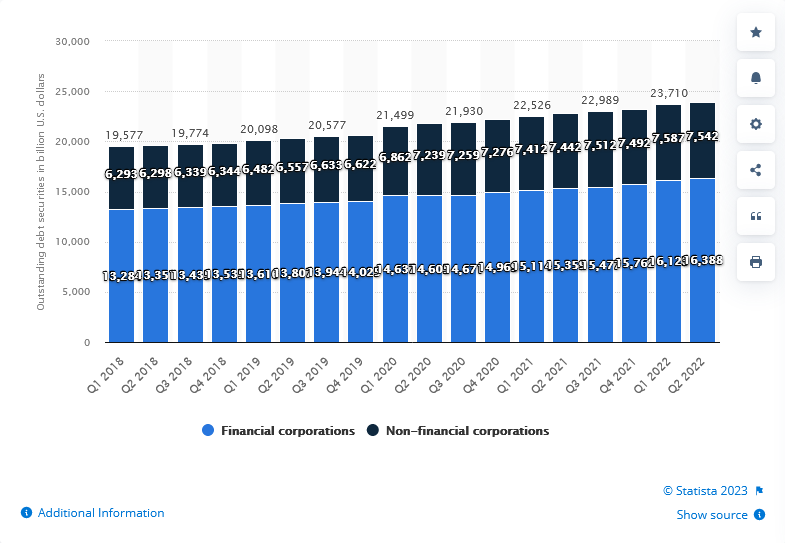
Corporate debt covers several categories, but the most important is corporate bonds, which represent $10.975 trillion of that corporate debt – a bit less than half. Prior to the pandemic, the amount was $8.8 trillion.
To get a sense of how large this debt is, we can compare it to the U.S. government’s debt, which currently sits at $31.6 trillion.
At almost $11 trillion, the corporate bond market alone is 1/3 the size of the total U.S. government debt.
The huge amount of corporate bonds on the books right now is unprecedented.
All this debt is separated into tranches based on ratings that deem how risky it is. And the heavy-hitter in this corporate bond lineup is none other than the BBB tranche, which deserves a closer look because of its sheer size.
The Killer BBB’s
The BBB rating (sometimes called Baa by other ratings agencies) is usually assigned to a medium-grade bond that tends to be in the lower end of the investment-grade category of bonds. The issuers of these bonds usually have adequate liquidity, healthy cash flow, and robust balance sheets, but they are vulnerable to adverse economic conditions.
The BBB tranche represents the largest share of the U.S. corporate bond market – 40.8%, or about $4.48 trillion.
That is a lot of money squeezed into just one tranche.
Finance is the top sector that issues BBB bonds, with around $750 billion.
And the institutions that issue bonds in this rating tranche are not just the regional Savings & Loan or commercial bank. It includes banking giants such as Bank of America, Citi, Morgan Stanley, and Wells Fargo.
Below is a breakdown of BBB bonds issued by sector.
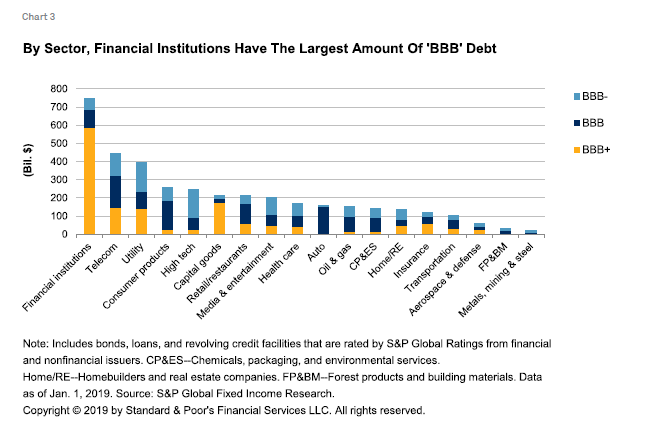
Combined with telecommunications ($450 billion) and utilities ($400 billion), these three sectors are responsible for nearly half of the BBB market. Not to mention the vital impacts they have on the economy and society in general.
Imagine if all banks become insolvent?
What if telecommunication companies cannot operate anymore and their customers are left with no internet, no cable TV, and no way to communicate with anyone?
Or, what if local utility companies can no longer provide electricity or natural gas to people?
If the industries and companies in this tranche cannot roll over their operational debts and default, this would majorly impair the functions of society. The FED cannot afford that.
So what would be an indicator to watch if the corporate bond market, and more importantly the BBB tranche, is in trouble?
Betting on the Spread
The indicator to monitor is what is commonly known as the credit spread, or CS.
A credit spread is how much more interest a corporate bond pays compared to a U.S. Treasury of the same duration. The riskier the corporate bond, the more a buyer will demand a higher return, thus widening the credit spread between the bond and Treasury markets.
When the spread is small, it’s easier and cheaper for companies to borrow money, which means the economy is healthy.
When the spread is large, that makes it tougher for companies to borrow and usually spells trouble for the economy.
That’s why when the spread gets too wide and the corporate bond market signals distress, the government and the FED usually listens.
Below is a chart of the credit spread between BBB bonds and the Federal Reserve Fund Rate (FFR). Each red box represents a crisis that hit the economy and caused the credit spread to widen (from left to right: the dot-com bubble, the 2008 subprime fallout, and the COVID pandemic).
In all three instances, the credit spread shot up almost at a 90-degree angle with an incremental increase of at least 2 percentage points.
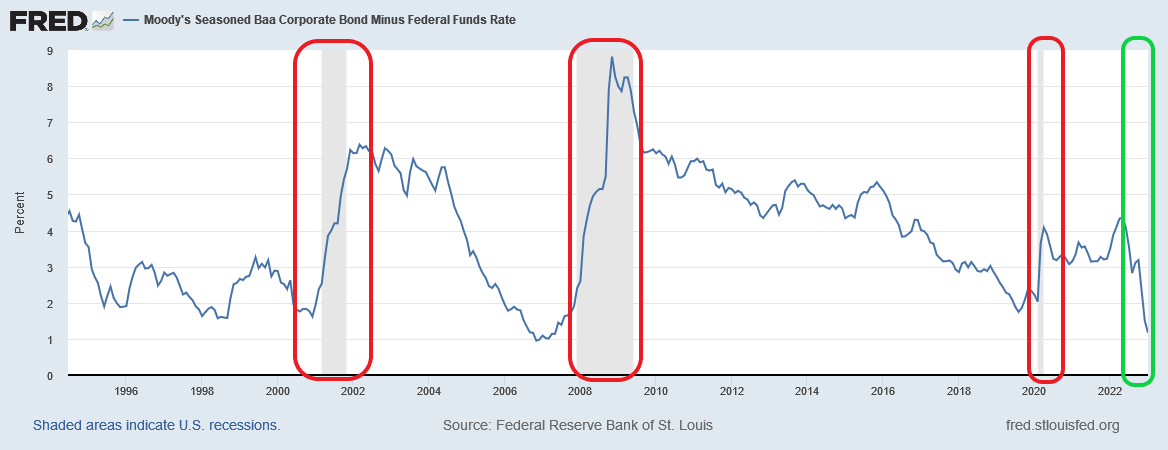
But at each instance, the FED either lowered the interest rate or conducted quantitative easing (QE), or both, to reduce the spread and make sure the economy didn’t grind to a halt.
In the third red box, the COVID pandemic event was quite acute, and the FED did not waste any time. It lowered the interest rate and resumed QE immediately in just a matter of days.
As for today? In the green box on the far right, we can see the credit spread is actually dropping currently.
What that tells us is that corporate debt is in demand. The market is looking to corporate bond markets for yield for liquidity as it moves out along the risk curve. With this high demand, companies can offer lower interest rates on their bonds.
Lower credit spreads and mass liquidity will give the corporate credit market a bit of runway here.
According to Powell, “Reducing inflation is likely to require a sustained period of below-trend growth. Moreover, there will very likely be some softening of labor market conditions.” So he’s hinting that he is willing to allow job losses and negative economic growth for lower inflation.
Based on this reasoning, the FED pivot zealots’ focus on the stock market might be misguided. If they’re looking for a better indicator to gauge when Powell and the FED will reverse their current course, the corporate bond credit spread might be it.
And while lower credit spreads and mass liquidity will give the corporate debt market plenty of runway now, it might not last much longer.
Thank you for reading Espresso. This post is public so feel free to share it.
Time for a Pivot?
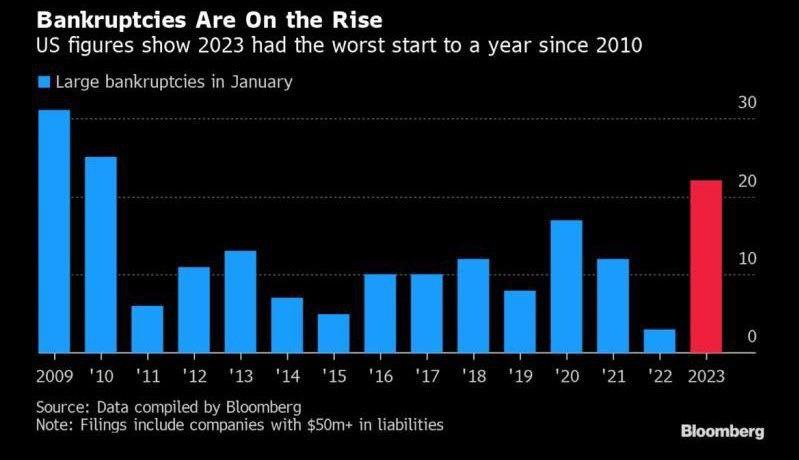
This chart says it all. Corporate bankruptcies are on the rise. They’re at their highest since the last financial crisis.
Meanwhile, U.S. corporate bond issuance has declined since 2021. The total amount issued in 2021 was $1.96 trillion. In 2022, that number was down to $1.36 trillion, a 30% drop.
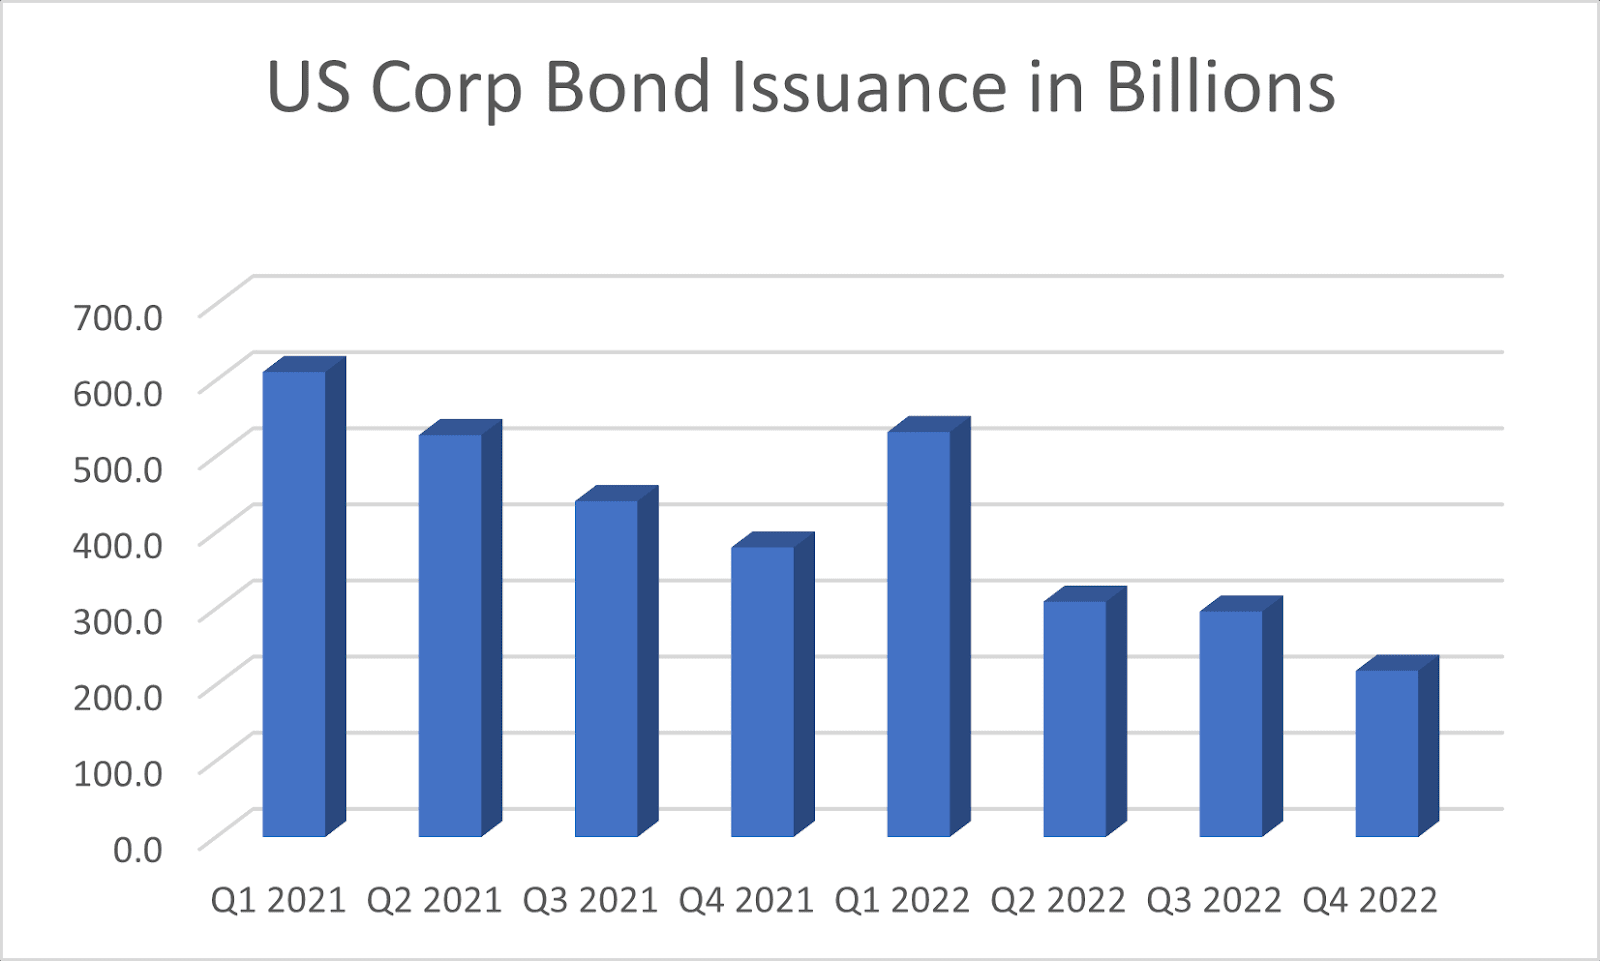
This is not surprising. Higher interest rates in 2022 made it more difficult for companies to borrow new debt or roll over their existing debts.
If this market freezes up, corporations without a large cash reserve will no longer be able to fund their operations and expansion.
This will create a shock to the system that not only will cause a drastic slowdown in the economy, but it will also require the FED’s assistance, which means more liquidity injection into the market to grease the jammed wheels of the corporate credit market.
And this is exactly the opposite of what the FED wants to do at the moment.
So, the real question is: How far can Jerome Powell push the market and cause an economic downturn that is severe enough to choke the corporate credit market?
Only time will tell.
But once the corporate credit market comes to a screeching halt, that might just be the straw that will break Powell’s back and force him to pivot.
Powell’s solution to fight inflation is to slow the economy by lowering asset prices and weakening household wealth. But an economy that is cold enough to freeze the corporate bond market is probably something that Powell does not want.
We shall see.
For investors dreaming of a FED pivot, instead of looking at the stock market, maybe consider adding the corporate credit spread chart to your watchlist.
Yours truly,
TD


