Waiting For The Biggest Bears
The Blend: Market Update
The ground is shaking.
The last thing you likely want to hear is what’s going on someplace else miles away… As you feel the unsteadiness beginning to intensify beneath your feet.
So instead of hitting on what I originally had in store - discussion on what the IMF has been up to, FedNow, and other central bankers - I’ll rework today’s Blend to be more relevant given the price movements of late.
I’ll break up today’s insights into a near-term, mid-term, and long-term discussion on what we see in the market. This way I don’t sound completely out of touch with reality.
Let’s get started.
Near Term
Last week, I mentioned during the Alpha Bites show that CARI flashed a signal. This is one of our internal reversal indicators.
The chart of CARI is below. You can see it's done well helping the team better assess the market. The blue dots are the signal. The most recent dots showed up on August 12 and 13.
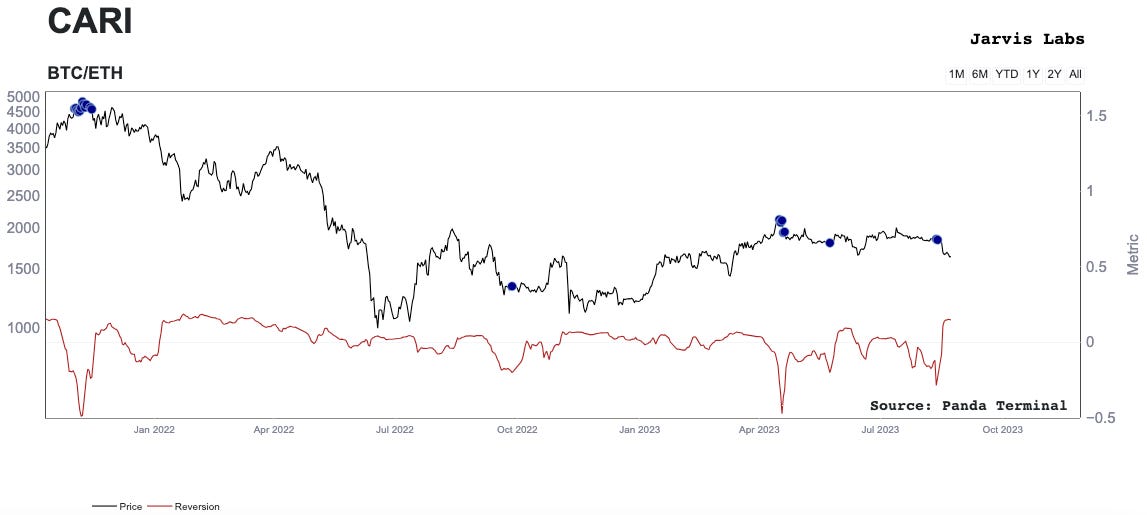
The signal paired up with some of the team’s reports that exchanges are experiencing very low trade volumes, which hinted at low liquidity. In fact, we were beginning to monitor Tether (USDT) liquidity around this time. Reason being is its peg to USDC seemed a bit soft.
This collection of observations led to us putting a bit more faith into why CARI was flashing.
We all know what happened next: the shaking intensified until the ground gave way - and prices dropped.
In response, the market became overly excited to short.
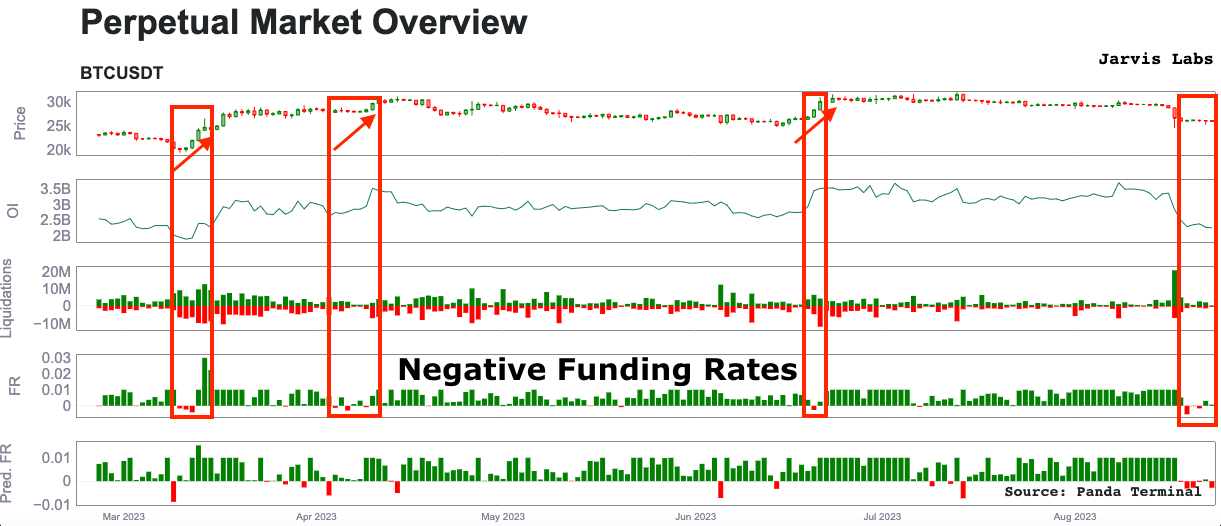
Below is a chart showcasing funding rates over the last five months. As you can see, not many occurrences of negative funding (fourth section down).
As a reminder, a positive funding rate is considered neutral. This means a long position is paying shorts to keep a position. When funding is negative, the opposite happens. Short positions are now paying the long positions to keep their positions open.
Negative funding is not normal. And it’s why when it does show up, prices like to run higher and sort out this overly eager sentiment by stealing people’s lunch money.
We can observe a similar dynamic in the options market.
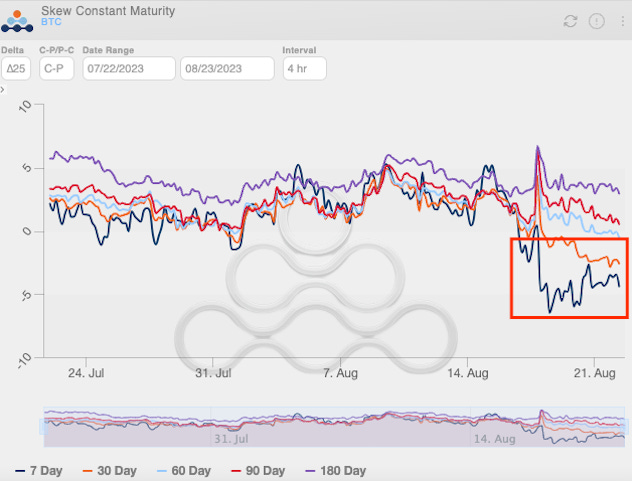
The metric I lean on for this is d25 skew. It basically takes two options contracts that are both a similar distance from the current price of Bitcoin (d25 = 0.25 delta and 0.75 delta contracts). The metric compares the two. If the figure is negative, then it alludes to an overly negative sentiment.
For crypto, a negative skew is definitely not the norm. And in the chart below, the red box highlights contracts that are about 7 days and 30 days from expiration expressing this negative sentiment.
And all this negative sentiment is taking place after the market just wiped out hundreds of millions of dollars via liquidations. It was the biggest purge event of the year. You can see in the chart below that price wiped out some long-standing, low-leverage long positions.
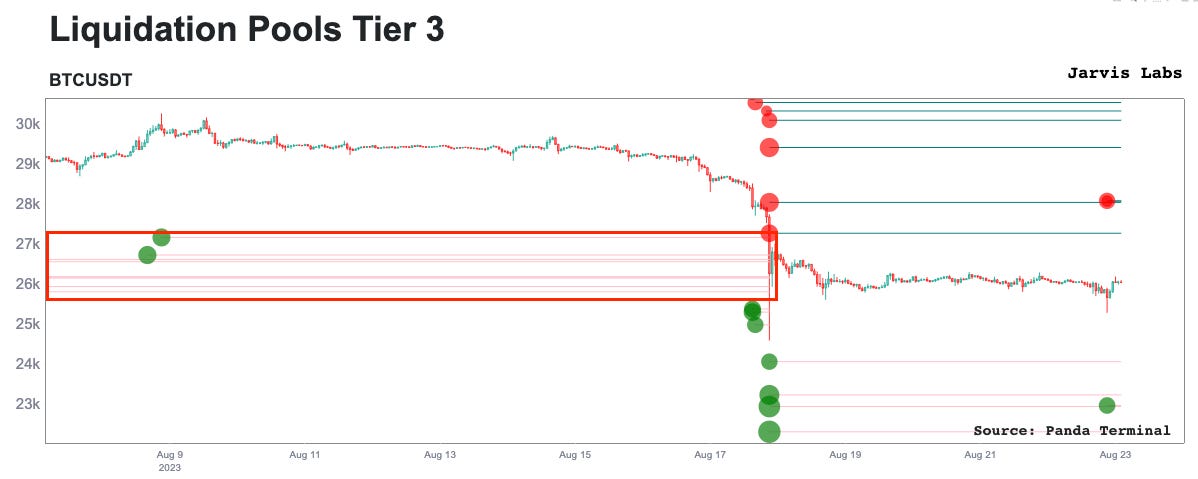
What this all says is that the market was giving away hints that price was ready to trade in a lower range. And we now see shorts are arriving late to the party.
Moving forward, I’d expect these shorts to experience some pain either through high prices or more crab walking.
But what also needs to happen is the market needs to generate some liquidity to the downside. It feels too soon for prices to suddenly make fresh lows. I could see a subtle relief here to reset some of the funding rates and liquidity.
Which is really a good segue to the mid-term view.
Mid-Term
For this outlook, we need a bit more time.
My initial impression here is we do go sideways in this range of $25,500 to $28,500 for another few weeks. Ideally, I’d like to see the chart below form a clearer pattern.
It shows CVD spot. It basically tells us if buyers or sellers are in control of the spot volume. If it trends lowers, sellers are dominant. It has been a very reliable indicator for us since the start of this year (using the 4-hour time frame).
I'm waiting for one of three possibilities to unfold. I drew them below. Basically the CVD spot metric either fails to return to the white trend lines and drops lower… Or it returns… Or it breaks above it.

I’d like to see what happens here before getting too confident in anything.
While we wait, there is one thing I have in the back of my mind. It’s the simple fact we dropped below the 200-day moving average (MA) last week.
When Bitcoin drops below this moving average, and the next halving is less than a year away, it's historically been a great buy. It also lasts only a month or two. That’s if we view the 2020 pandemic as an anomaly, which I’ll explain a bit more in the next section.
So for the near term, I’m leaning towards a relief rally to take out some overeager shorters. In the mid term, I think we get more sideways action… And eventually a plunge lower for a final shakeout… Followed by a rally that witnesses Bitcoin suck liquidity out of smaller caps, which will drive its dominance in the market higher.
This would signal to the market it’s time to march upward. That’s the event I’m waiting for in the mid-term before getting really excited.
Such a plunge before a run higher is a way to really bring out the biggest bears. It’s also a multi-month scenario.
It’s one that would create lots of liquidity to fuel a major green candle to the upside via a reversal. That would be a very strong sign that the long-term viewpoint is now ready to take center stage.
Until then, likely best to begin averaging into Bitcoin as it sits below this 200d MA… And wait for the capitulation wick.
Up Only
This section is a bit shorter.
I made mention of the stat earlier regarding the 200-day MA. And also way back in April where I went into greater detail of my longer term view, which still holds today.
Well, to add on to its importance…
After each Bitcoin halving, price didn't close below this moving average until a major top was in. That’s significant. And something not to ignore. You can see that in the red boxes below. The vertical red lines are halvings and the moving red line is the 200d MA.
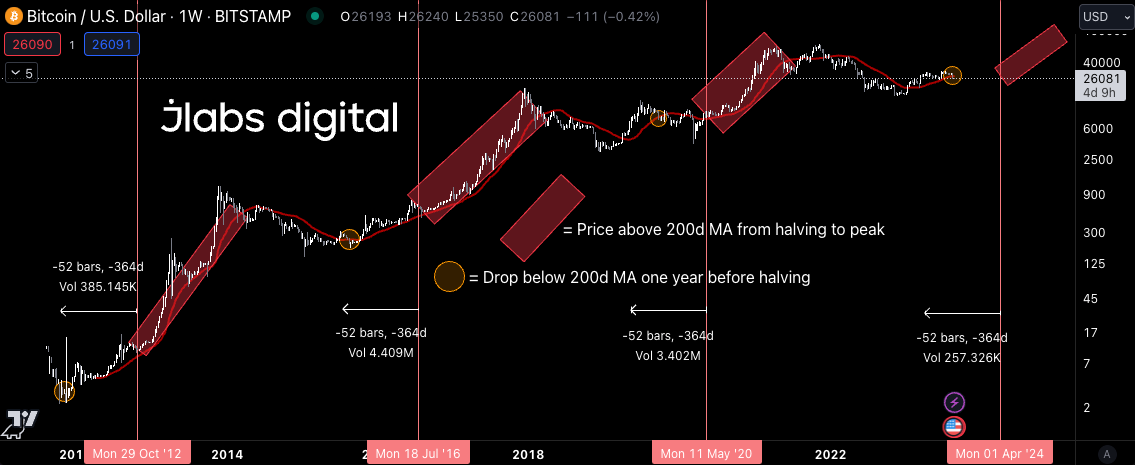
The halving is April 2024. Which suggests the mid-term price action I hit on earlier might last 3-5 months. Not just a month or two.
One hesitation that many might have here is the 2020 drop below the 200d MA, and thinking we might see that again. You’re right, we might. That was a black swan type of situation. And black swans are events that are not predictable by definition.
But what I will say is that in 2019, price ran much hotter off its low. Low to high was more than 300% gains from early 2019 to July 2019. We only saw 70% from late 2022 to the April highs this year. The market was not boiling hot like it was in the previous cycle. Which is in part why I think we have more sideways than a slow and painful march lower like July 2019.
In fact, it would not surprise me if we are above 200d MA before Q4, and still feeling like we are in a crab market.
But once we get this boring and rather ugly period behind us, it’s off to the races to all-time highs per the chart above.
That’s it for today. I tried to focus on the near term as that’s what matters the most.
Until next time…
Your Pulse on Crypto,
Ben Lilly


