Two Pathways Of Opportunity
There is a clue hidden in the data that tells us one of two paths are likely to happen shortly. Both spell opportunity.


I wiped the tiredness out of my eye and peered at the clock.
Midnight again.
Another day staring at the charts so long it felt like my brain was going to bleed.
What kept me captivated was not the data, but rather the various paths it could take.
Depending on the direction things went in the coming days to weeks, the opportunities could be monstrous.
I found myself lost in another world, imagining different scenarios that could lead to price movements and how it would play out on the charts. It’s no wonder I lost track of time.
Now for those of you familiar with the lore - I’m not much of a “shape rotator”, a slang term used to describe those gifted in STEM,
I’m just a janitor on the internet after all - my talents put me more on the “wordcel” side of the spectrum, which means I’m better at writing than I am computer science.
But when it comes to markets I have a foot in both worlds, out of necessity.
There’s no other way to succeed in trading unless you can identify and act on big opportunities before they arise, and to do so requires at least a small amount of “shape rotating” ability.
Today let’s dive into the world of ETH options to see what edge rotating shapes can provide.
Shape Shifting
The shape I’ve spent so much time rotating is seen below.
It’s ETH’s volatility surface chart.
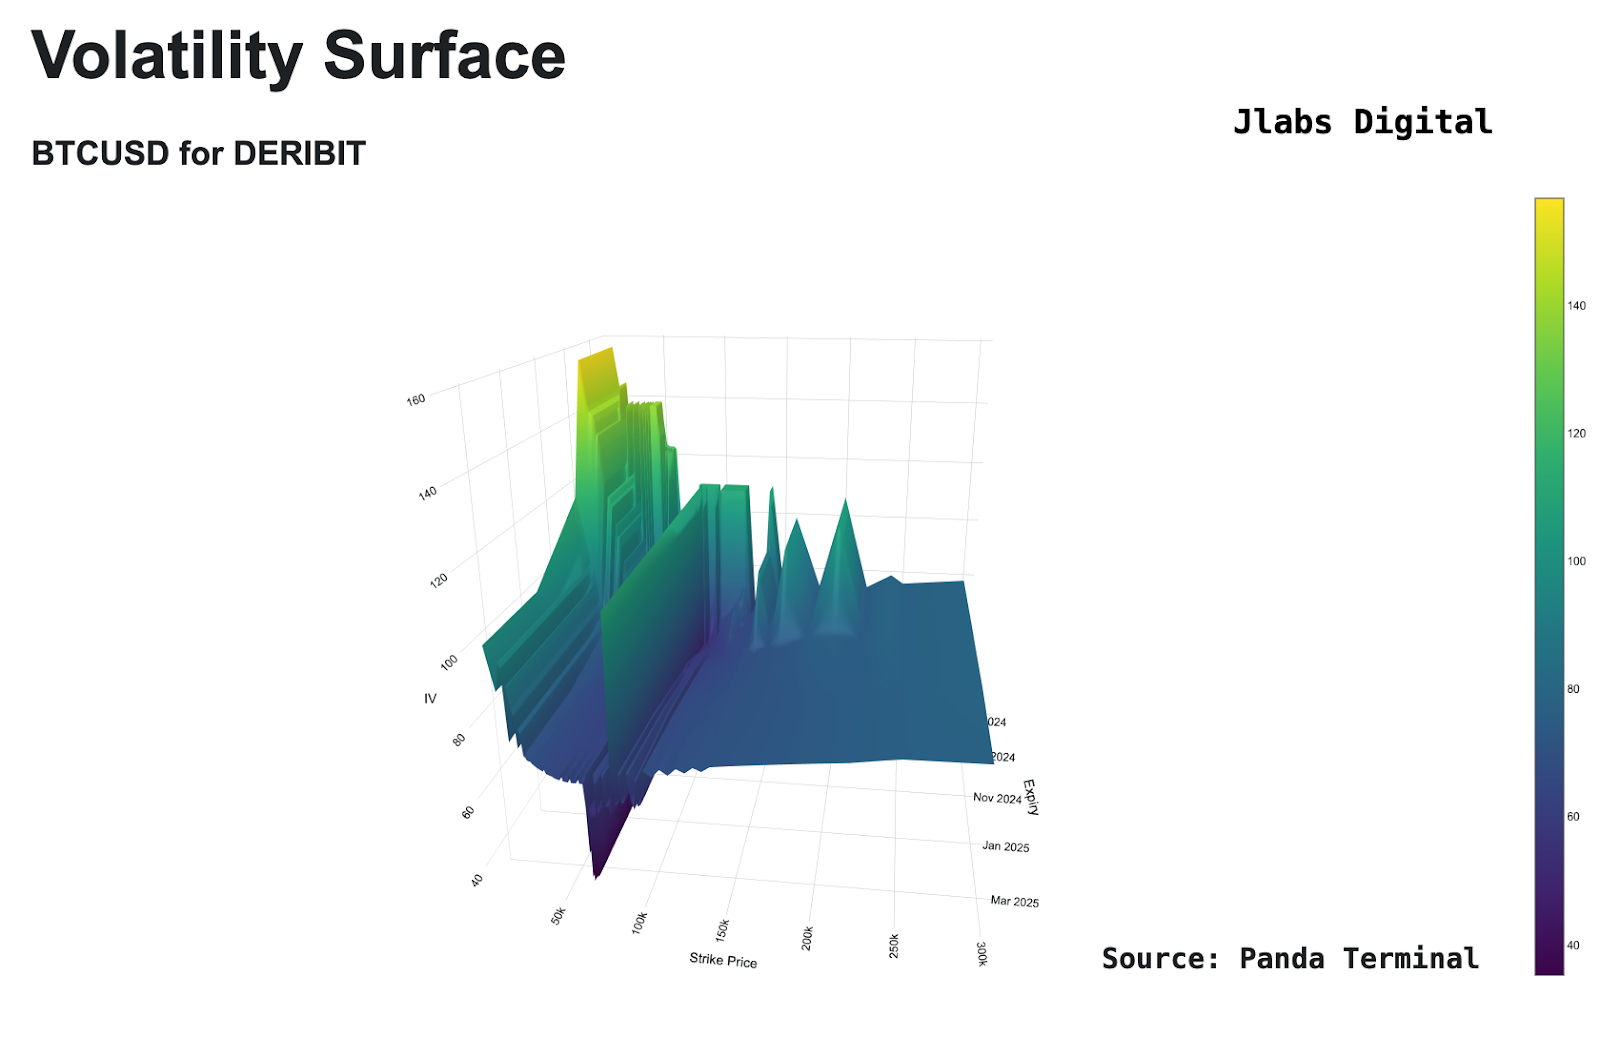
It’s a three dimensional view of implied volatility. I tend to shy away from sharing this here in Espresso since it is a bit too much to digest.
To make it easier to explain what is exactly going on, we can lean on its two dimensional cousin, the IV term structure chart, seen below.
For those not already familiar with it, what it represents is the options market expectations of future volatility on ETH.
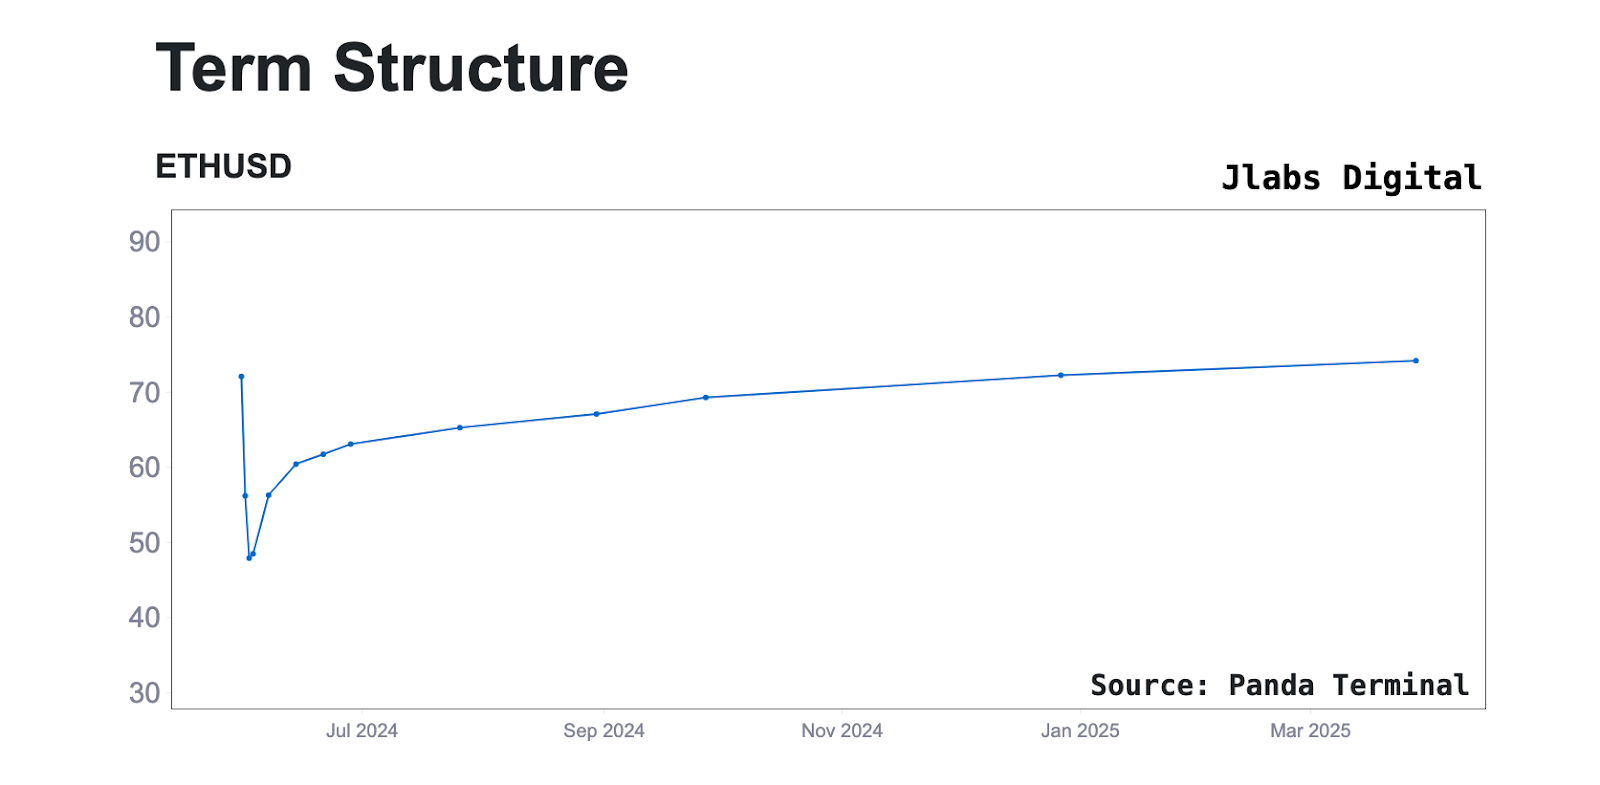
When IV scores are low, options premiums - or the cost you pay for contracts is also low. This was the case in early May when ETH IV was trading near a bargain score of 40.
The opposite is true when IV is high, when this happens options premiums skyrocket, as was the case last week, when the ETH ETF bombshell sent IV levels over 170.
What’s been most notable here over the past week is how the curve on the front-end which represents options market volatility for the summer months, namely June and July, have dropped 10 points each over the past week, as where IV on the backend has remained elevated (compare the dark blue line showing last week’s IV vs the light blue line showing current below).
It’s easier to see it when we compare the current structure to one from a week ago, seen below. Note the drop from dark blue to light blue (current).
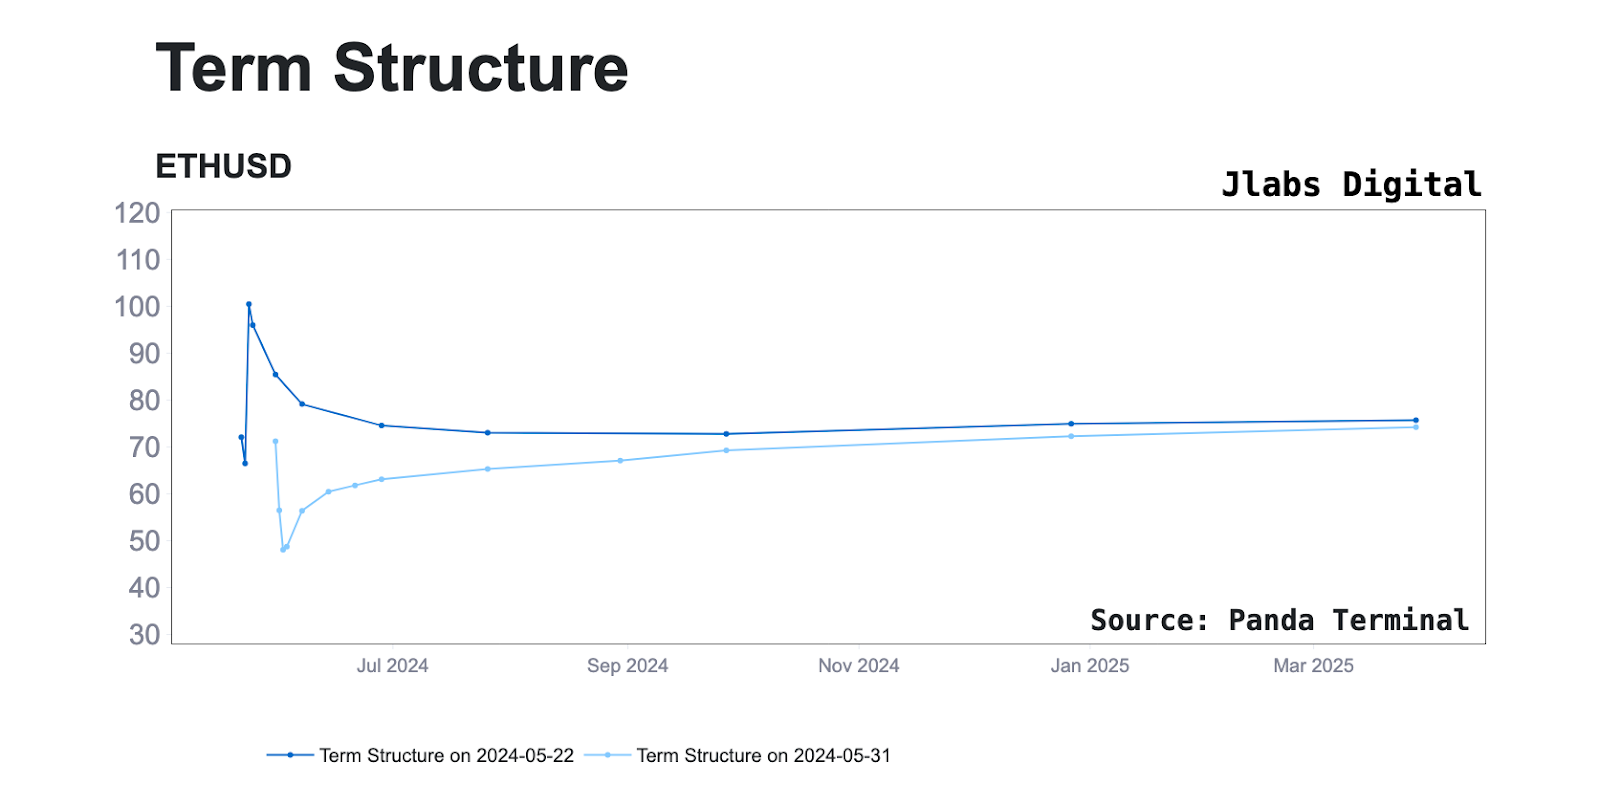
The dynamic that drove this is the market positioning itself for future upside after last week’s ETF approval news broke by buying longer dated call options, then shorting nearer dated calls as a hedge.
The short selling of nearer dated calls is what’s caused the IV and consequently options premiums for those months to decline.
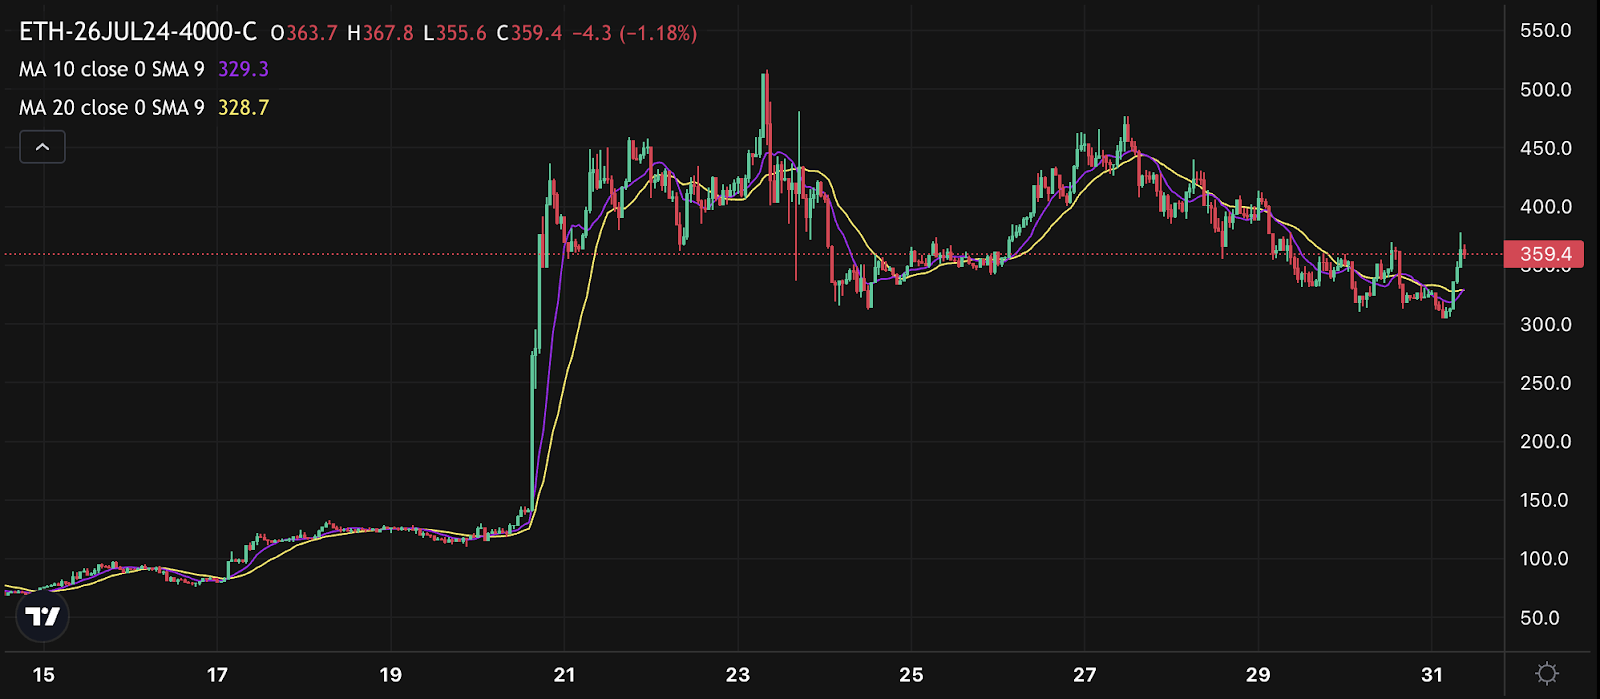
One of the features I love about Coincall is it allows us to view changes in options premiums for specific contracts over time, and when we pull up the June and July ETH $4,000 calls there we can visualize this effect all these short calls are having on premiums.
Below we see how first the June calls had their premiums decline by over 50% from their peaks last week, despite ETH’s price remaining largely unchanged.
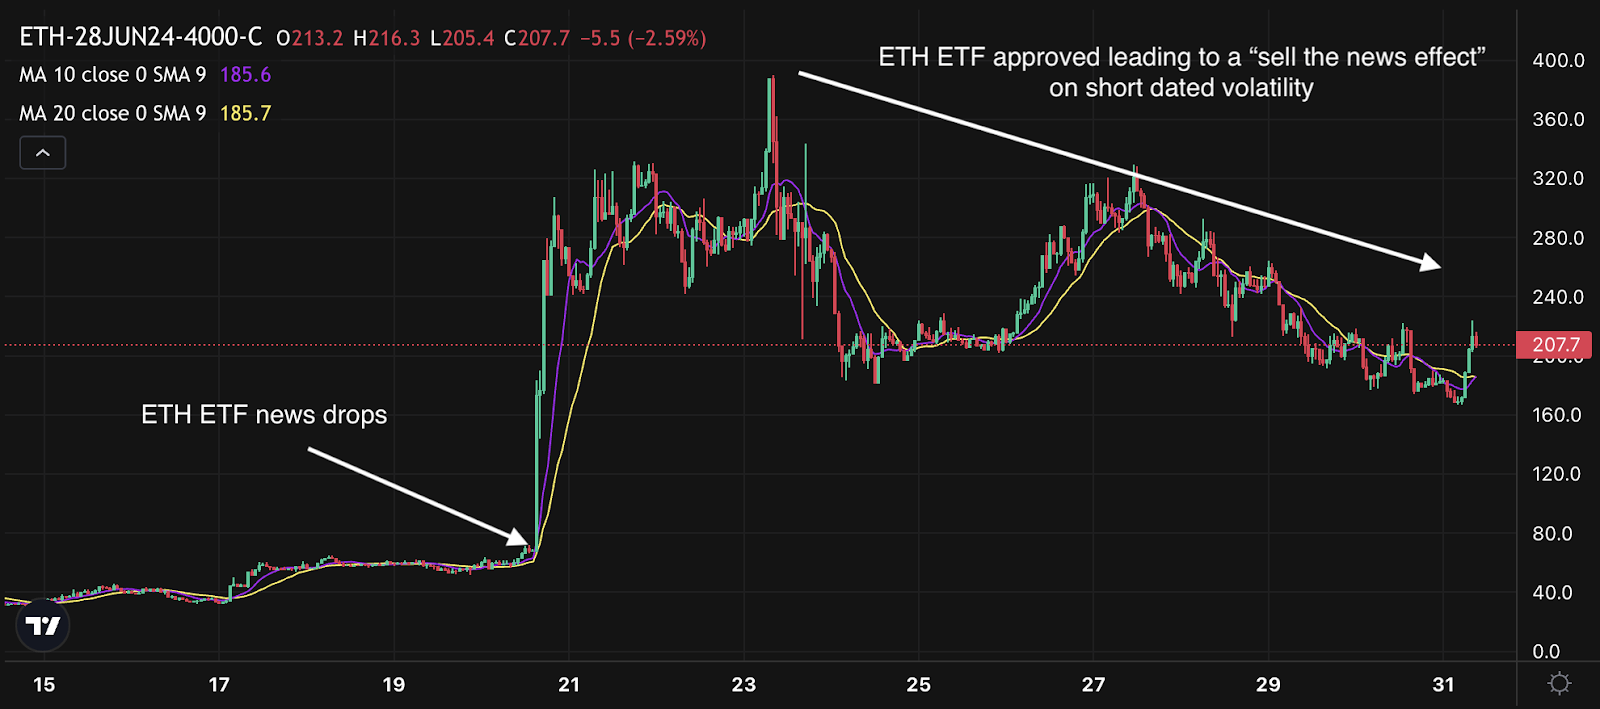
The chart of the July 26th $4,000 calls also looks very similar.
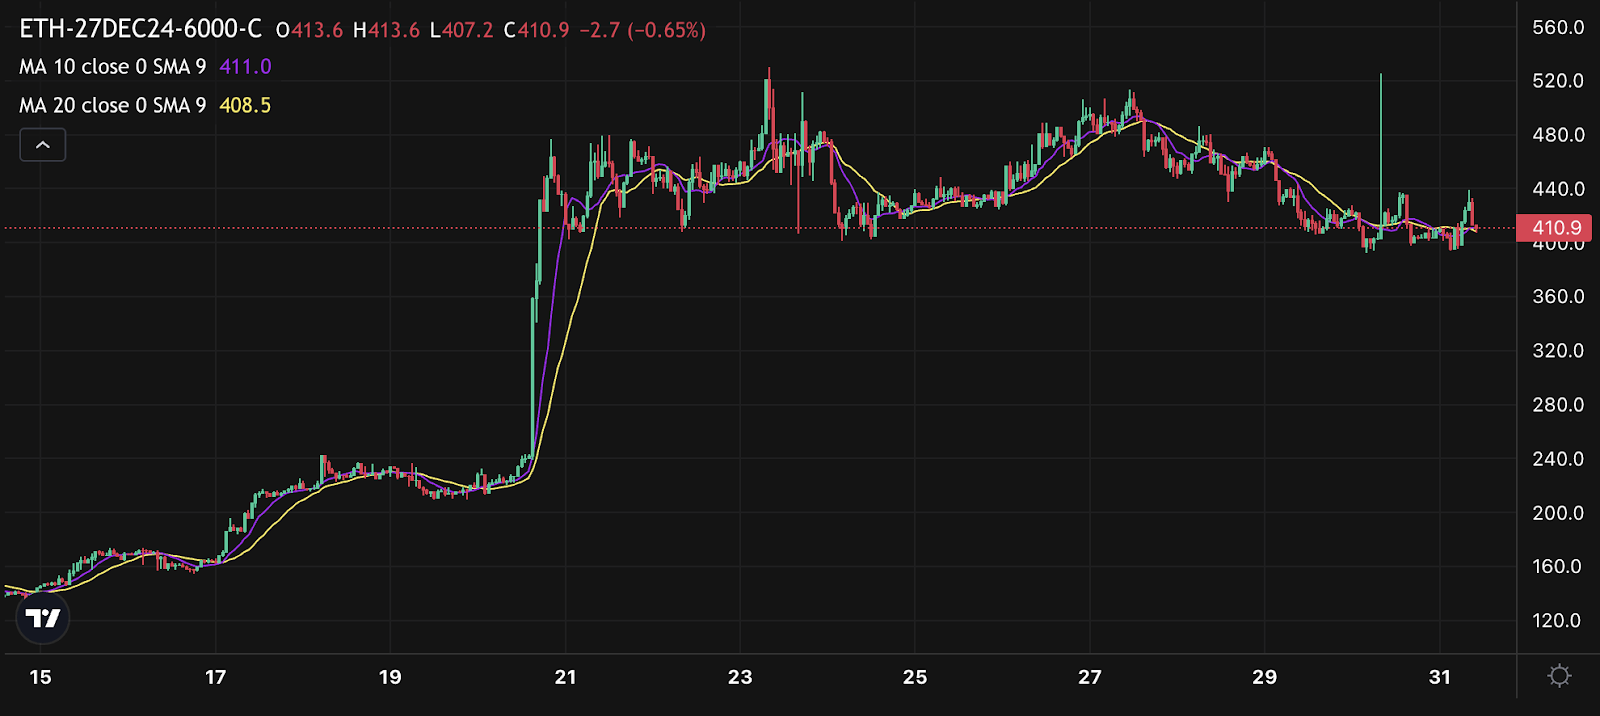
Let’s now compare what happened to December premiums.
Below is the December $6,000 ETH call, which despite having a strike price 50% higher than the June and July expiries is trading at nearly 2x the premium cost and hasn't declined anywhere near as much as the June and July expiries.
This divergence is why the term structure has the shape it has when the left-hand side being well below what we see on the right-hand side.
And it’s this difference that can create opportunity.
Bending Reality
Here’s where the ability to rotate the shape of the IV comes into play and creates opportunities….
In the coming weeks as we exit Q2 and enter into Q3 one of two things are likely to happen which will change the IV slope:
- A volatility event will happen, and send ETH to all-time highs as more people begin to front run the inevitable ETH ETF listing.
We would likely see another massive spike and inversion on the nearer dated expiries. The main difference is the shorter dated call options would be much higher than long dated options. We would see shorter dated ETH IV scores over 100, similar to what we witnessed last week.
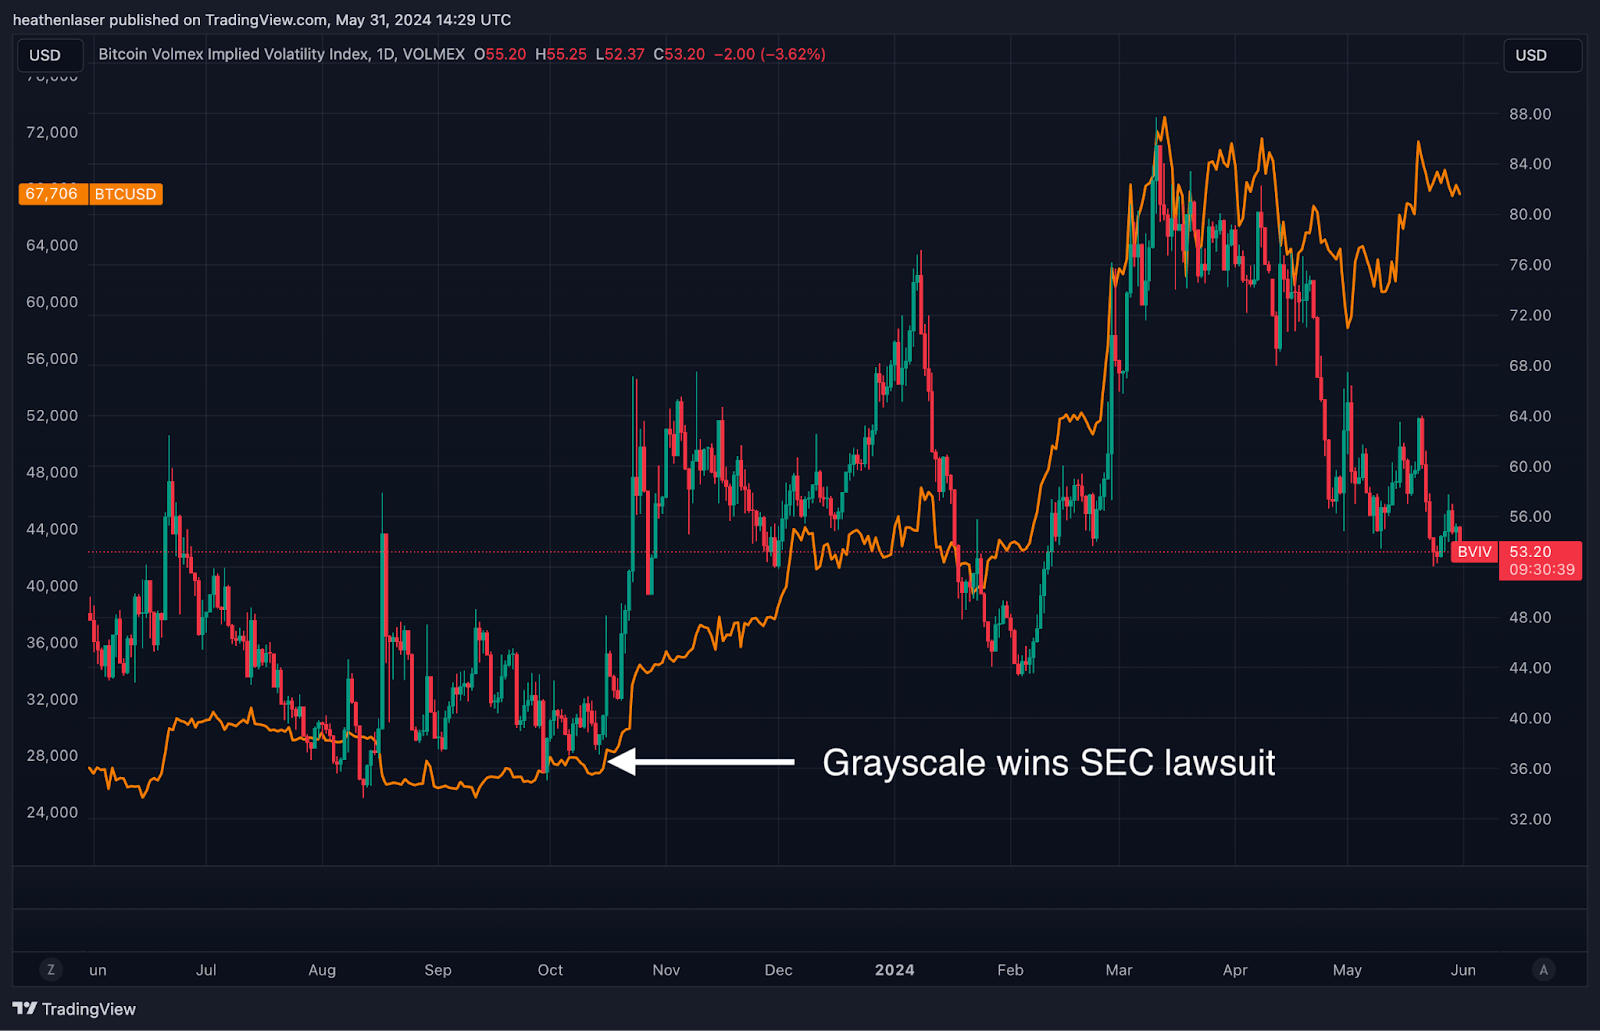
It was something that happened after Grayscale won their case against the SEC around October 2023. The case meant a spot ETF was inevitable. And it sent BTC’s price and IV skyrocketing.
We can see price and IV (as measured here by the BVIV index) rise from October through January.
The alternative and less exciting scenario is this:
- Price stagnates and retreats back towards the $3,500 range in the summer months.
In this case IVs for longer dated contracts will plummet to meet the summer month levels, and IV for the summer months will drop below 50, similar to what they were at prior to ETF news.
This would provide gains to those brave enough to sell the elevated IV levels now, and favorable call entries for the end of 2024 calls for those who missed last week’s run up.
In either event the shape will change, as will the contract premiums associated with these expirations.
Be mindful of this and be prepared to take advantage of the shift once it happens.
Until next week….
Watching the tape,
JJ


