The Valuation Series
We're building new tools starting today

How did companies with decent free cash flow and low debt levels perform on the heels of the 2008 financial crisis compared to those with higher free cash flow and higher debt levels?
I personally don’t know.
But the fact is, if you want to know, the information is readily available.
That’s because in the traditional markets we have price-to-earning, price-to-sales, free cash flow, price-to-book, enterprise value, and dozens of other ratios for doing fundamental analysis.
And being able to answer valuation questions just like this helps investors build a diversified portfolio.
Thanks to these tools we can put a value on a company in relation to others at any moment in time. We can even compare these values over time and how they respond in different macro environments.
But for crypto markets, we’re unable to compare.
We’re going through a feeling out period as these tools don’t exist. For the most part, we’re trying to form them as we go along.
At times it feels like we’re trying to hand out grades to a room full of pre-schoolers.
Many will agree with this and say the space is too young to start building these valuation tools. Which is why investors place small VC like bets across a dozen or so different projects.
They figure if two or three give you 50x returns in five years and the others go to zero, it’s still a massive win.
And while they are right, I’ll also say they are lazy in the same breath.
It just takes some sound reasoning to develop the right tools. And if you’re reading this, I suspect you’re like me and want to know how to value Cardano versus Solana? Or how to compare these layer one smart contract protocols in relation to the smart contract king, Ethereum? Should they be trading at a market cap half its value? Maybe a third?
The truth is, even if you took the time to draw out an answer, how can you even back it up with historical proof? You can’t.
This is the realm of the unknown.
We’re all trying to figure it out. And it’s something we’re currently working on right now at Jarvis Labs.
We understand newcomers to the space are presented with a dizzying array of cryptocurrency assets. They range from peer-to-peer currencies, application tokens, governance tokens, stablecoins, NFT assets and more.
It’s incredibly daunting.
And applying traditional methods similar to what I mentioned at the beginning of today’s issue is like using a flathead for a screw which requires a Phillips head. Sure, it might get the job done a few times, but it’s not a good fit for all instances.
The fact is, cryptocurrencies have additional dimensions to consider unlike stocks. Which means we need to build our own set of tools to guide us through this mess.
In the weeks to come we plan to introduce a few traits we believe matter when it comes to valuing a cryptocurrency. Ultimately, we hope these form the genesis for our whitepaper on how to value a token.
Because let’s face the facts…
Crypto is a nascent asset class. Ask ten crypto investors how they believe a token accrues value over another one.
A few of the responses will likely touch on topics such as network effects and Metcalfe's Law, Quantitative Theory of money, stock to flow models, the size of the gold market, and price to earnings.
And while each argument holds water, the truth is, each one of these valuation attempts is like throwing a dart in an unlit room. We won’t know which one is right until somebody turns the lights on.
This is not to say any of them are incorrect.
Rather I’m putting into perspective my own theory on valuation. Which is to say, I’m willing to take a turn at throwing a dart into the unknown. Which in no way means I am any more right or wrong. Instead, I consider this my own contribution based upon my own set of life experiences and own perspective in crypto, which differs for better or worse than others that put forth their thoughts.
In this vein, I’m adding my own unique layer onto a canvas that many have painted on before me. Better yet, by standing on the shoulders of the giants that came before I hope to progress this work further.
In doing so, I encourage dialogue and discussion to take place. This is how I hope to further solidify this current thesis and ultimately arrive at a good framework before the unknown becomes known.
Consider this a call to action. I’ll be calling these essays the Valuation Series, and if you find it appalling or highly inaccurate, please take the time to write your thoughts out. While your criticism might be harsh, I promise I’ll consider it feedback and a collaboration.
Be on the look out for the first of this series next week. In the meantime, I’ll leave you with a sample sized scoop of alpha before we finish...
I introduce to you, the DeFi thirty day correlation matrix.
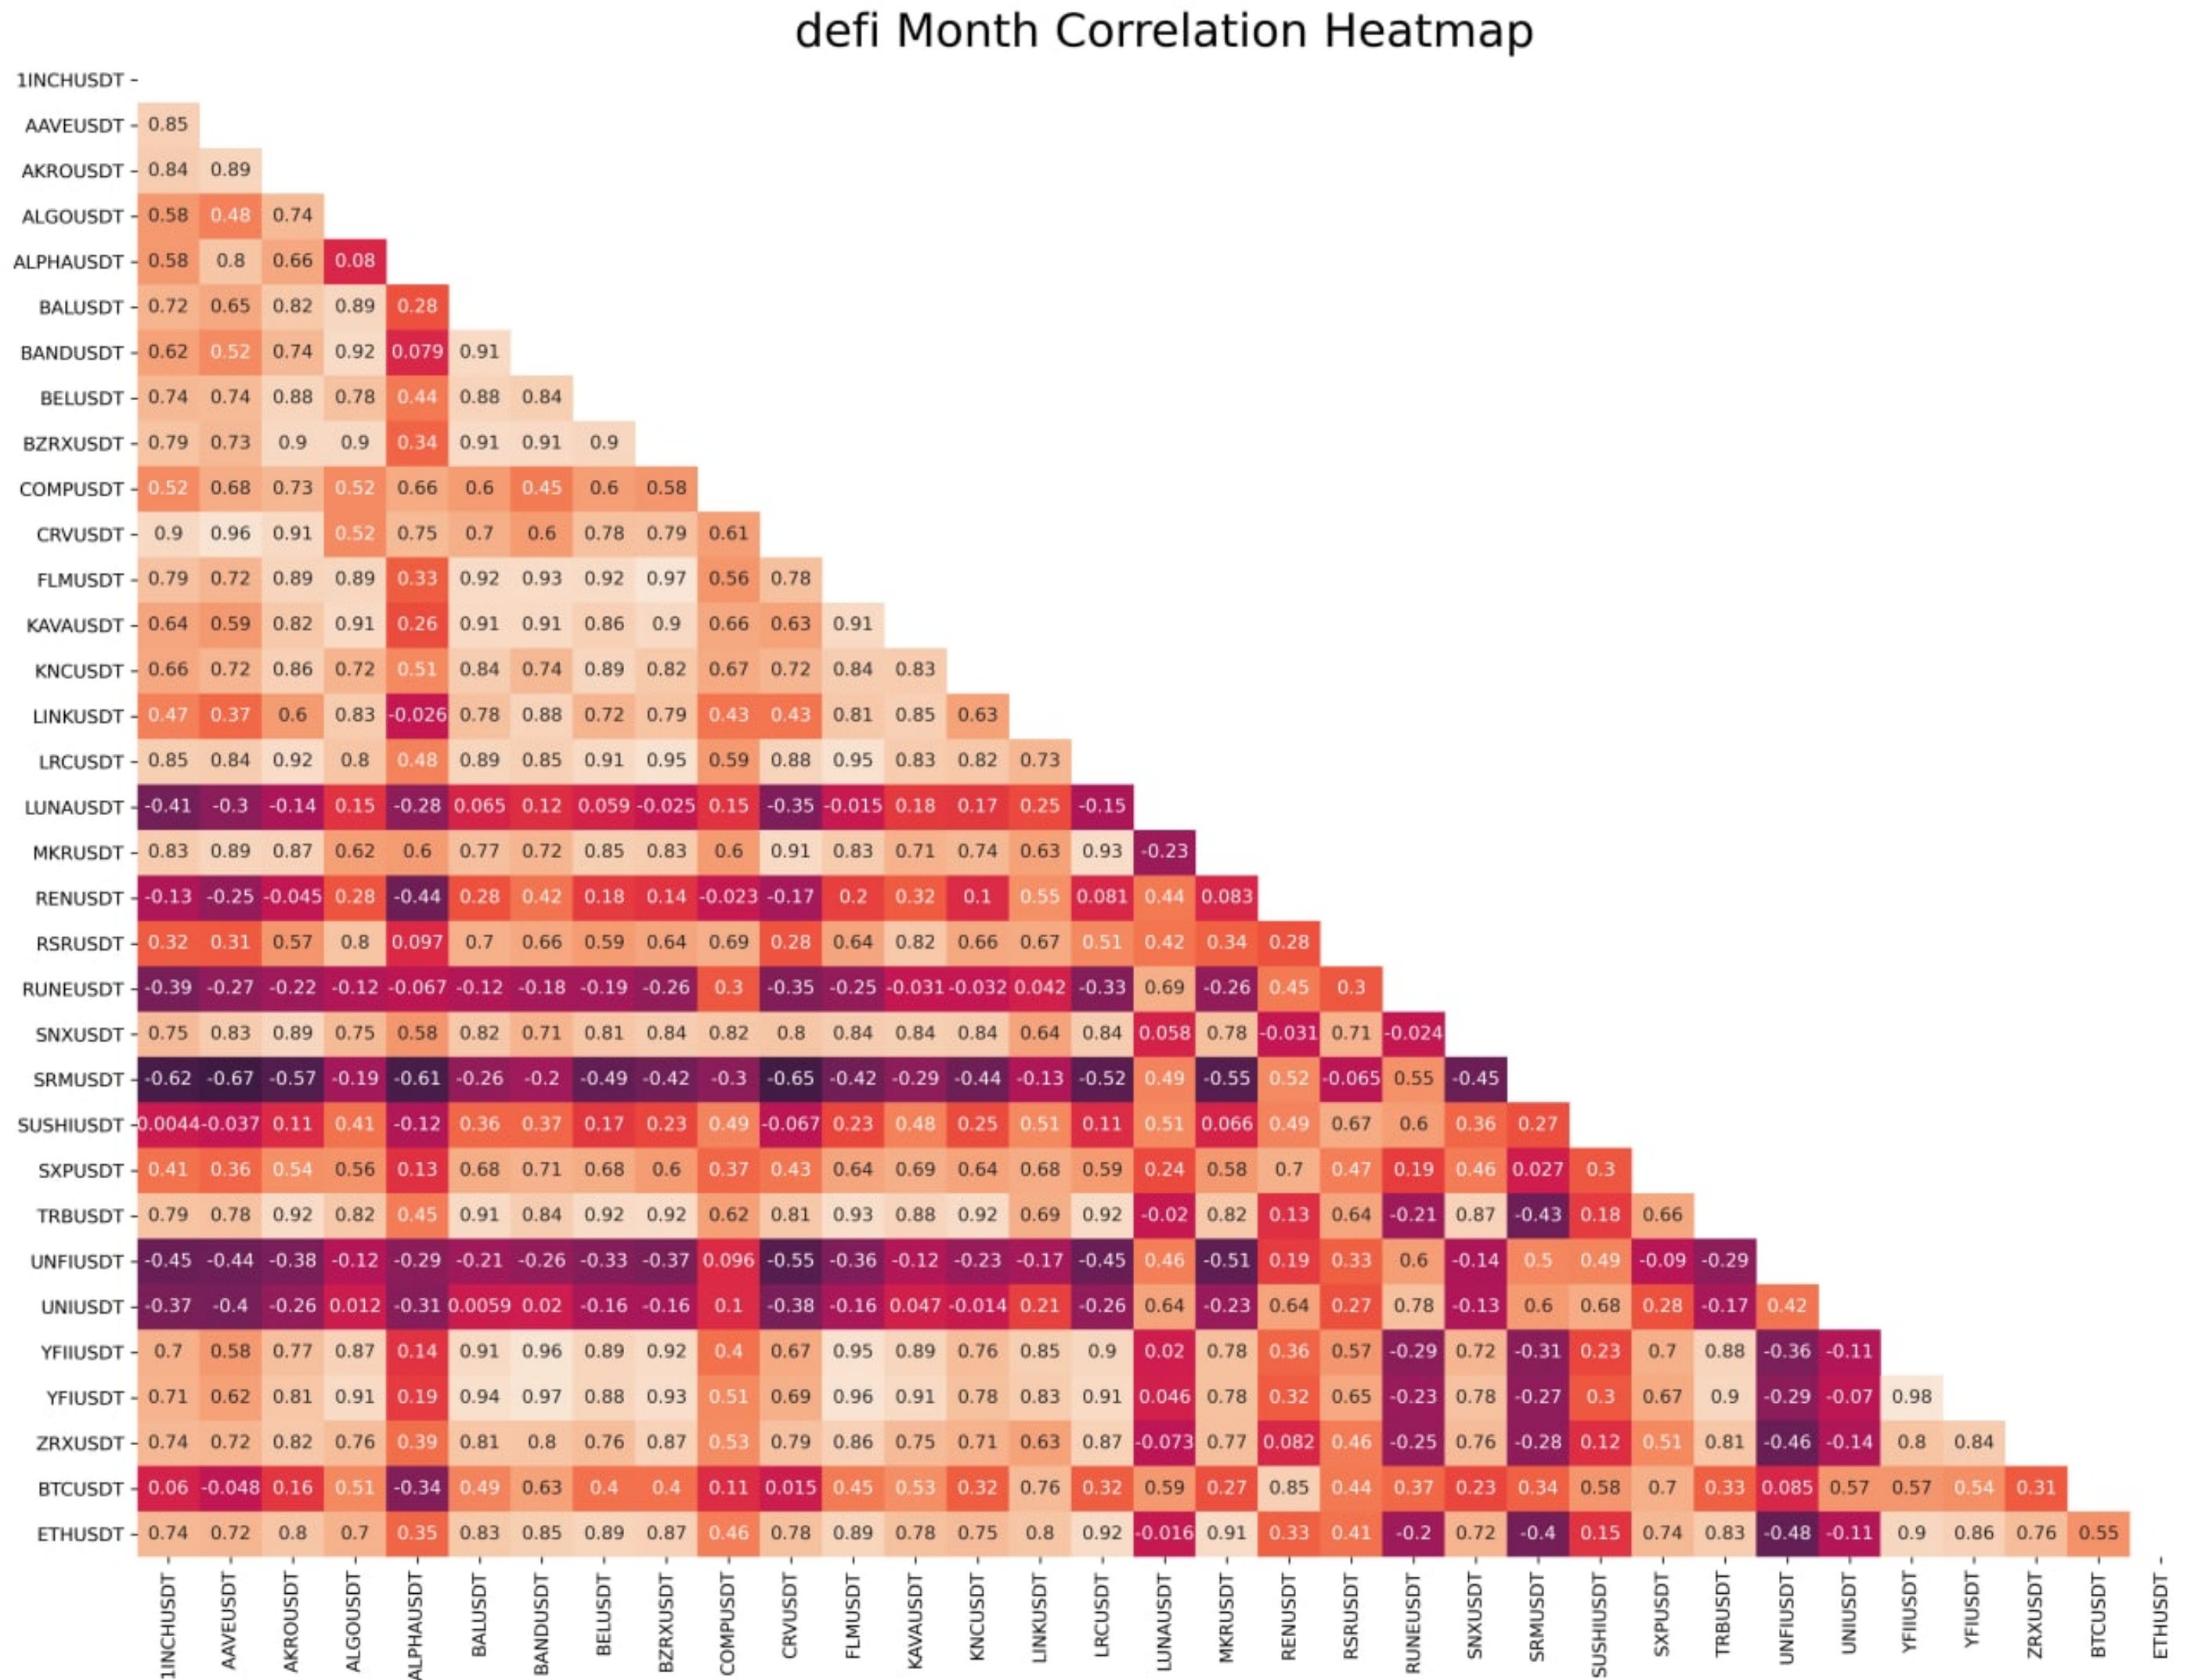
Here are more than 30 different assets that we classify as DeFi. It’s a snapshot of how these tokens move in relation to one another. If the value is positive and above zero, you can consider these two assets to be highly correlated to one another. Meaning they tend to move in tandem with one another. The higher the number the stronger the correlation
If the number is near zero then they tend to move irrespective of one another. And if the number is negative the two assets tend to move in the opposite direction of one another… The larger the number or more negative the number, the stronger the negative correlation.
So how do you use this type of information?
Say you’re wanting to build a portfolio of multiple assets that you believe have a strong chance for price gains in the coming weeks.
If you picked, say 1INCH and ETH, these two might go up and down with one another since they have a 0.74 correlation. This means you’re not really hedged to the downside, so maybe another token is better suited if hedging is something you’d like to incorporate into your plans.
So you substitute 1INCH for LUNA.
ETH to LUNA has a reading of -0.016, which is essentially zero. This means ETH might go up while LUNA stays steady. Or ETH goes down while LUNA stays steady. Understanding this means you can scalp or adjust positions as these tend to meander amongst one another.
It also means there’s a bit of hedging in your portfolio.
The same applies for two assets with high negative correlation.
Let’s take ETH and SRM. These two have a -0.4 reading. So this might mean when ETH rises, SRM falls. Or vice versa. If that’s the case, if ETH rises and you think it’ll pull back, go ahead and scalp some gains and move them into SRM. And when SRM starts to run, shave some profits into ETH.
In this way a trader can balance two positions over time using a second token as a hedge, and over time generate higher returns.
It’s a powerful tool, and how you ultimately use it is up to you. The examples I gave are simply examples. Just because assets have correlation or negative correlation is no guarantee it’ll exist over the next thirty days. Let this serve you as a reference. We’ll look to send more updates on this in the coming weeks.
Until next time…
Your Pulse on Crypto,
B


