The Market's Next Phase
Macro Cycles Part One: Eurodollars


Housekeeping note: I will soon start publishing essays about fundamental analysis and several theories created by a close friend of mine on token economics. Topics include how to interpret tokens like economies, characteristics of a healthy economy, and a new Metcalfe Law model among others. You can join the conversion here.
As I write these words, I have no idea where the analysis is about to take me.
I’ve loaded my Tradingview software with about 30 various eurodollar futures contracts, about a dozen US treasury yields, the federal funds rate, inflation, and equity indexes.
The goal in doing so is to create a frame of mind for how the next year or two looks like through the lens of two primary things: the U.S. Federal Reserve and debt.
From there I believe we can start making some assumptions about bitcoin and cryptocurrencies as a whole. Then track those assumptions as they begin to play out or prove to be wrong.
And if we lay it all out here we now have a reference point to understand how things are unfolding as it happens.
The motivation for this came after Arthur Hayes wrote his piece called, “Maelstrom”. I got a flurry of messages from people thinking the world was ending. Instead of giving my opinion I decided to do some research of my own.
And based upon my own interpretation of the market before I start this essay, the word maelstrom seems spot on. It means a state of confused movements. Given the FED is transitioning from a stance that helps inflate asset prices to one that seems like it might cause wreckage, investors across the board all have seeds of doubt - including me.
So I wanted to do what I enjoy most, writing it down to form my own conclusion.
To get started I decided the macro indicators listed earlier are a good first stop for research.
My hunch before I get too far along here is that this is going to be a three part essay. Substack likes to flash warning signs whenever I start posting a dozen charts or so, which is why breaking this up into sections might help. It also might help me in using enough ink to explain things in an easier manner.
For today’s first essay the topic I’ll focus on is Eurodollars. I know, it’s making you pant already. Next, we can move into Treasuries, and then end it with a discussion on how unique this setup is today as we loop inflation into the mix.
Now, one thing to keep in mind before we start is my base assumption throughout my analysis is that the world is U.S. centric. While central banks around the world might look to front-run policies being discussed by the U.S. Federal Reserve (FED), these decisions are being made with the FED in mind. Even China makes currency conversions with the USD in mind.
Additionally, with the world being U.S. centric that means cryptocurrencies are reactionary to a lot of the macro policies employed by the FED.
With that out of the way, let’s figure out what the heck is going on today and what the next couple of years might look like by looking back through history.
It’s Priced in
Eurodollars… One of the most opaque and yet insanely massive part of the financial system. It’s the less regulated version of the U.S. dollar that resides in Europe.
Explaining the way these U.S. dollar aboard are birthed would take up a lot of time - and frankly, I don’t even fully understand the accounting methods that give rise to their existence. But for perspective in how important they are, the December 2022 Eurodollar contracts have 1.27 million contracts of open interest.
Each contract is $1 million in size. Which means for one contract we are talking trillions of dollars of interest. I don’t think I need to tell you that’s a lot.
In terms of why these contracts are even traded in the first place, I’ll use Chicago Mercantile Group’s explanation, “Eurodollar futures and options are the preferred tool of traders to express views on future interest rate moves”.
Summed up, Eurodollar futures are an expectation for what interest rates will be at the time of their expiration.
If you think rates in some year down the line will go up or down for whatever reason, then you can use these contracts to profit.
Now, the interest rate in question is the LIBOR rate… yawn. It’s just another type of borrowing rate created between banks. But to keep the essay simple and convenient for myself I will refer to Eurodollar futures as the FED’s rate since that’s what LIBOR is tracking.
So for our purposes here I will use Eurodollar futures as a proxy for future expectation of FED rates.
For a quick example on how we can interpret what the price of contract means, right now the June 2022 contract is 99.3. If we take 100 and subtract 99.3 from it, we get 0.7. Which tells us in June the market thinks rates will be at 0.7%, higher than where we are today.
Why does that matter?
The FED has been jawboning about higher interest rates for a couple months now. So the question comes up whether or not the market has price in these expected hikes or not.
Eurodollars… Exhilarating, am I right?
I know it’s probably one of the most boring things I’ve ever talked about. But we need to eat our veggies here if we want to be strong enough to endure the crypto shock waves of 2022 and beyond.
And in terms of crypto, these rate hikes in relation to bitcoin dropping from taper talks is a market take I don’t fully agree with.
In the chart below you can see on October 11, 2021, the December 2022 contract - the lightest blue line at the top - already priced in about two, almost three rate hikes. This was before the FED really ramped up its hawkish stance in Nov-Jan.
To pile on to the fact, later contracts were pricing in much more. In fact, each colored line is a different contract at a lower price aka an expectation that future rates will be much higher.
The top line… again… is the Eurodollar futures contract with an expiration date of December 2022. Each line below is the next year’s December contract (ie - 2023, 2024, 2025). The bulk of contracts were trading between 98.5 and 98 - substantially more than just a few 0.25% or 25 bps rate hikes.
That’s why I don’t think the Fed’s comments earlier this month took the market by surprise.
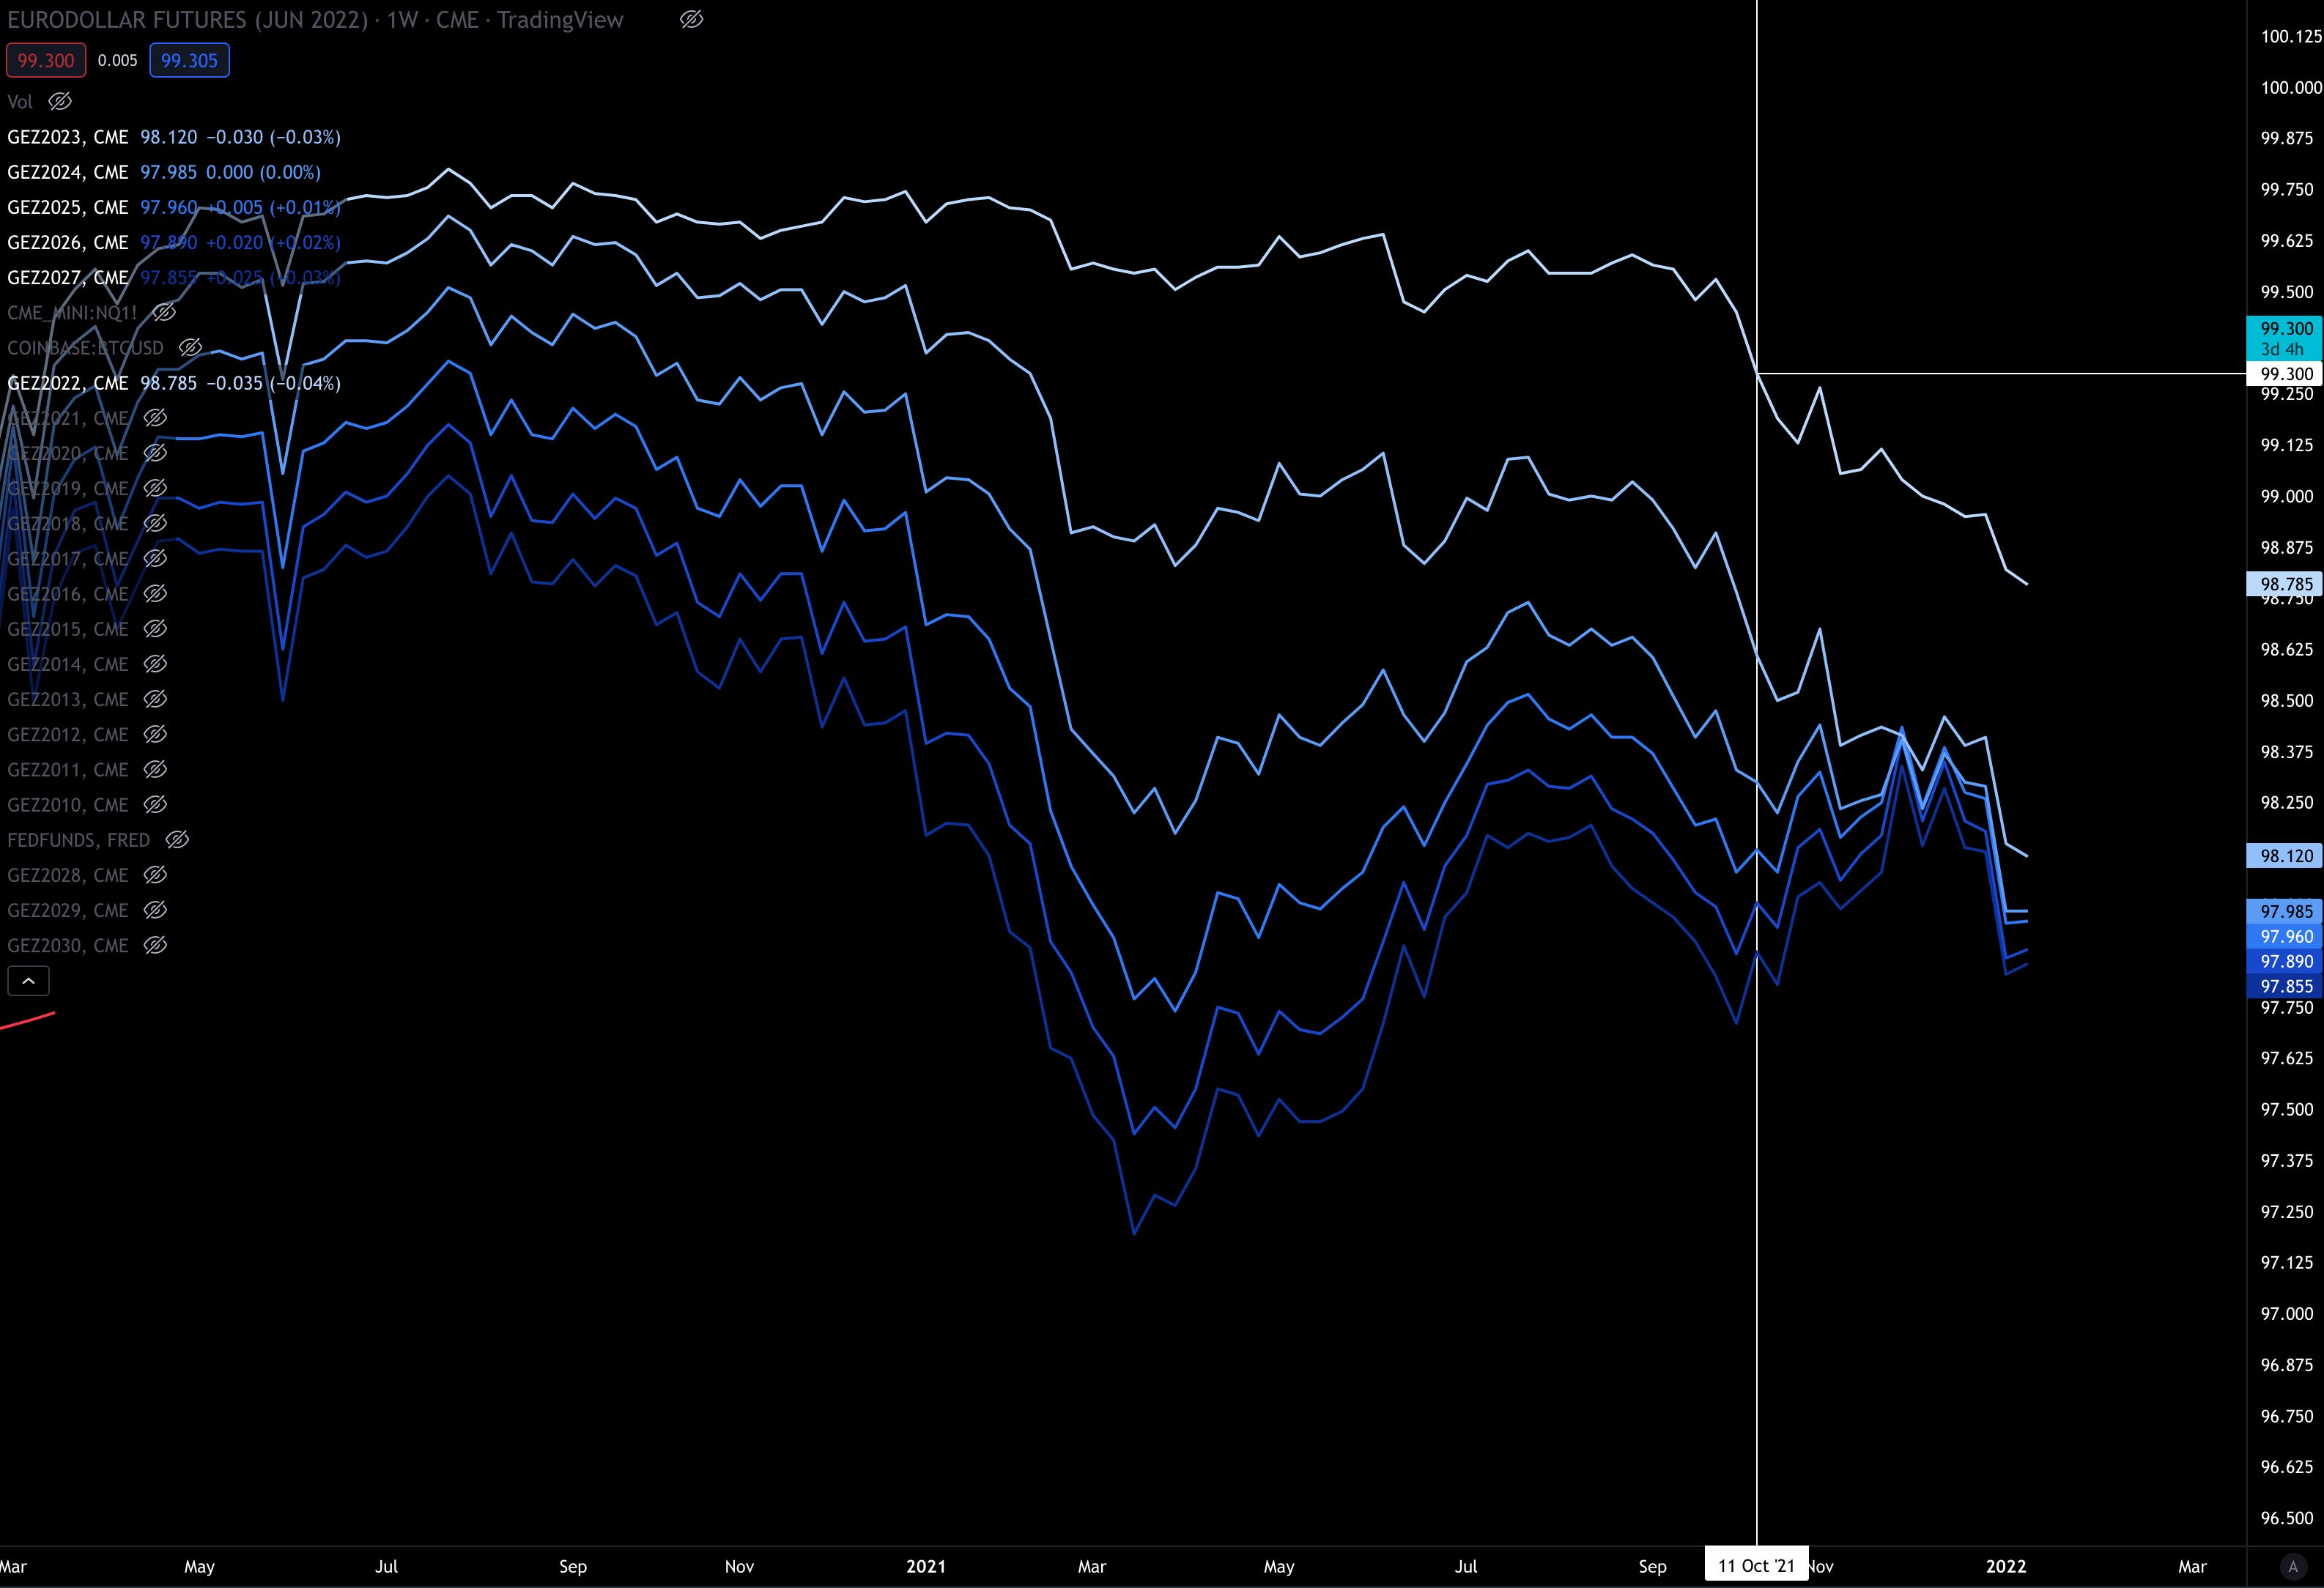
BUT shortly after that October time period, which was before bitcoin and crypto topped out, Eurodollars experienced an inversion. An inversion is where later expirations cross above earlier expirations. That’s not normal.
It is an event that can signal possible trouble ahead. It happened in December and to me it suggested real Maelstrom happening in the markets. During this period crypto was subject to this confusion.
Then to pack on to the fact that the market wasn’t just moving in part because of the FED… The market was running out of steam.
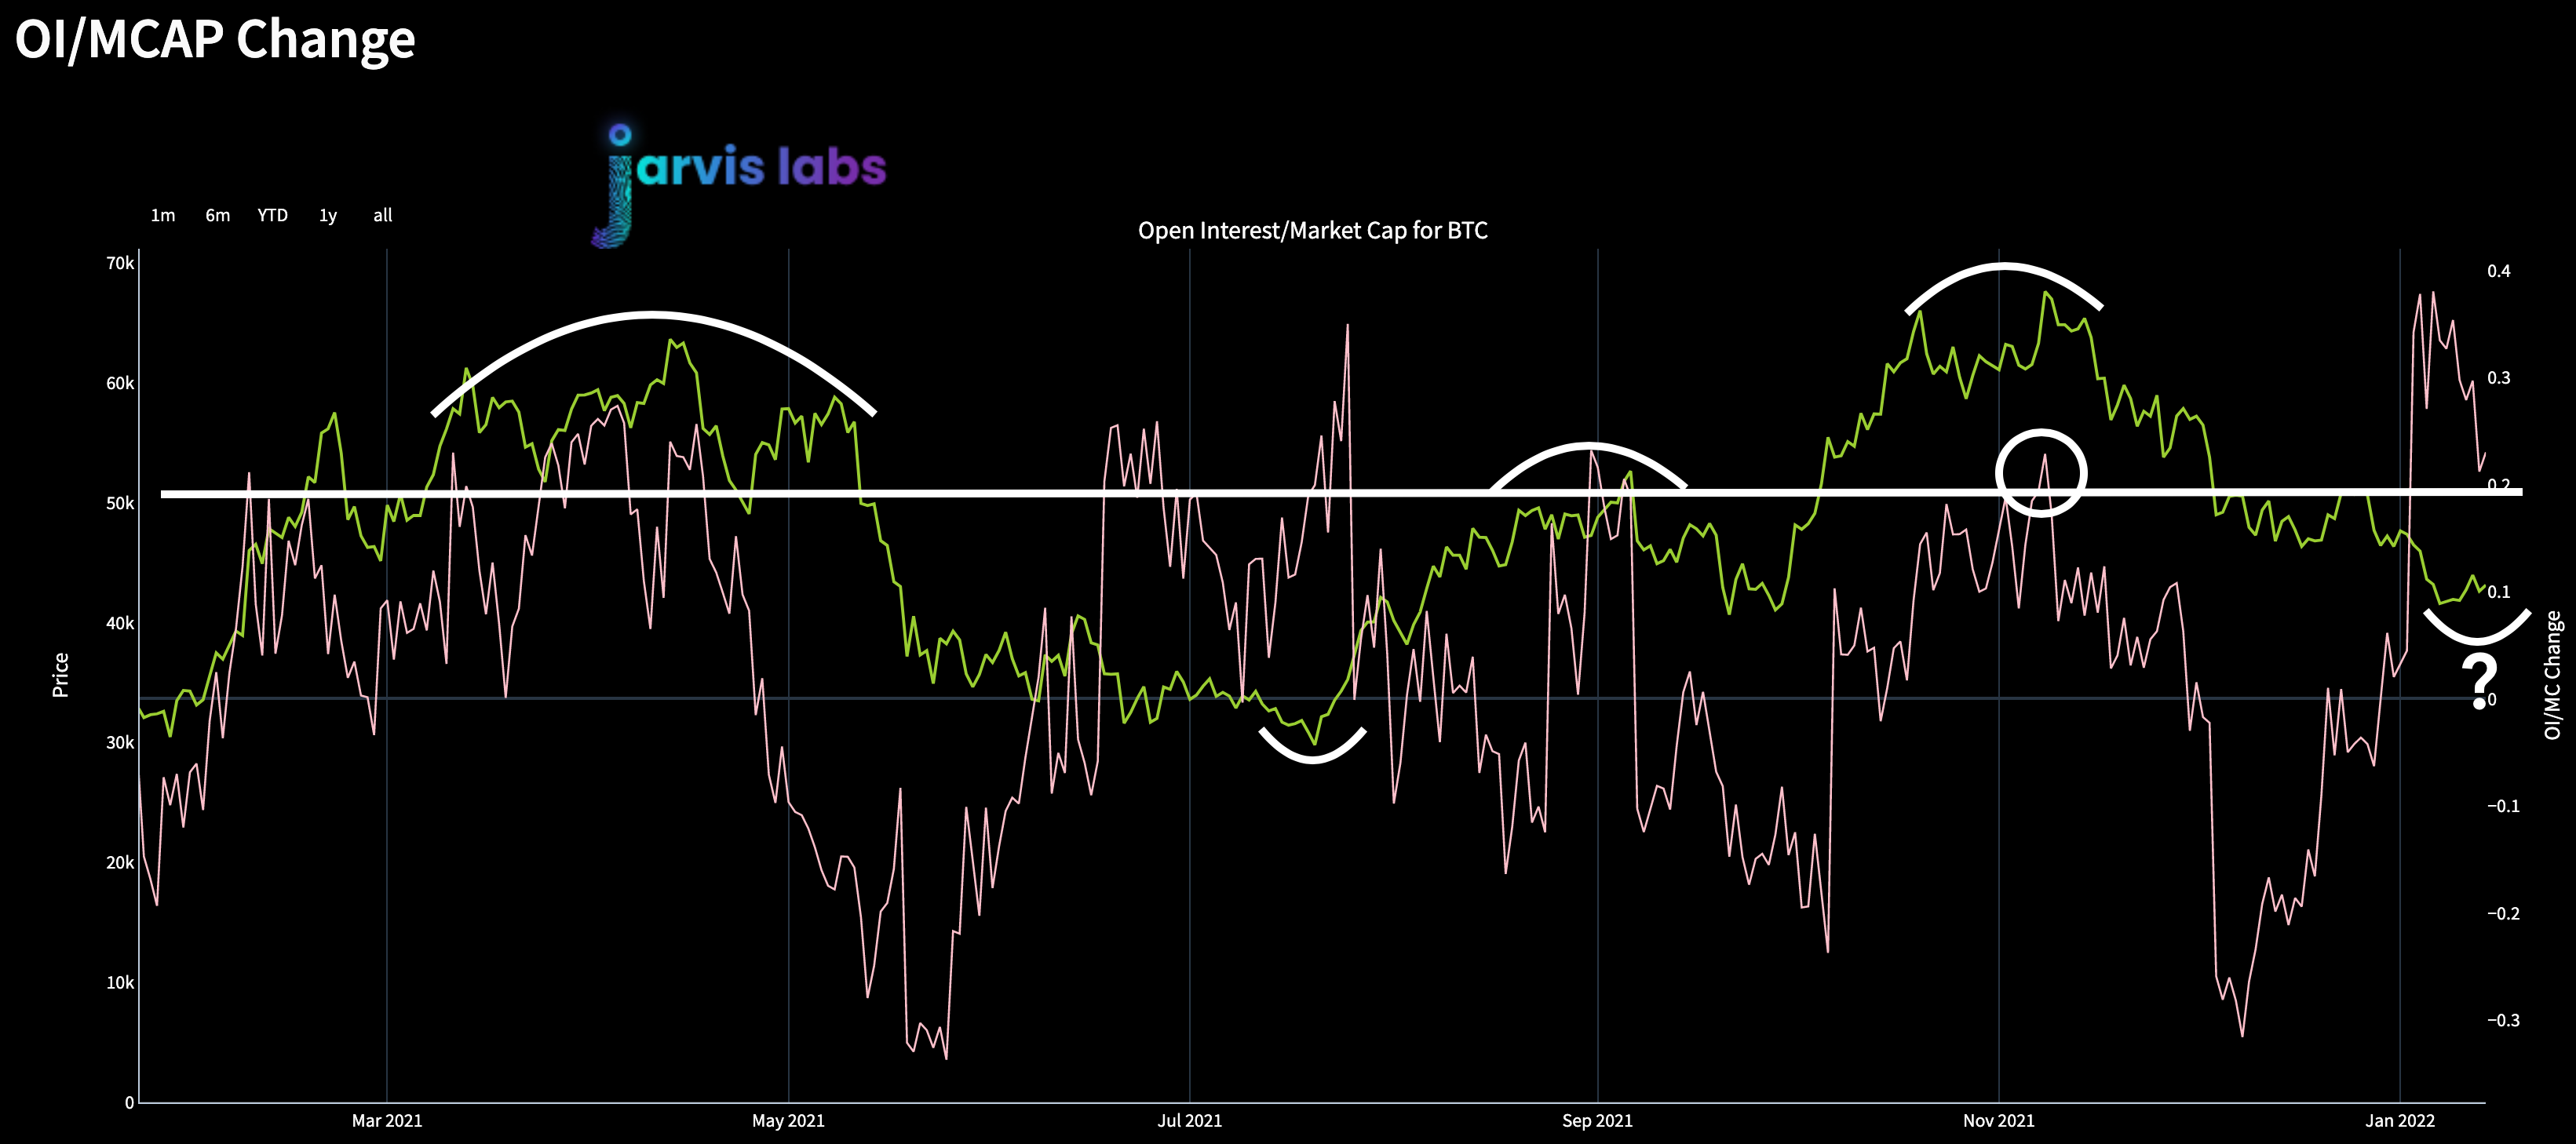
Here’s a chart showing the change of open interest in futures in relation to the change in market cap. This is important because as trends get exhausted, each new dollar of open interest has less impact on the change it has on market cap.
It suggests a market reversal is near.
In early November this is exactly what we had. Whenever the pinkish salmon line went above the horizontal white line, the trend was getting exhausted. The white curve lines show the change in price that unfolded in bitcoin.
Interestingly enough, it’s sort of happening as we speak - reminds me of late June/early July again.
But getting back to the “pile on poor market takes” party…
On January 5th Kazakhstan lost internet causing bitcoin’s hashrate to drop about 18%. That same day bitcoin dropped from just over $47k to $42k.
Markets didn’t necessary drop because of the hashrate. It was more about hashrates causing negative indicators to appear.
Sure, the fact the FED’s hawkish FOMC comments were released to the public did not help.
But the fact is, if you were a macro trader, somebody who was concerned about the health of the bitcoin network, or somebody following metrics like the change in open interest in relation to market cap I don’t think it mattered. The market was already soft.
And to get back to my earlier point and drive it home… When bitcoin topped out in November, Eurodollars were pricing in about 1% rates by the end of 2022. So three rate hikes in 2022 was not a surprise to the market. In fact, anybody tuned in knew the talk around “QT” was nearly a given.
In my opinion the only thing that the recent talking points from the FED did was kep capital on the sidelines. Demand was already low, this just made it worse.
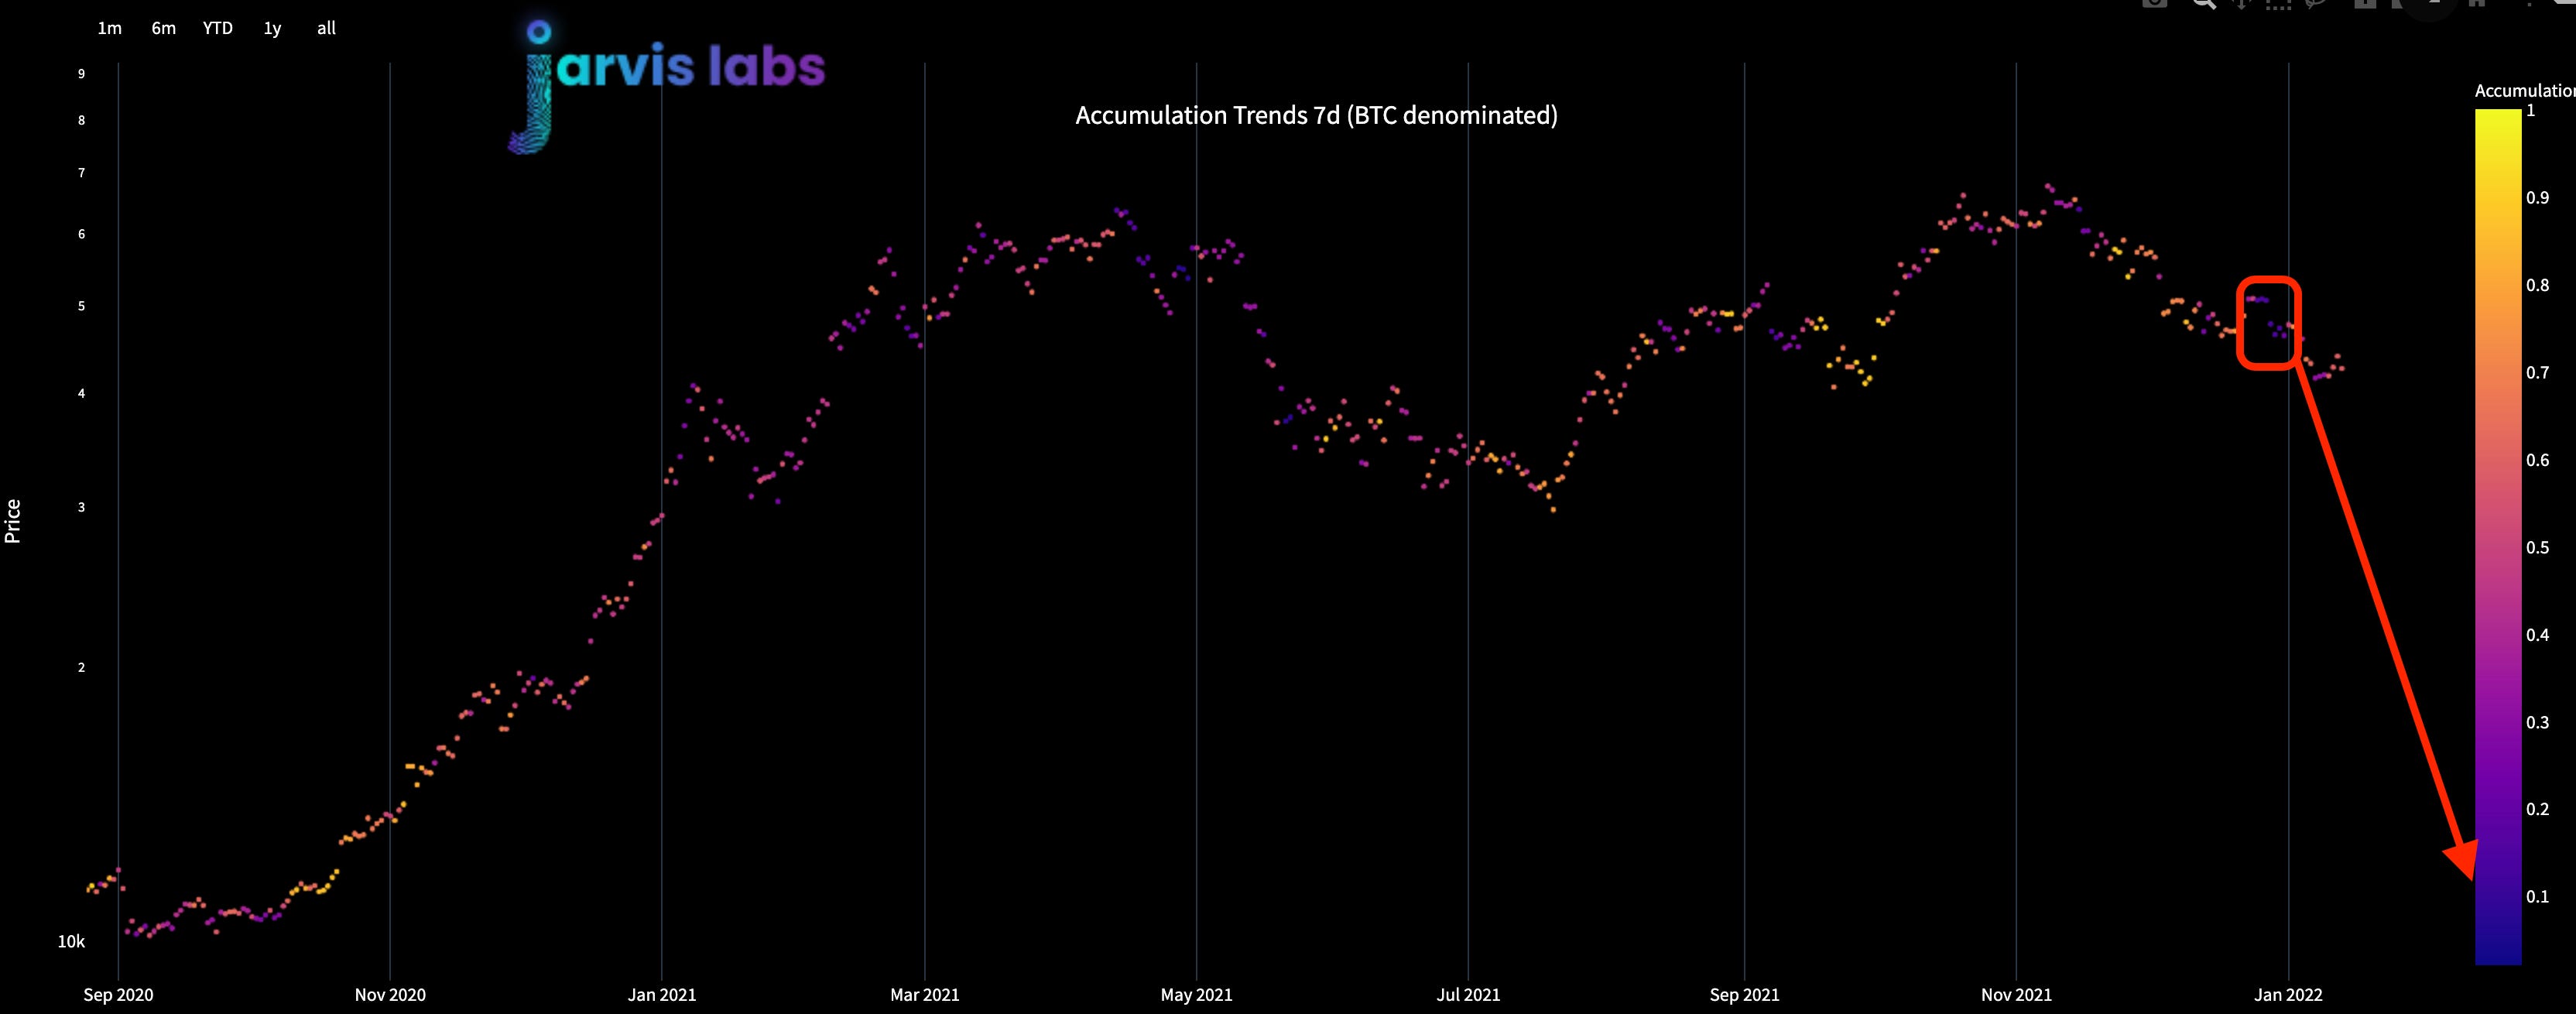
You can even see via the accumulation trend below that the days before the FED released minutes, small wallets were accumulating - not whales.
In fact, the days around the new year the accumulation score was 0.14, a very low reading. And using the premise that whales and large sums of capital move markets, 0.14 is about as bad as it gets.
OK, I think by now I’ve gone a little overkill. I think I might have some passive aggressive feelings towards analysts being lazy, not using data, and saying the selloff was due to the FED / JPow. So now that I got that out of the way… It is time for some really nitty gritty stuff.
If you need to run to the bathroom, refill your coffee, or grab a snack… now is the time.
We are about to teleport back in time to see the market after carnage. The post dot-com selloff. From there we will form a template around two economic indicators as I mentioned earlier: Eurodollars futures contracts and Fed Fund Rates.
Let’s get after it.
The Rhyme
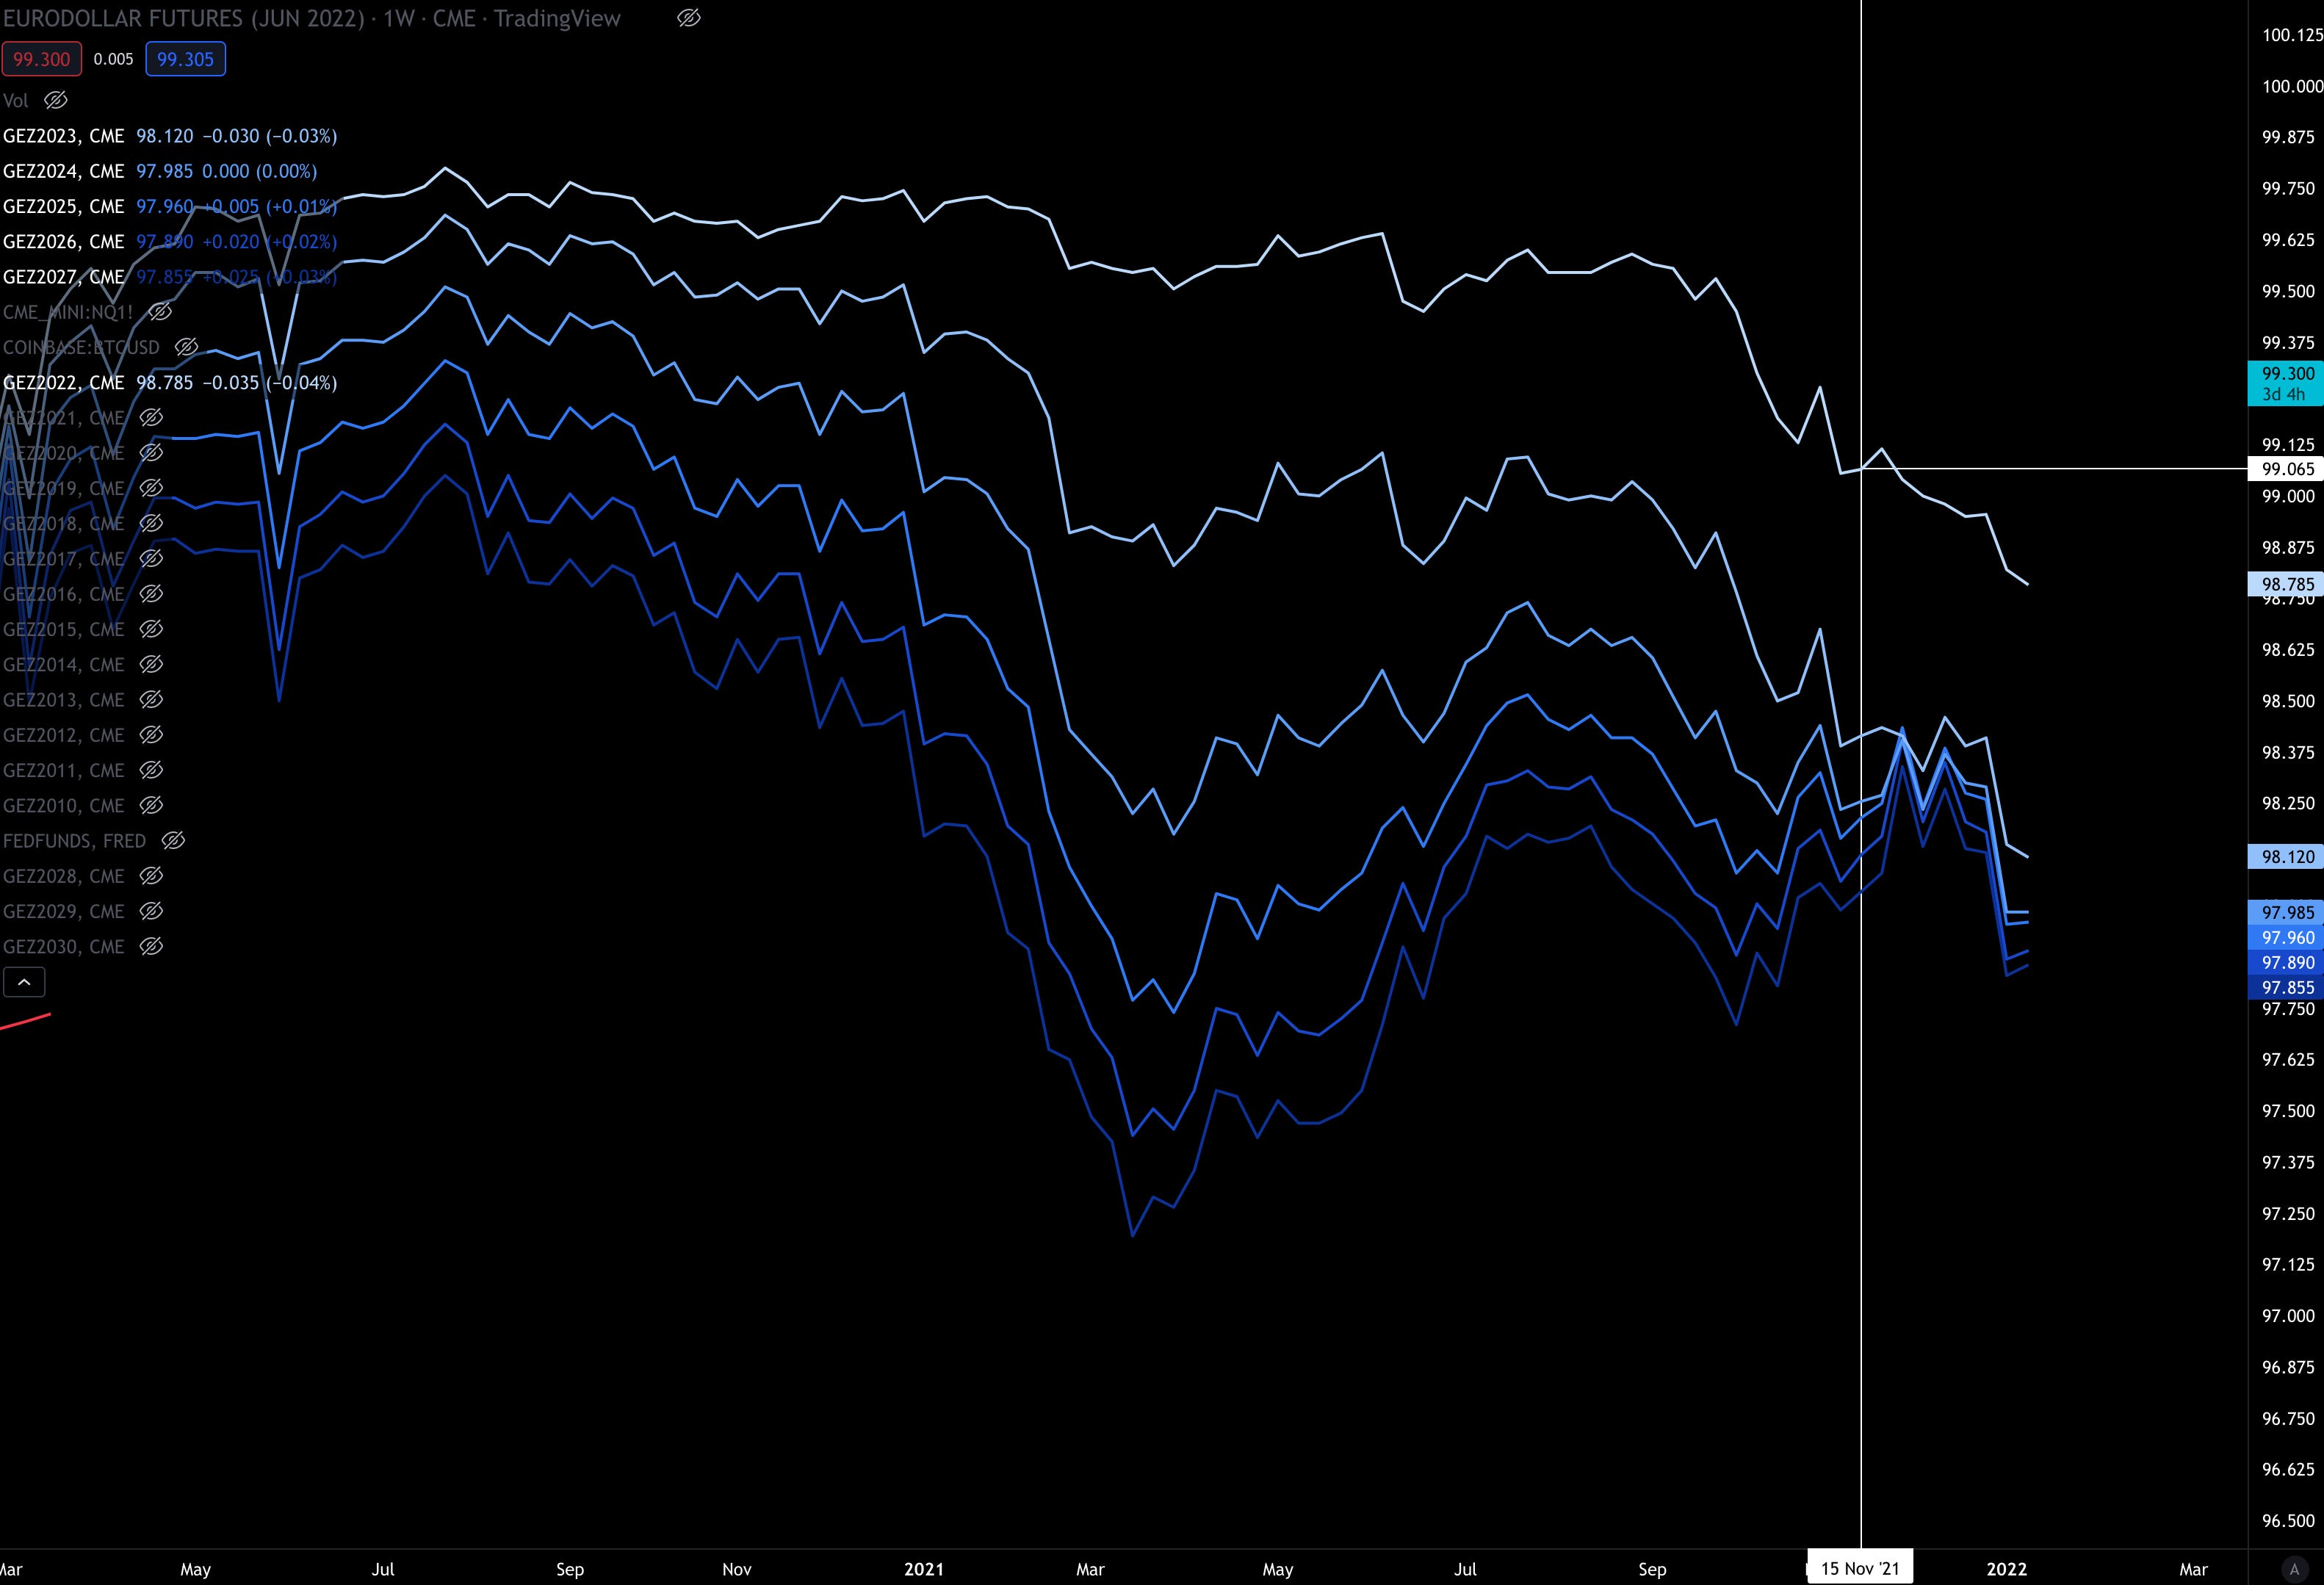
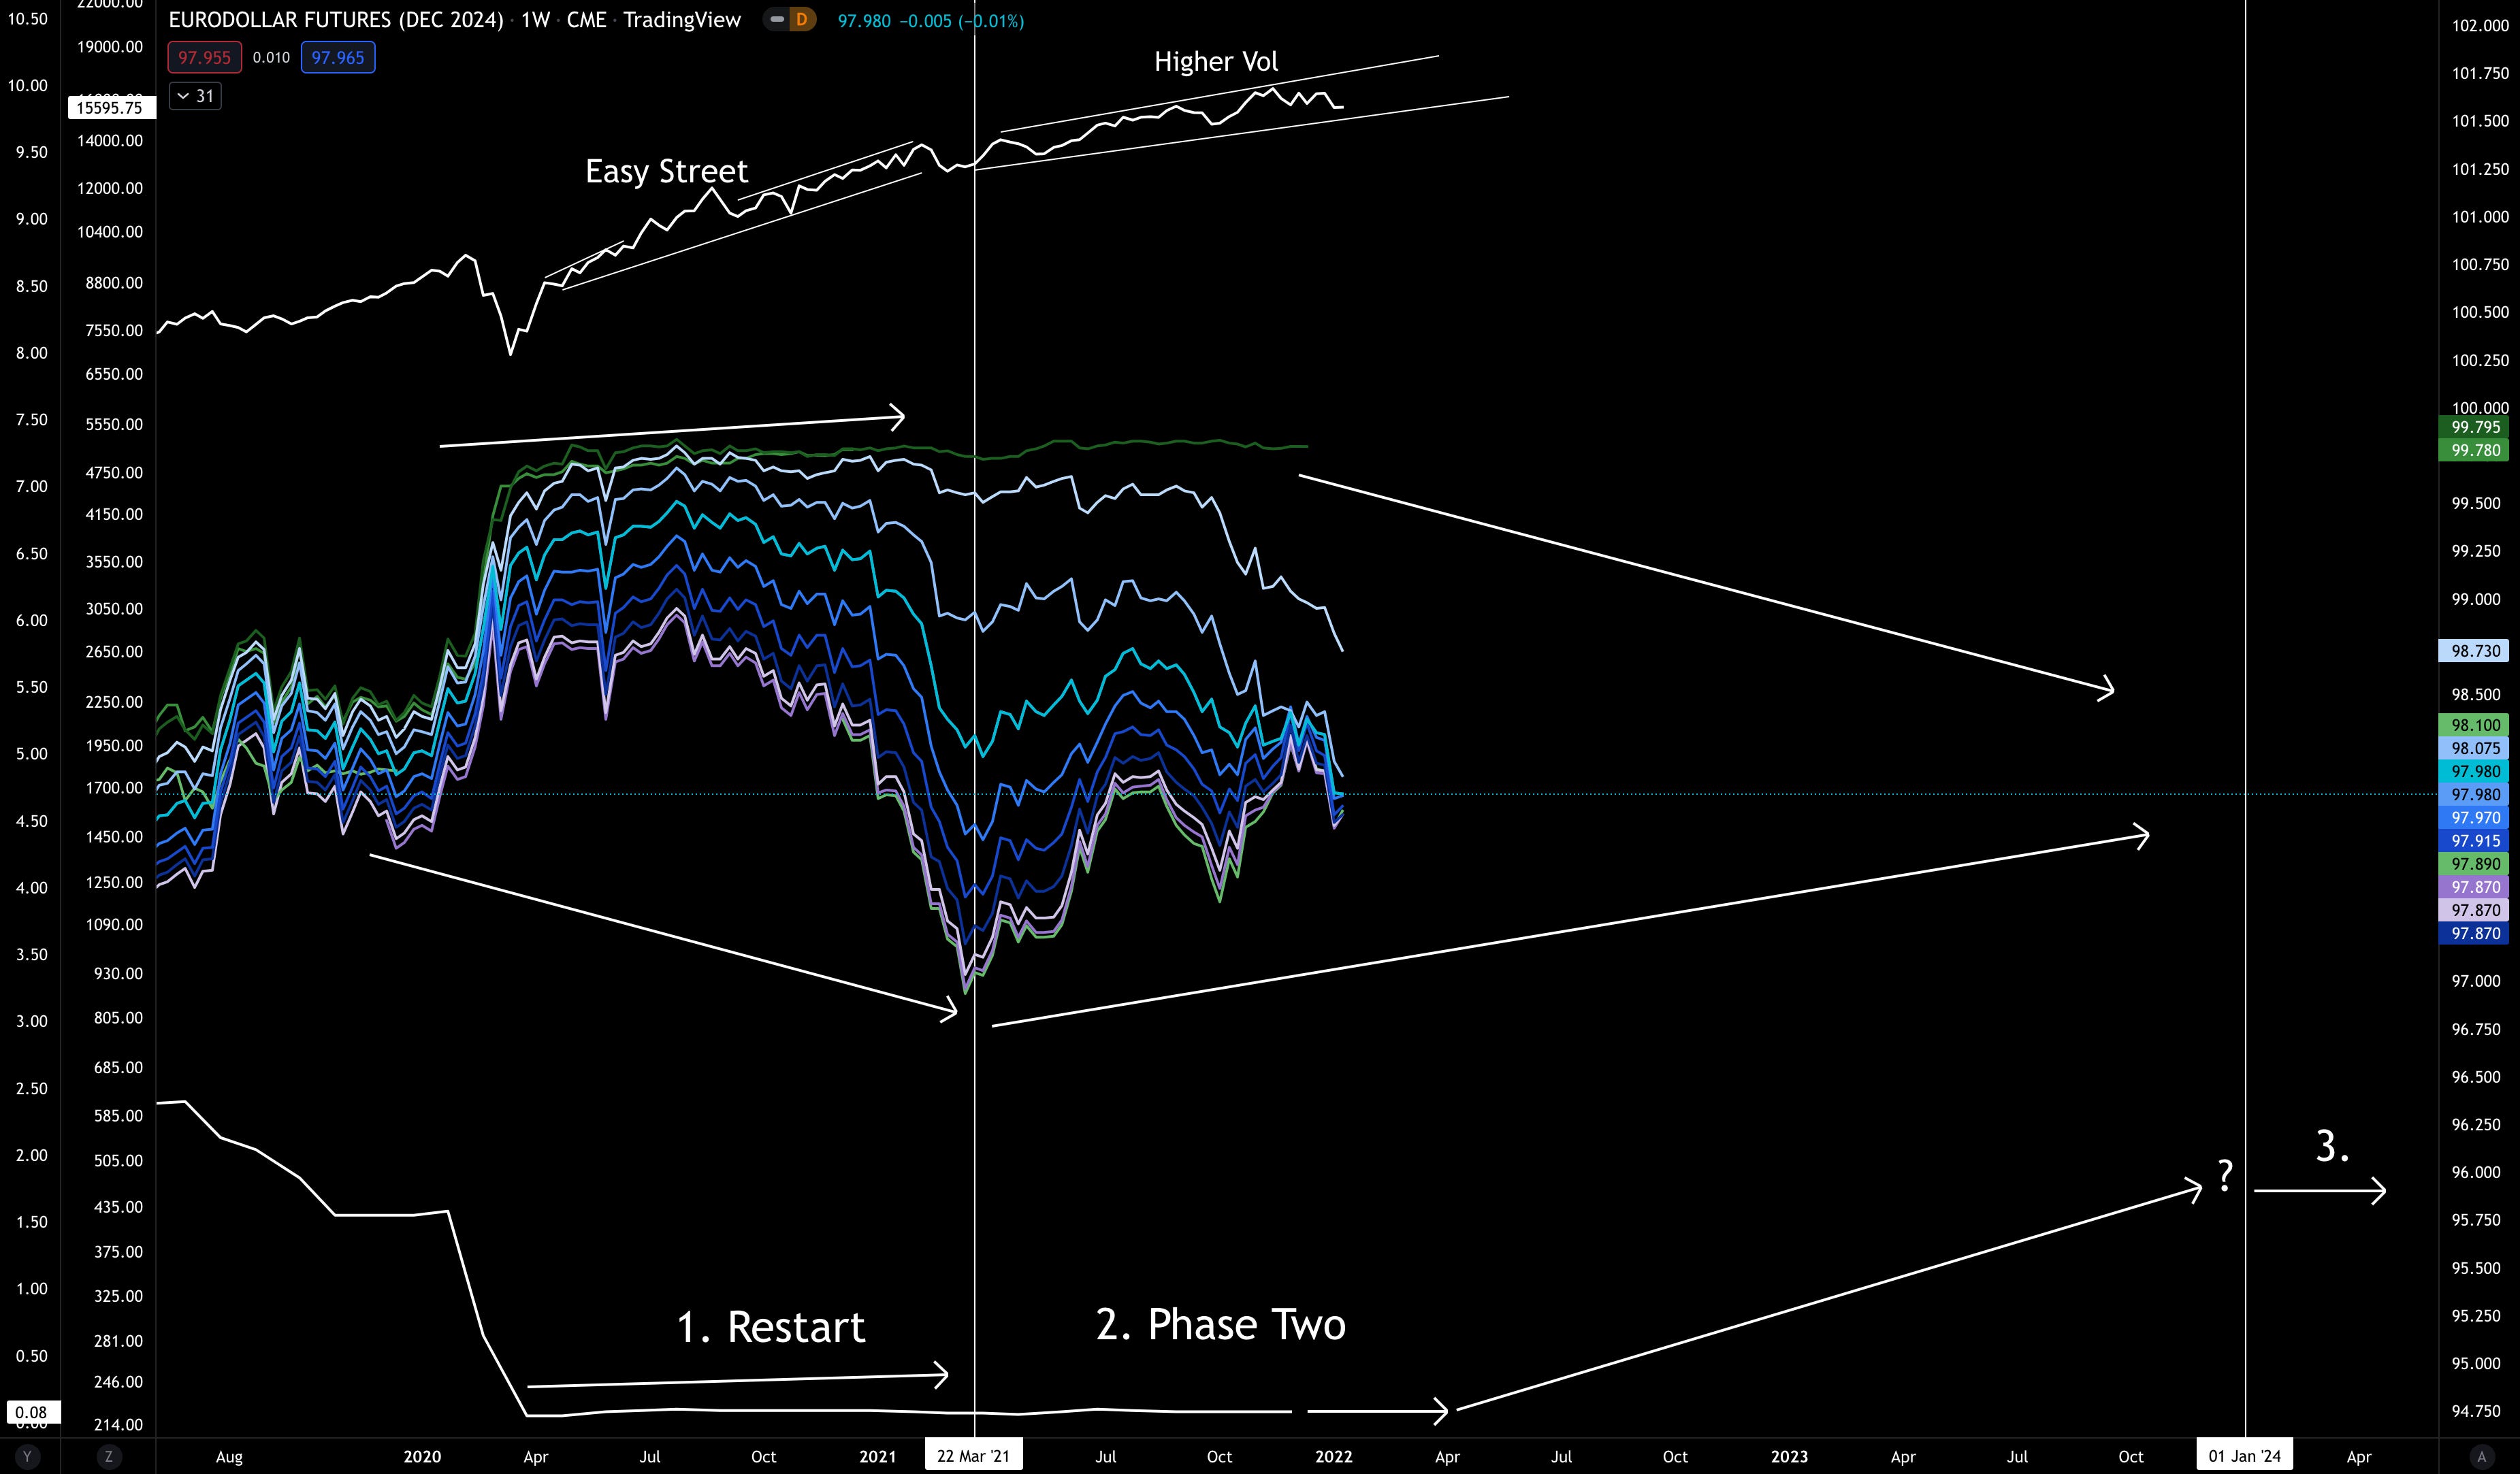
Let’s pull up the current Eurodollar’s chart again.
Notice how the various lines are converging.
What does this mean?
It is an indication the market really has no idea what to expect after the end of 2023. That’s because 2023-2030 expiration dates are all bunched up around the same price, forming a steaming pile of indecision.
Maelstrom again…
And whatever direction the contracts move next - after they they decide they don’t need to follow the heard - will really dictate what happens next.
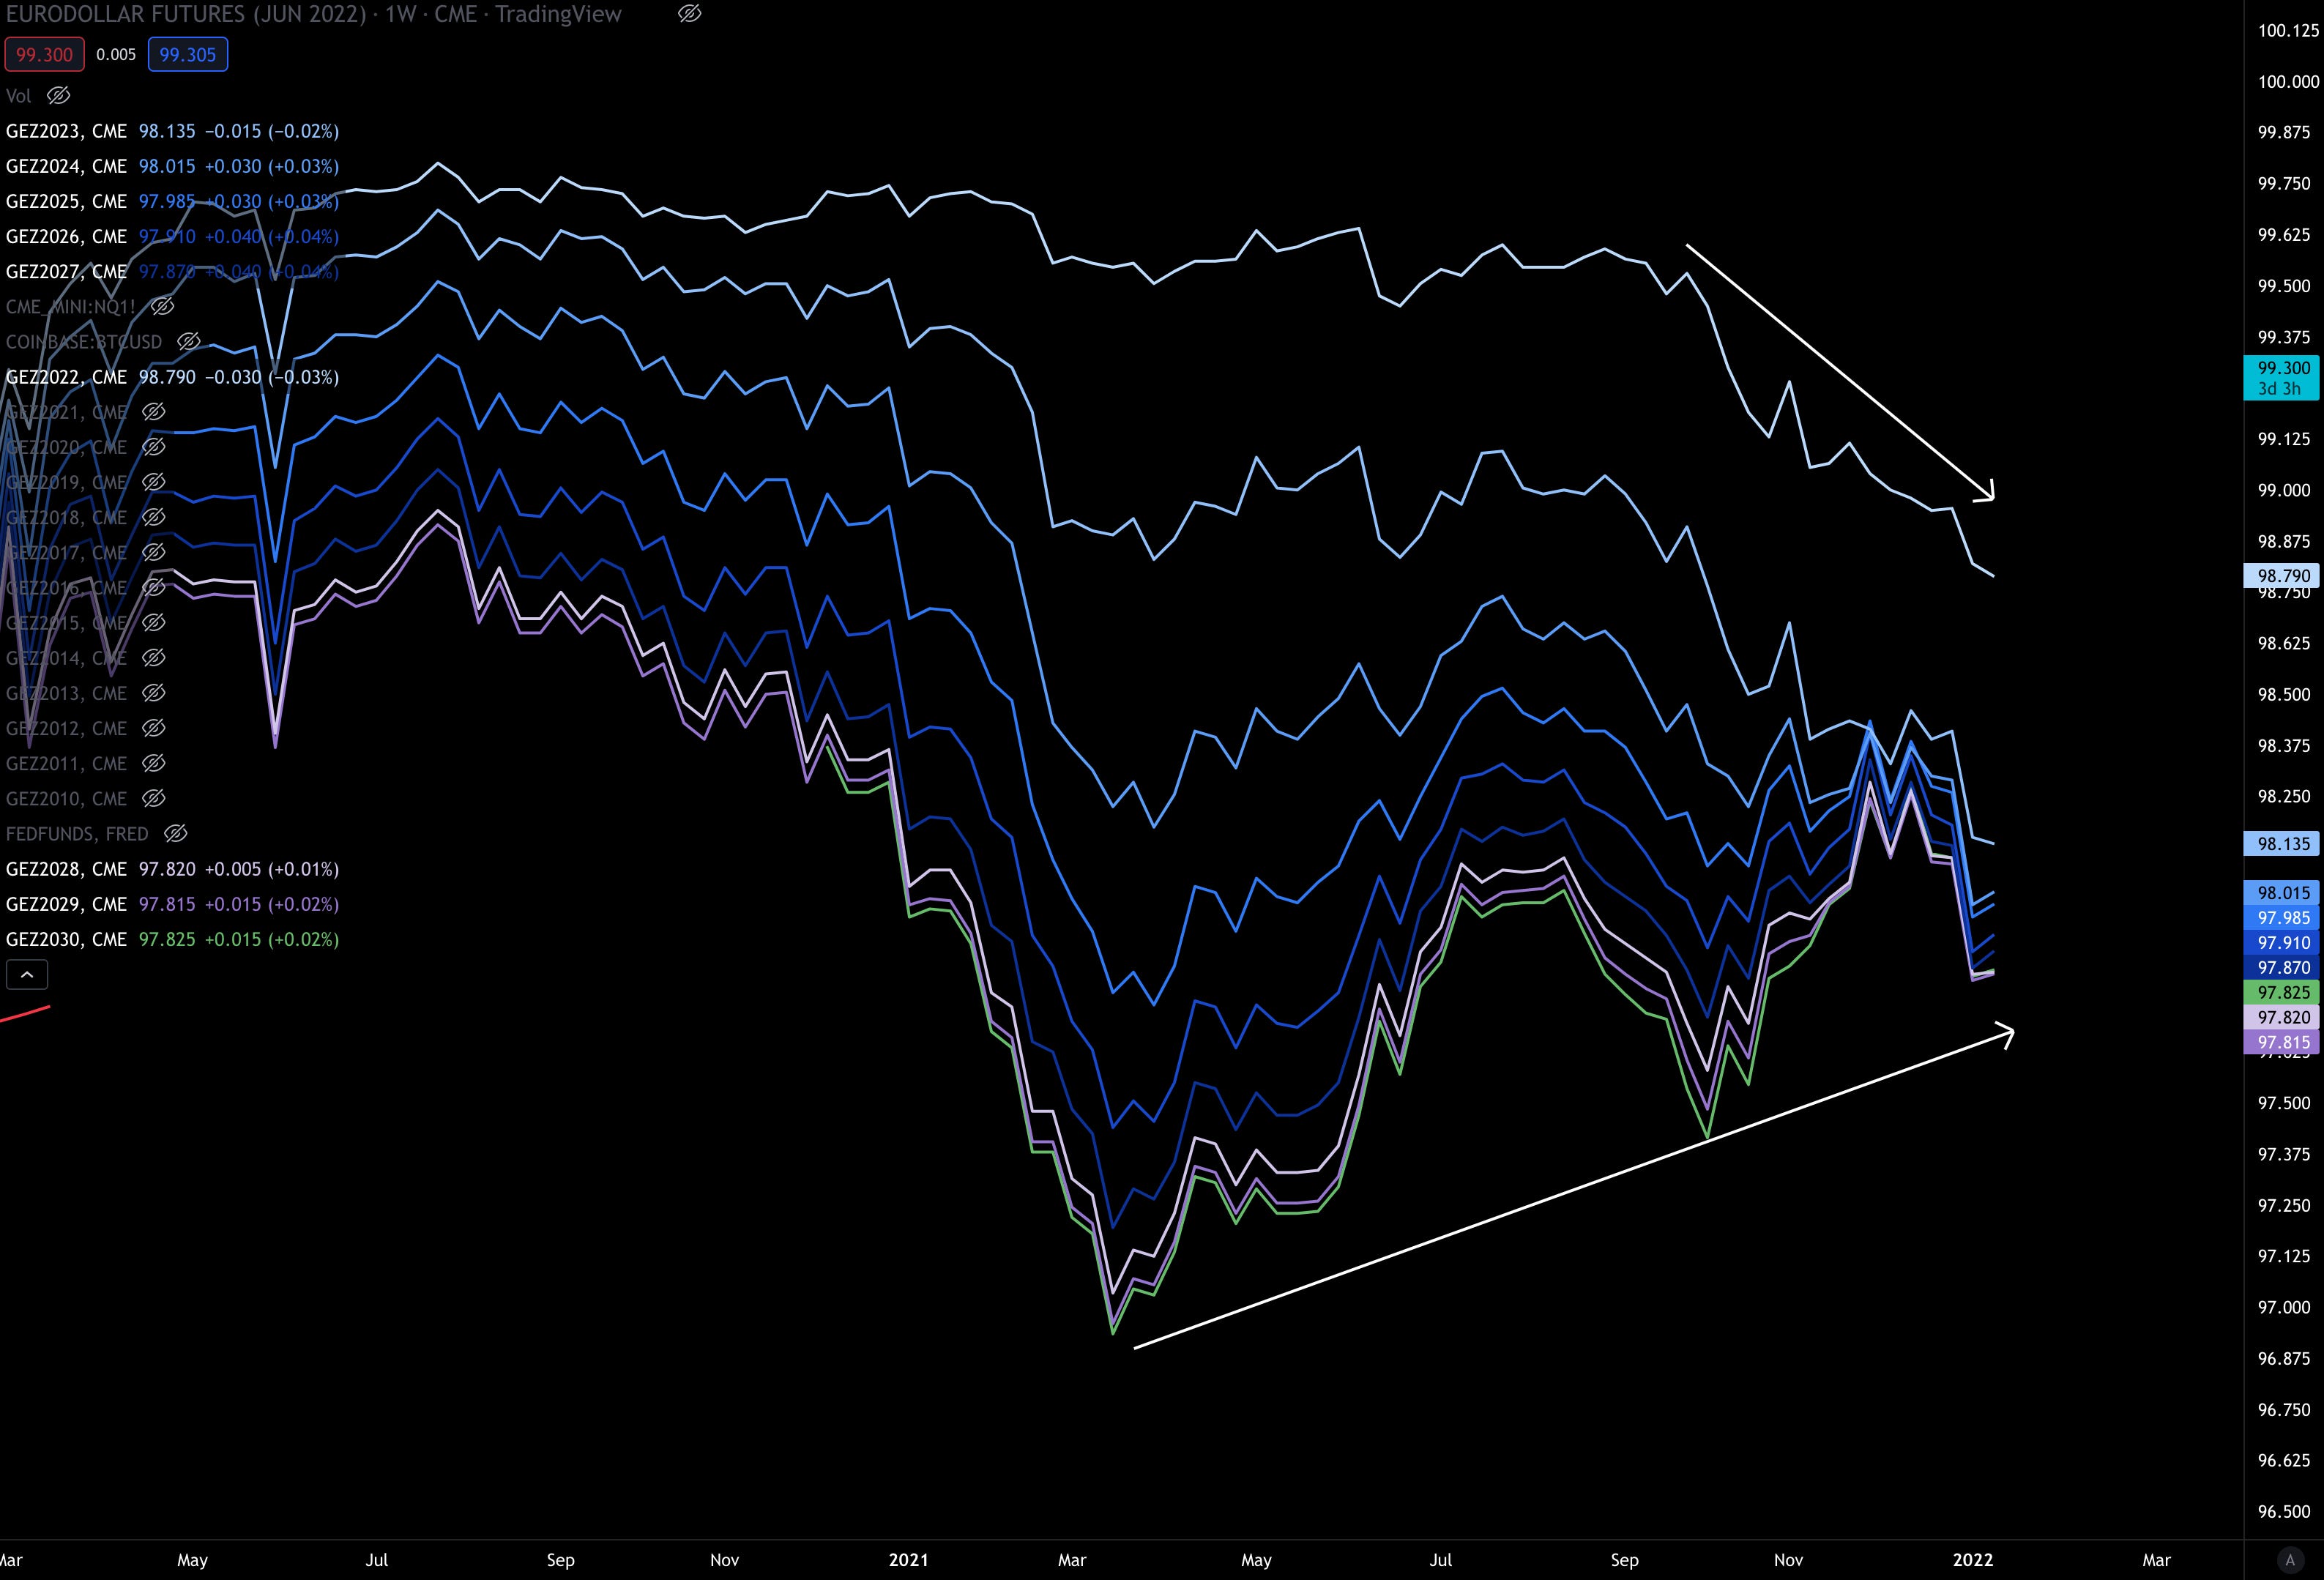
In terms of what happens next, this could mean several things. They could all consolidate, they could contract, they could trend up, or even down.
To figure out how to interpret how direction matters let’s look back at at a time when rates were near zero, Eurodollars were converging (like above), and the FED was increasing rates.
It’s a situation similar to what we are facing today.
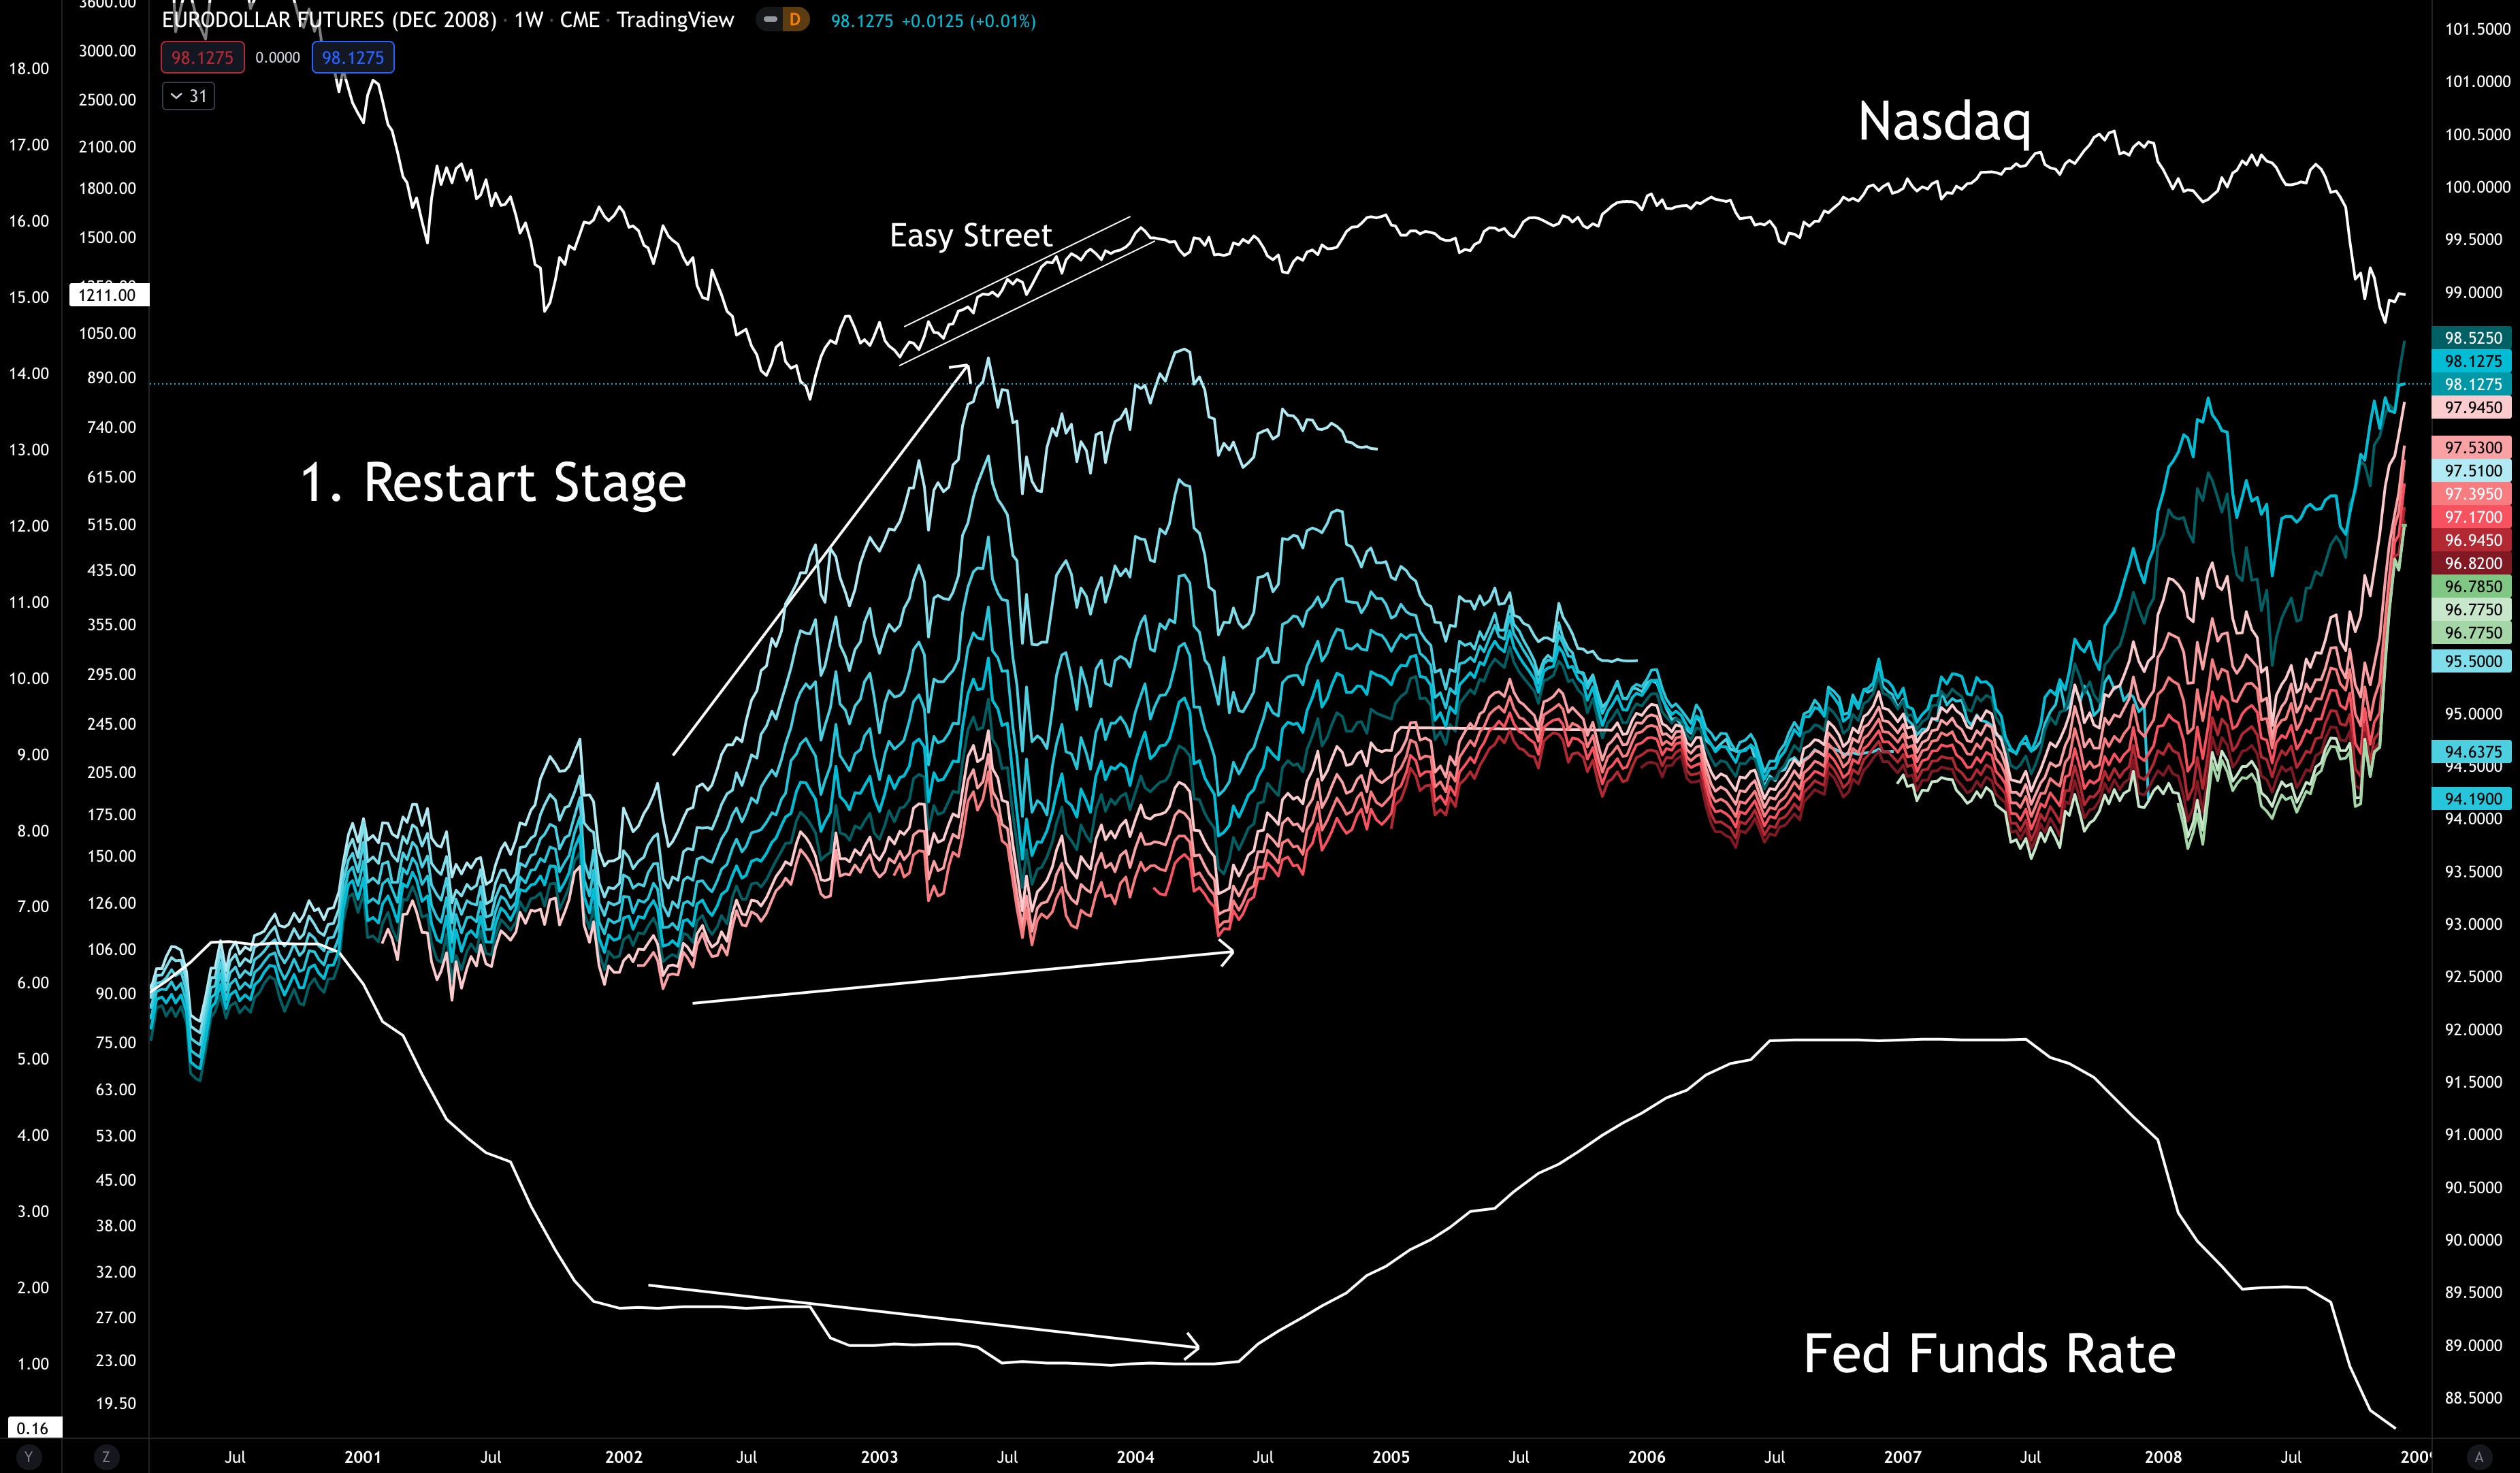
The dot-com meltdown.
Take a second and check out the chart below. I know all of these lines are a lot to take in. I don’t expect you to understand the nuances of them.
What I want you to do is simply focus on when these multi-colored lines expand and contract. That’s it.
Just like markets expand and contract, so do Eurodollar futures curves. Though, in the curve sense it’s more along the lines of flattening/steepening. But again, no need to get caught up in this as I’m sure this is already making your head spin enough.
Contract / Expand. That’s our focus.
In the chart below, notice how the multi-color lines around 2002 get spread out as the white line at the bottom (labeled as Fed Fund rates) approaches zero…
I think of this as the start of a new cycle. A time period after stocks crashed and the FED is now returning back to zero rates. A reset.
This transition back to the floor where interest rates are near zero and market prices are low is the FED restarting the economy after a blow.
So again, rates hit the floor… while the multi-color lines that represent Eurodollars futures contracts expand.
Rates at zero, Eurodollars expanding…
Meanwhile, the white line at the top - the Nasdaq index - has great returns with low volatility. It’s a time I like to call ‘Easy Street’. It’s a steady return period causing low levels of emotional distress period.
Now, in order to summarize it for a template, let’s call this time period stage one or the restart:
- Futures expanding and rates at zero → Steadily bullish off lows / Easy Street
Here’s the chart showing it.
Now, on a quick side note…
I’m using the Nasdaq in this chart because nearly two decades ago we could say this was Web1 and Web2 stocks. And if crypto’s narrative today is Web3, then this should act as a decent proxy for this analysis without getting too distracted with alternative crypto narratives like store-of-value, hedge to U.S. monetary policy, or fixed supply.
Ok, with that out of the way let’s look at when rates started to rise in 2004. A time period I’m calling the second phase.
At this time Eurodollars began to consolidate, while the Nasdaq got choppy.
Let’s classify this second phase:
- Futures contracting and rates rising off zero → choppy / semi-bullish market
Here is how it looks in a chart:
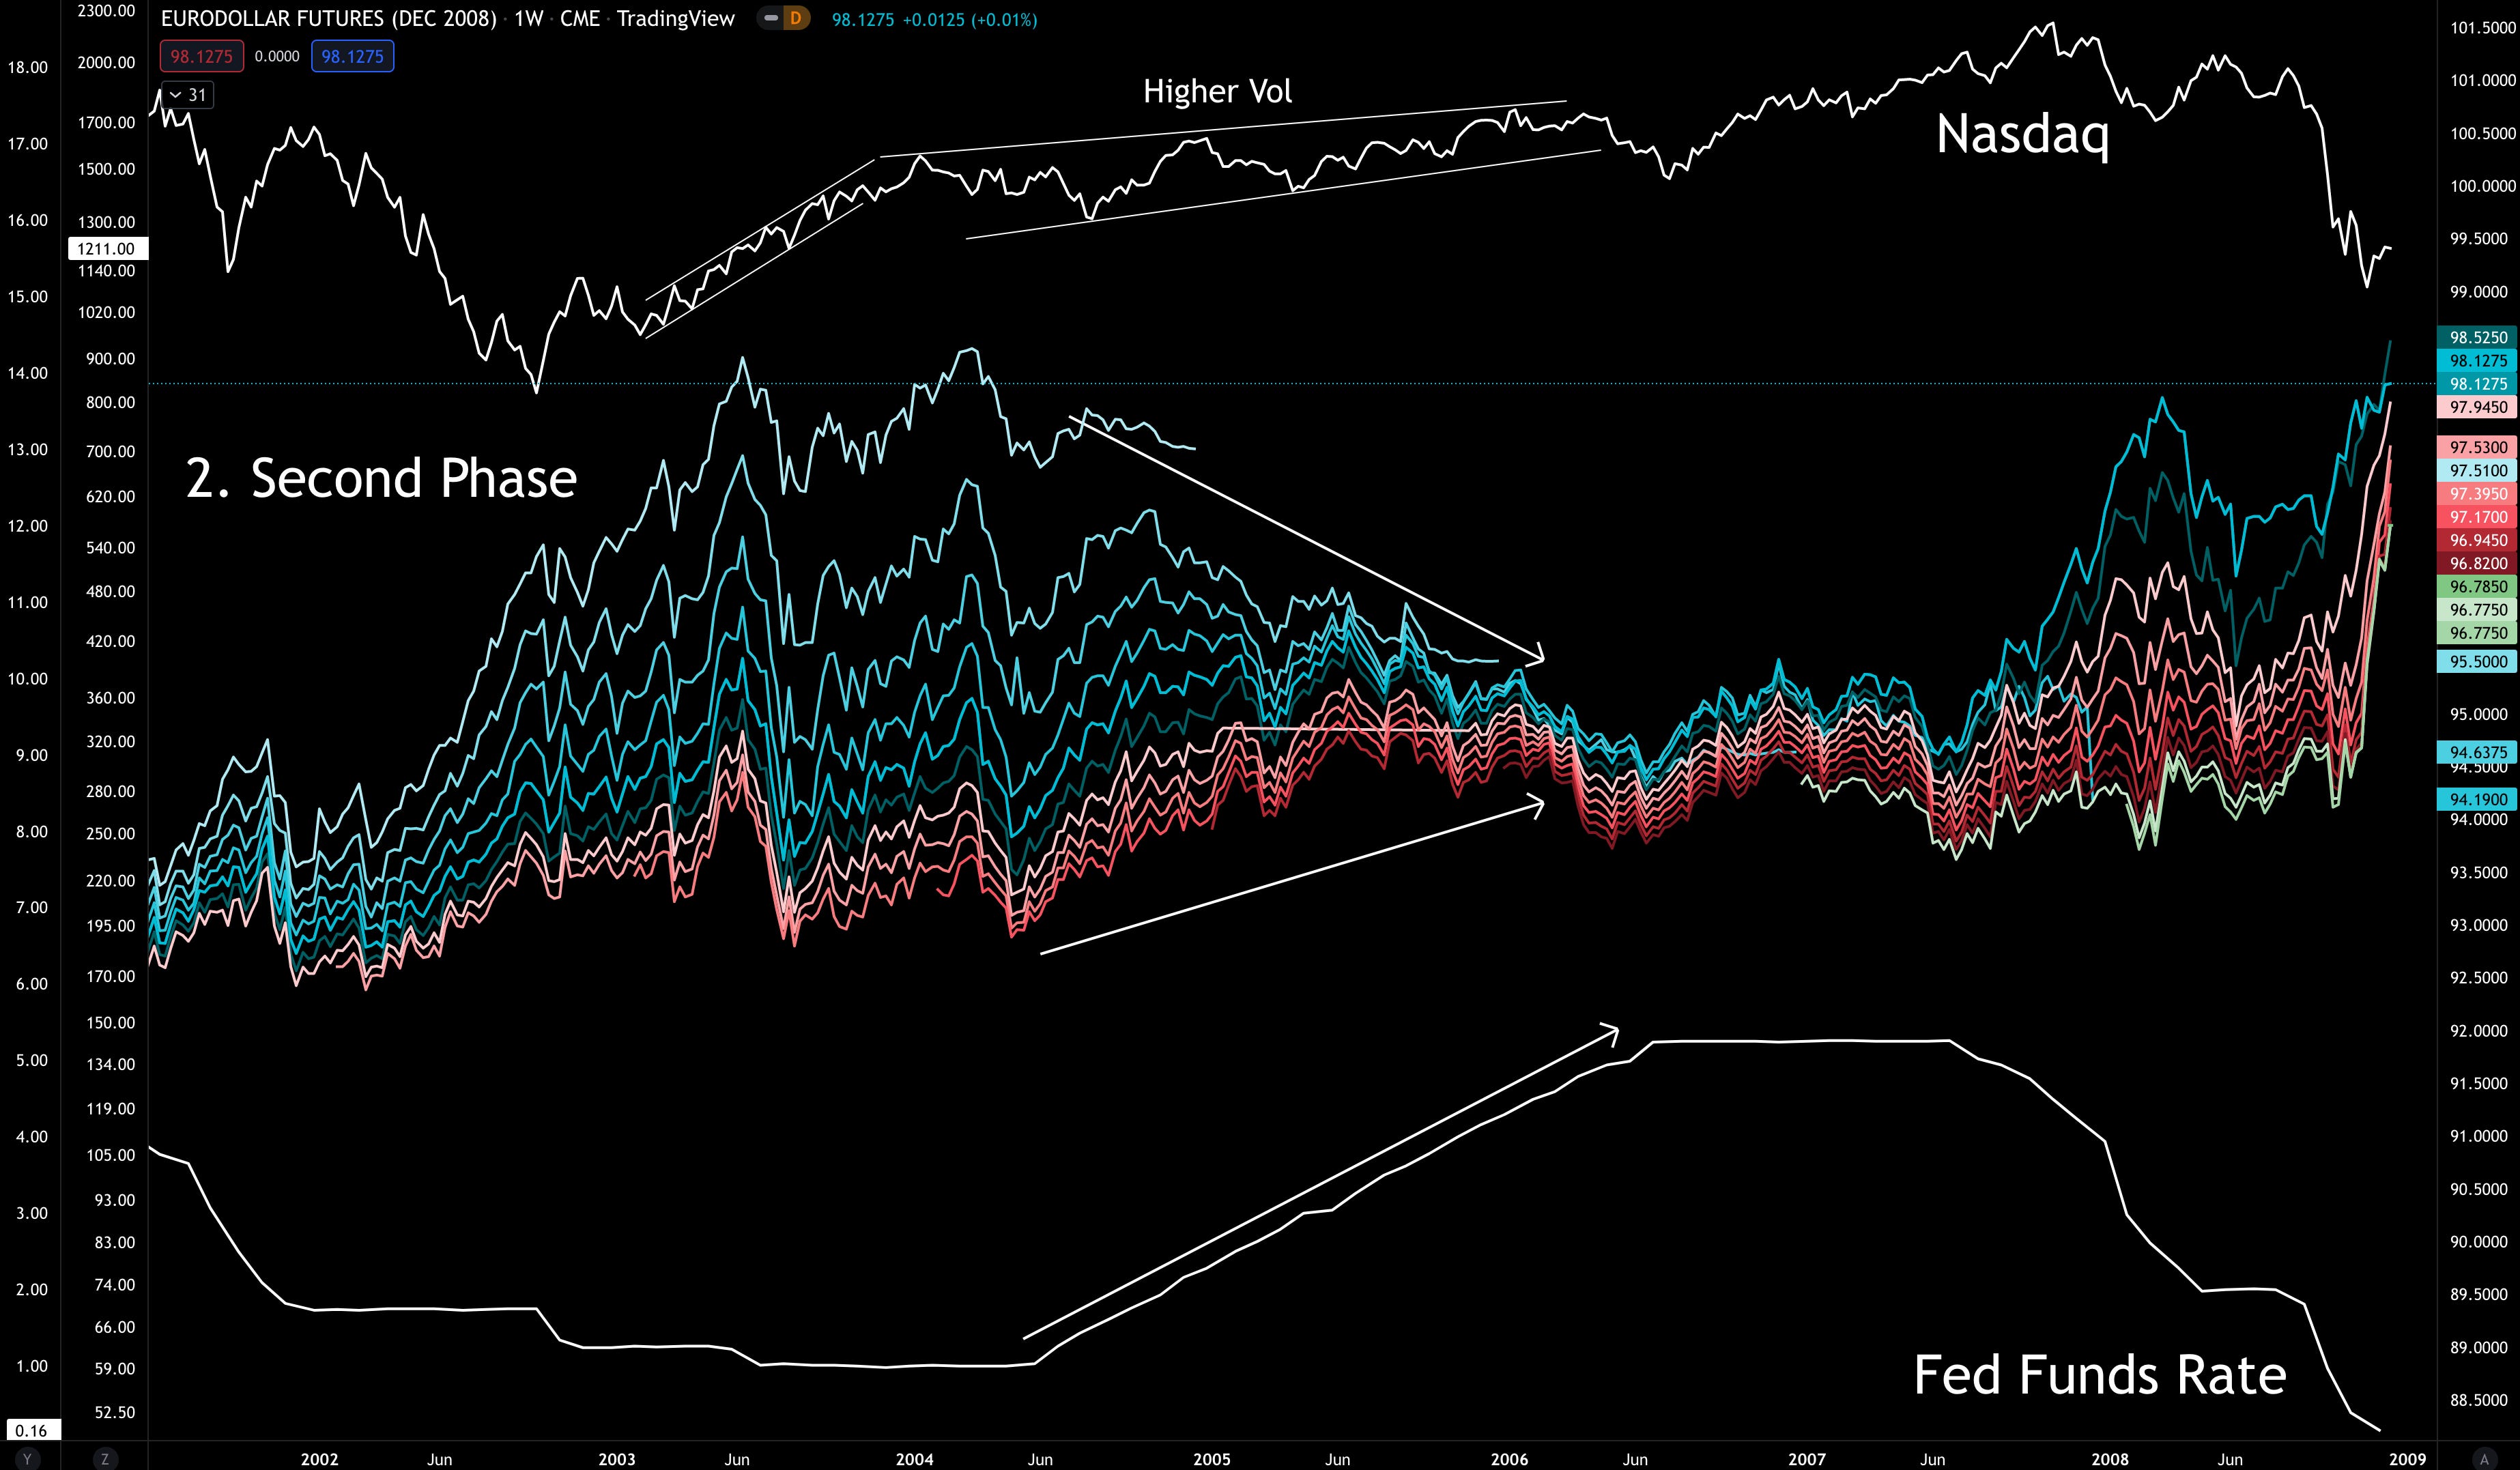
The FED continued to hike until the middle of 2006 when the index sold off.
This selloff - which we can attribute partially to the recession warning of 10Yr treasury yields dropping below 2Yr yields - was the market beginning to buckle under these higher rates.
In response, monetary policy soften with the FED ending their rate hike regime. This is seen in the white Federal Funds Rate line at the bottom of the chart going sideways for 2007, and starting to drop again.
Meanwhile, Eurodollars expand again. Contract, expand, contract, expand - see a pattern?
Anyways, here’s the chart of what I’m calling stage three - the meltup.
- Futures expanding with plateauing rates → very bullish / meltup incoming
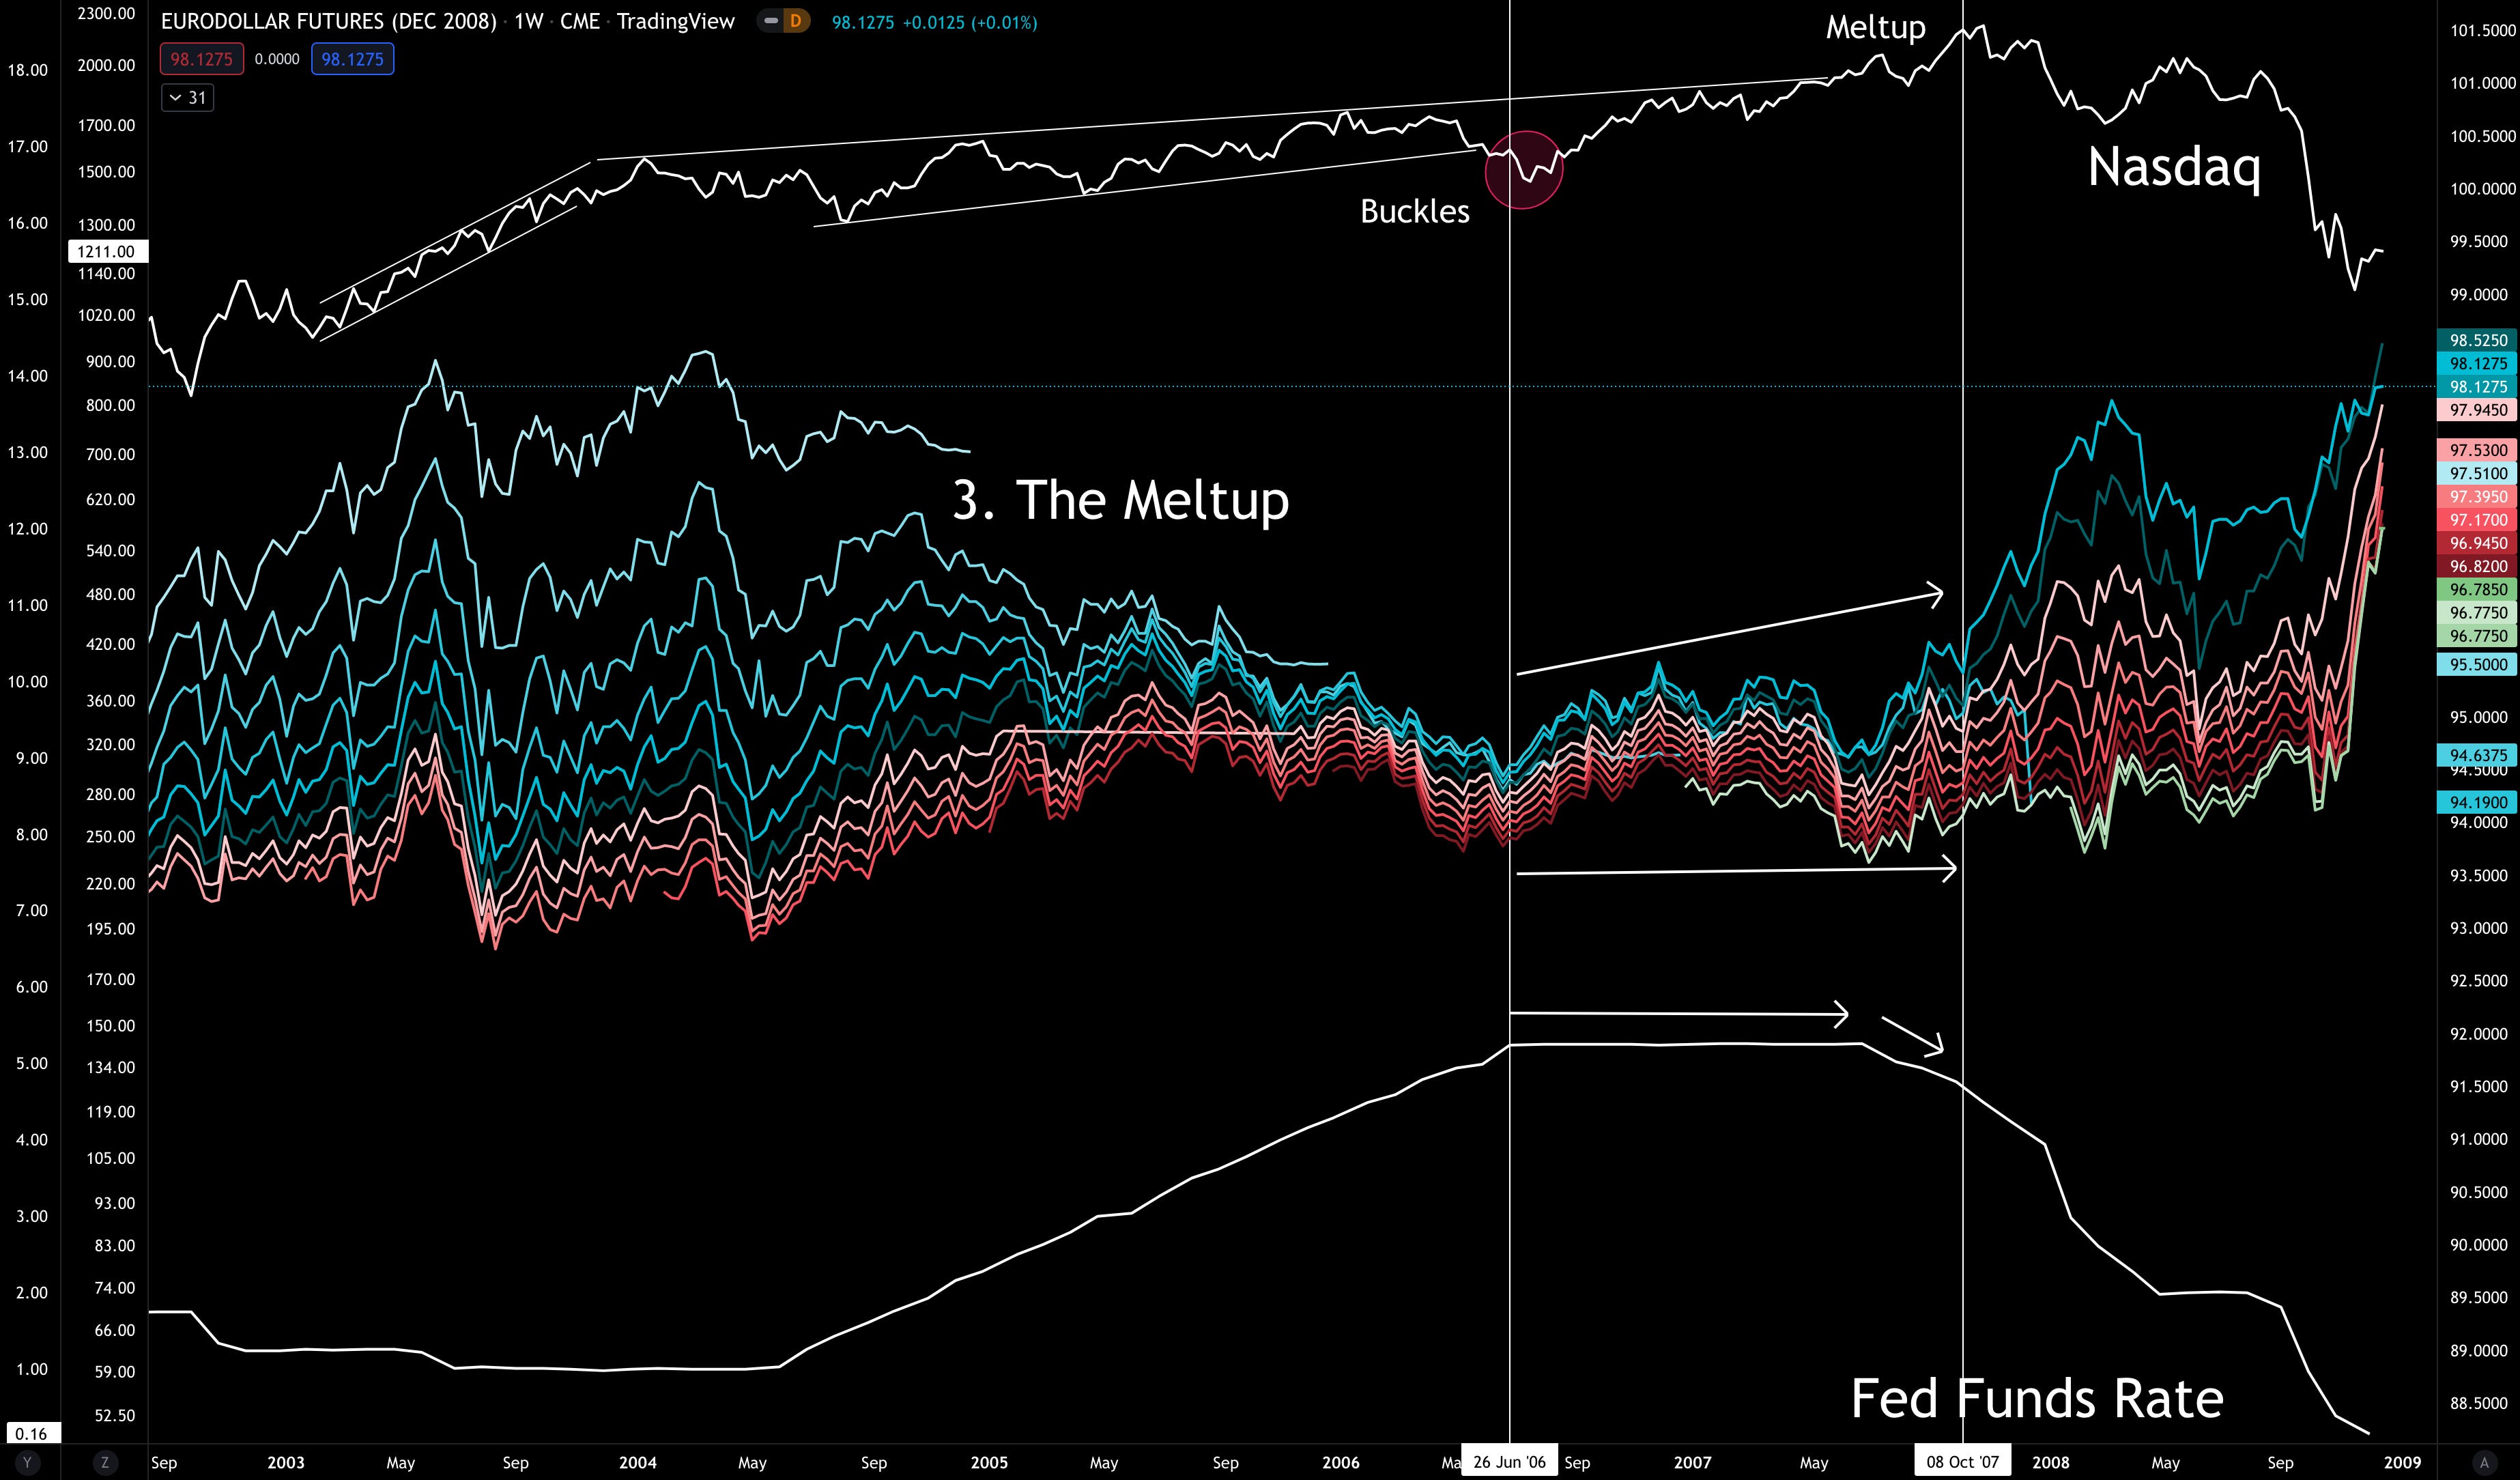
The expanding Eurodollars were the sign that the financial system was starting to expect lower rates.
And soon after the FED began to deliver. Which at first, a rate hike is met with investors backing up the truck. It’s two servings at the buffet table euphoria.
But the damage was already done to the financial system. The FED saw the warning signs and continued to drop rates even while the market ripped.
The part was over.
- Futures expanding with rates dropping → it’s over
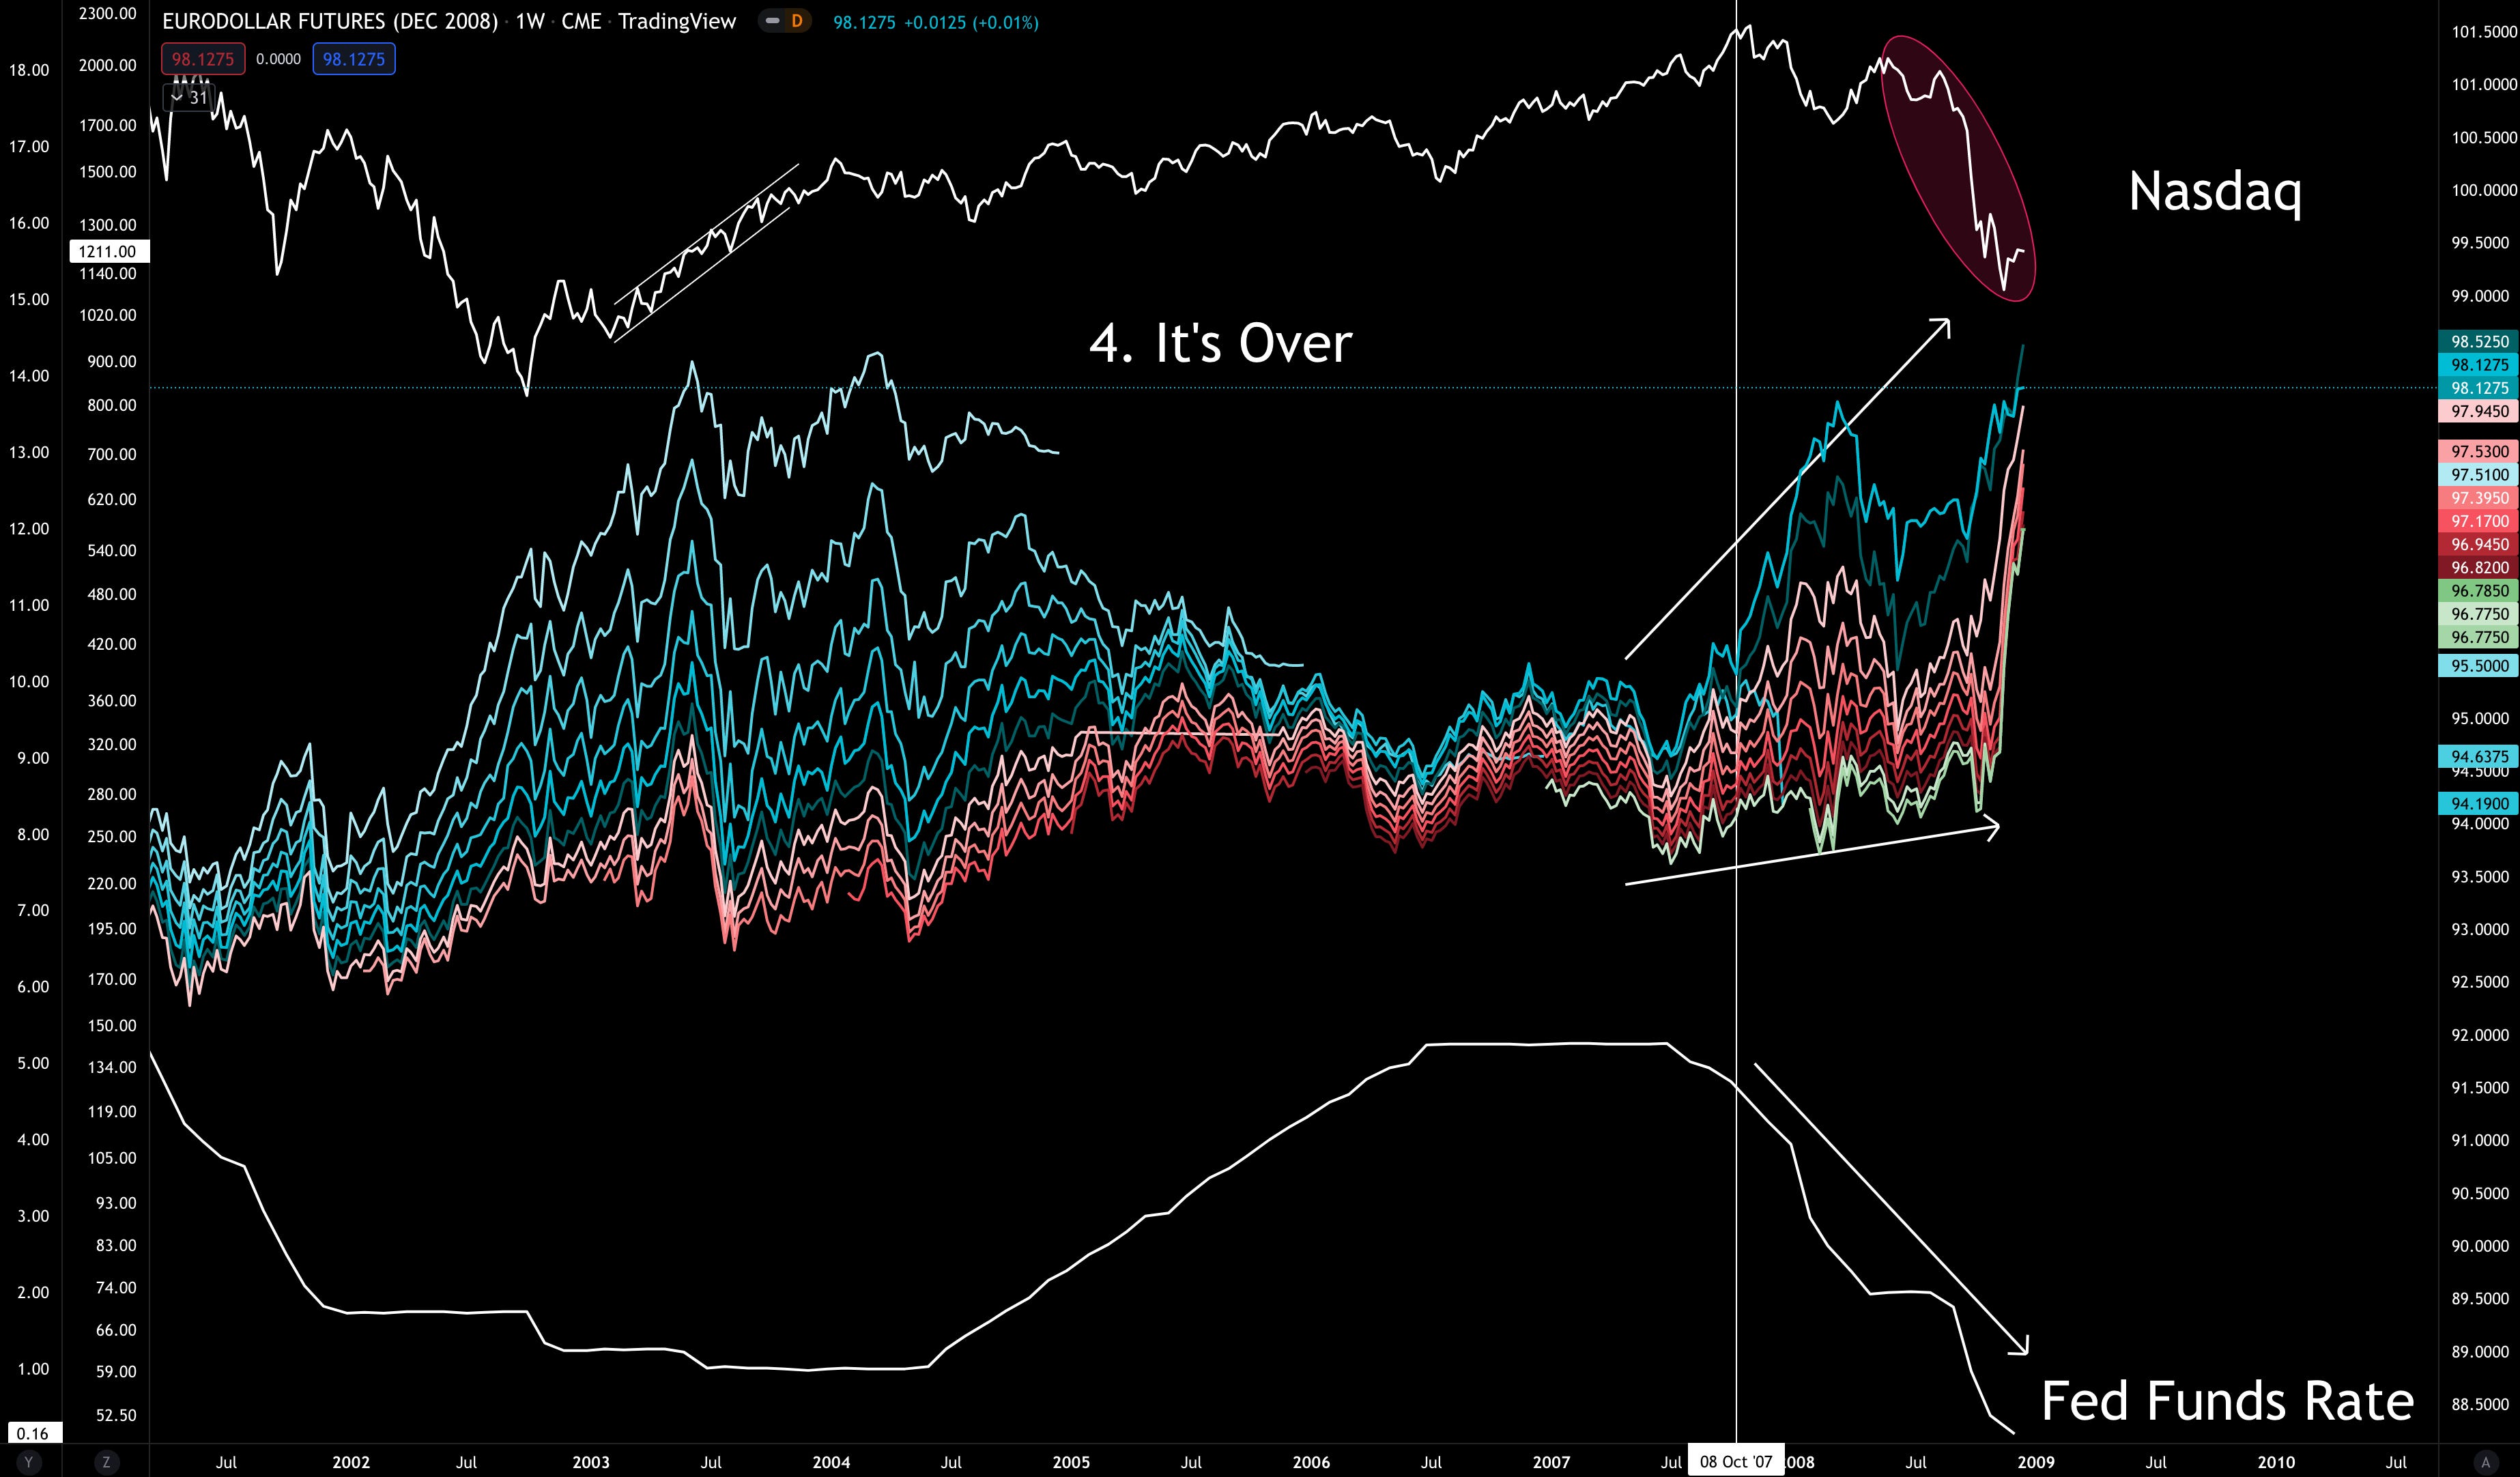
OK, so we went through an entire cycle with rate back at the floor and Eurodollars expanding again - “1”.
So to quickly reiterate what just happened, here’s our initial template.
The takeaways.
- Futures expanding and rates at zero → Steadily bullish off lows / Easy Street
- Futures contracting and rates rising off zero → choppy / semi-bullish market
- Futures expanding with plateauing rates → very bullish / meltup incoming
- Futures expanding with rates dropping → it’s over
Let’s see if this checks out during the post-2008 market debacle.
The Second Verse
Let’s move a bit faster through this next time period. A time when the financial system was maxed out on debt and leverage.
Below the timeline starts where we left off in the last chart - 2008 crash.
What we see in 2009 once rates hit zero was the last part of the small cycle…
- Futures expanding and rates at zero → Steadily bullish off lows / Easy Street
Then phase two began in mid-2010 as a very long Eurodollars consolidation period got underway.
- Futures contracting and rates rising off zero → choppy / semi-bullish market
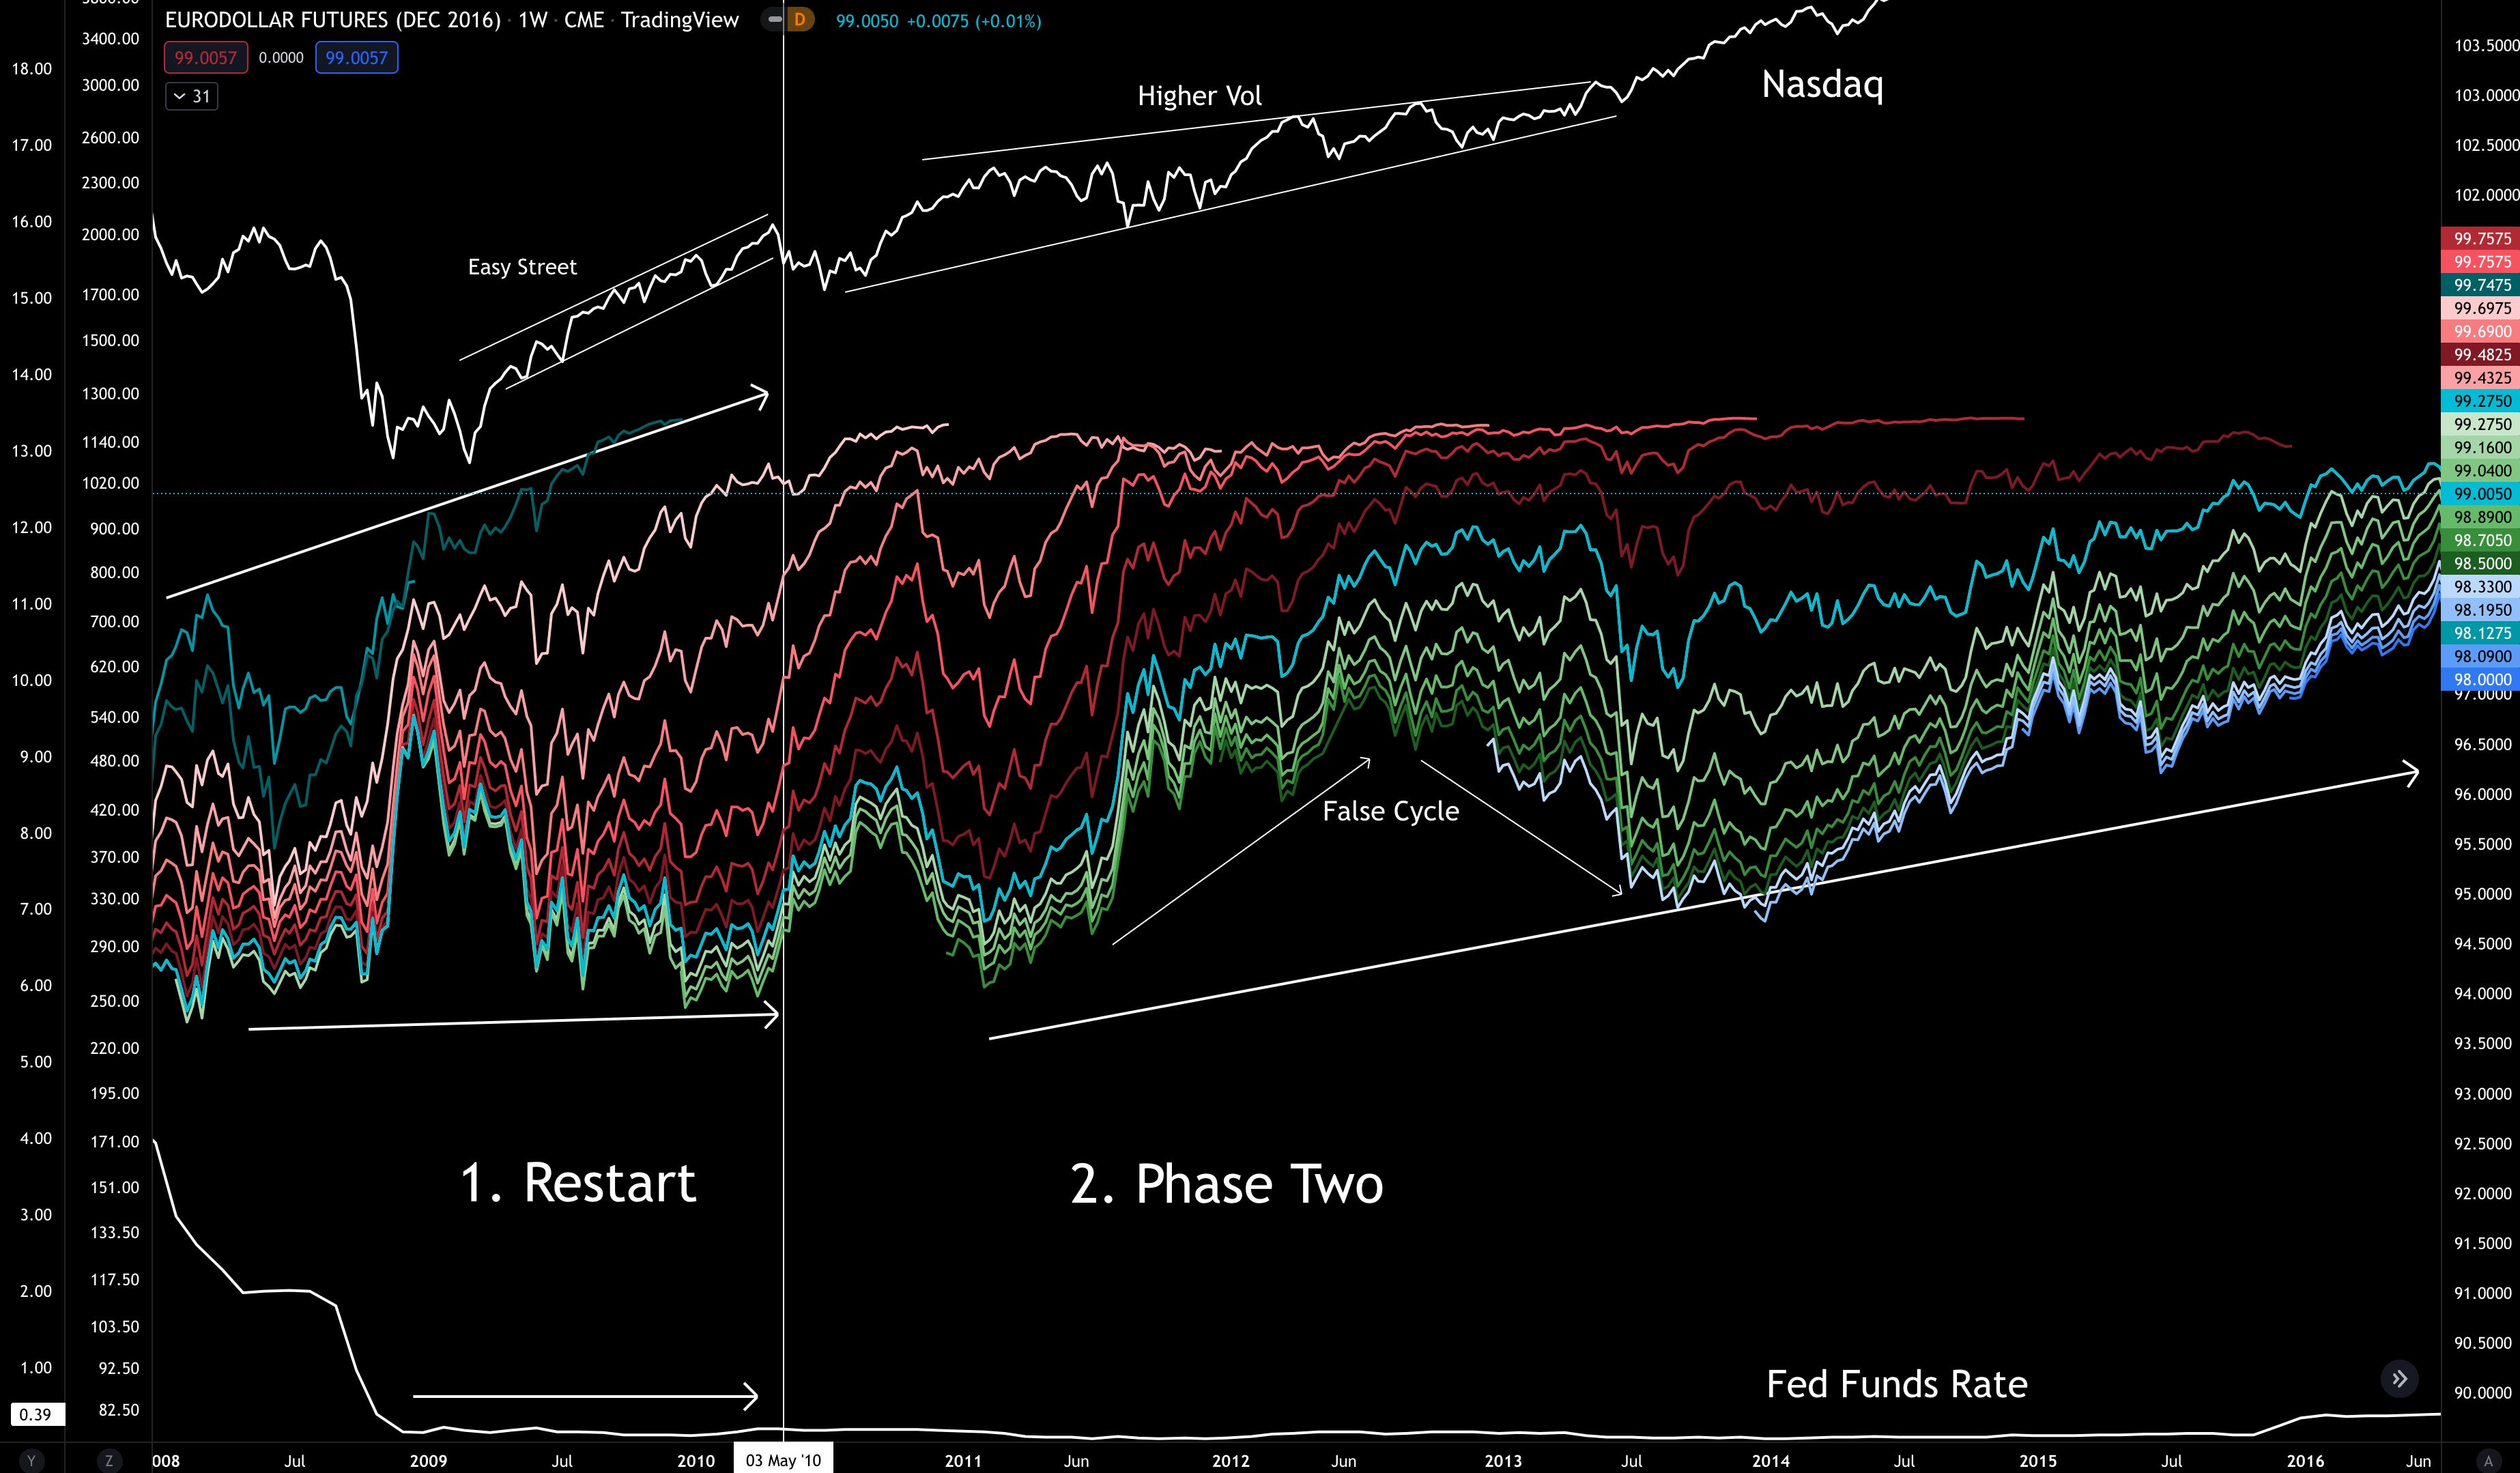
What’s important to note here is that during “Phase Two” there was a contraction happening on part of the Eurodollars… But not any movement at the top. This was a false signal.
If you look back at Phase Two in the previous cycle you’ll notice the lines at the top trended down as the bottom lines did. This is why Phase Two here is actually seven years in length.
Rates went sideways at the end of 2018 when trouble showed up… Eurodollars began to expand a bit - setting us up for “The Meltup” stage or “3”. And then finally the FED capitulation and dropped rates to zero with Eurodollars expanding again with the nearest expirations topping out near zero rates.
To sum up what we see in the chart below…
- Futures contracting and rates rising off zero → choppy / semi-bullish market
- Futures expanding with plateauing rates → very bullish / meltup incoming
- Futures expanding with rates dropping → it’s over
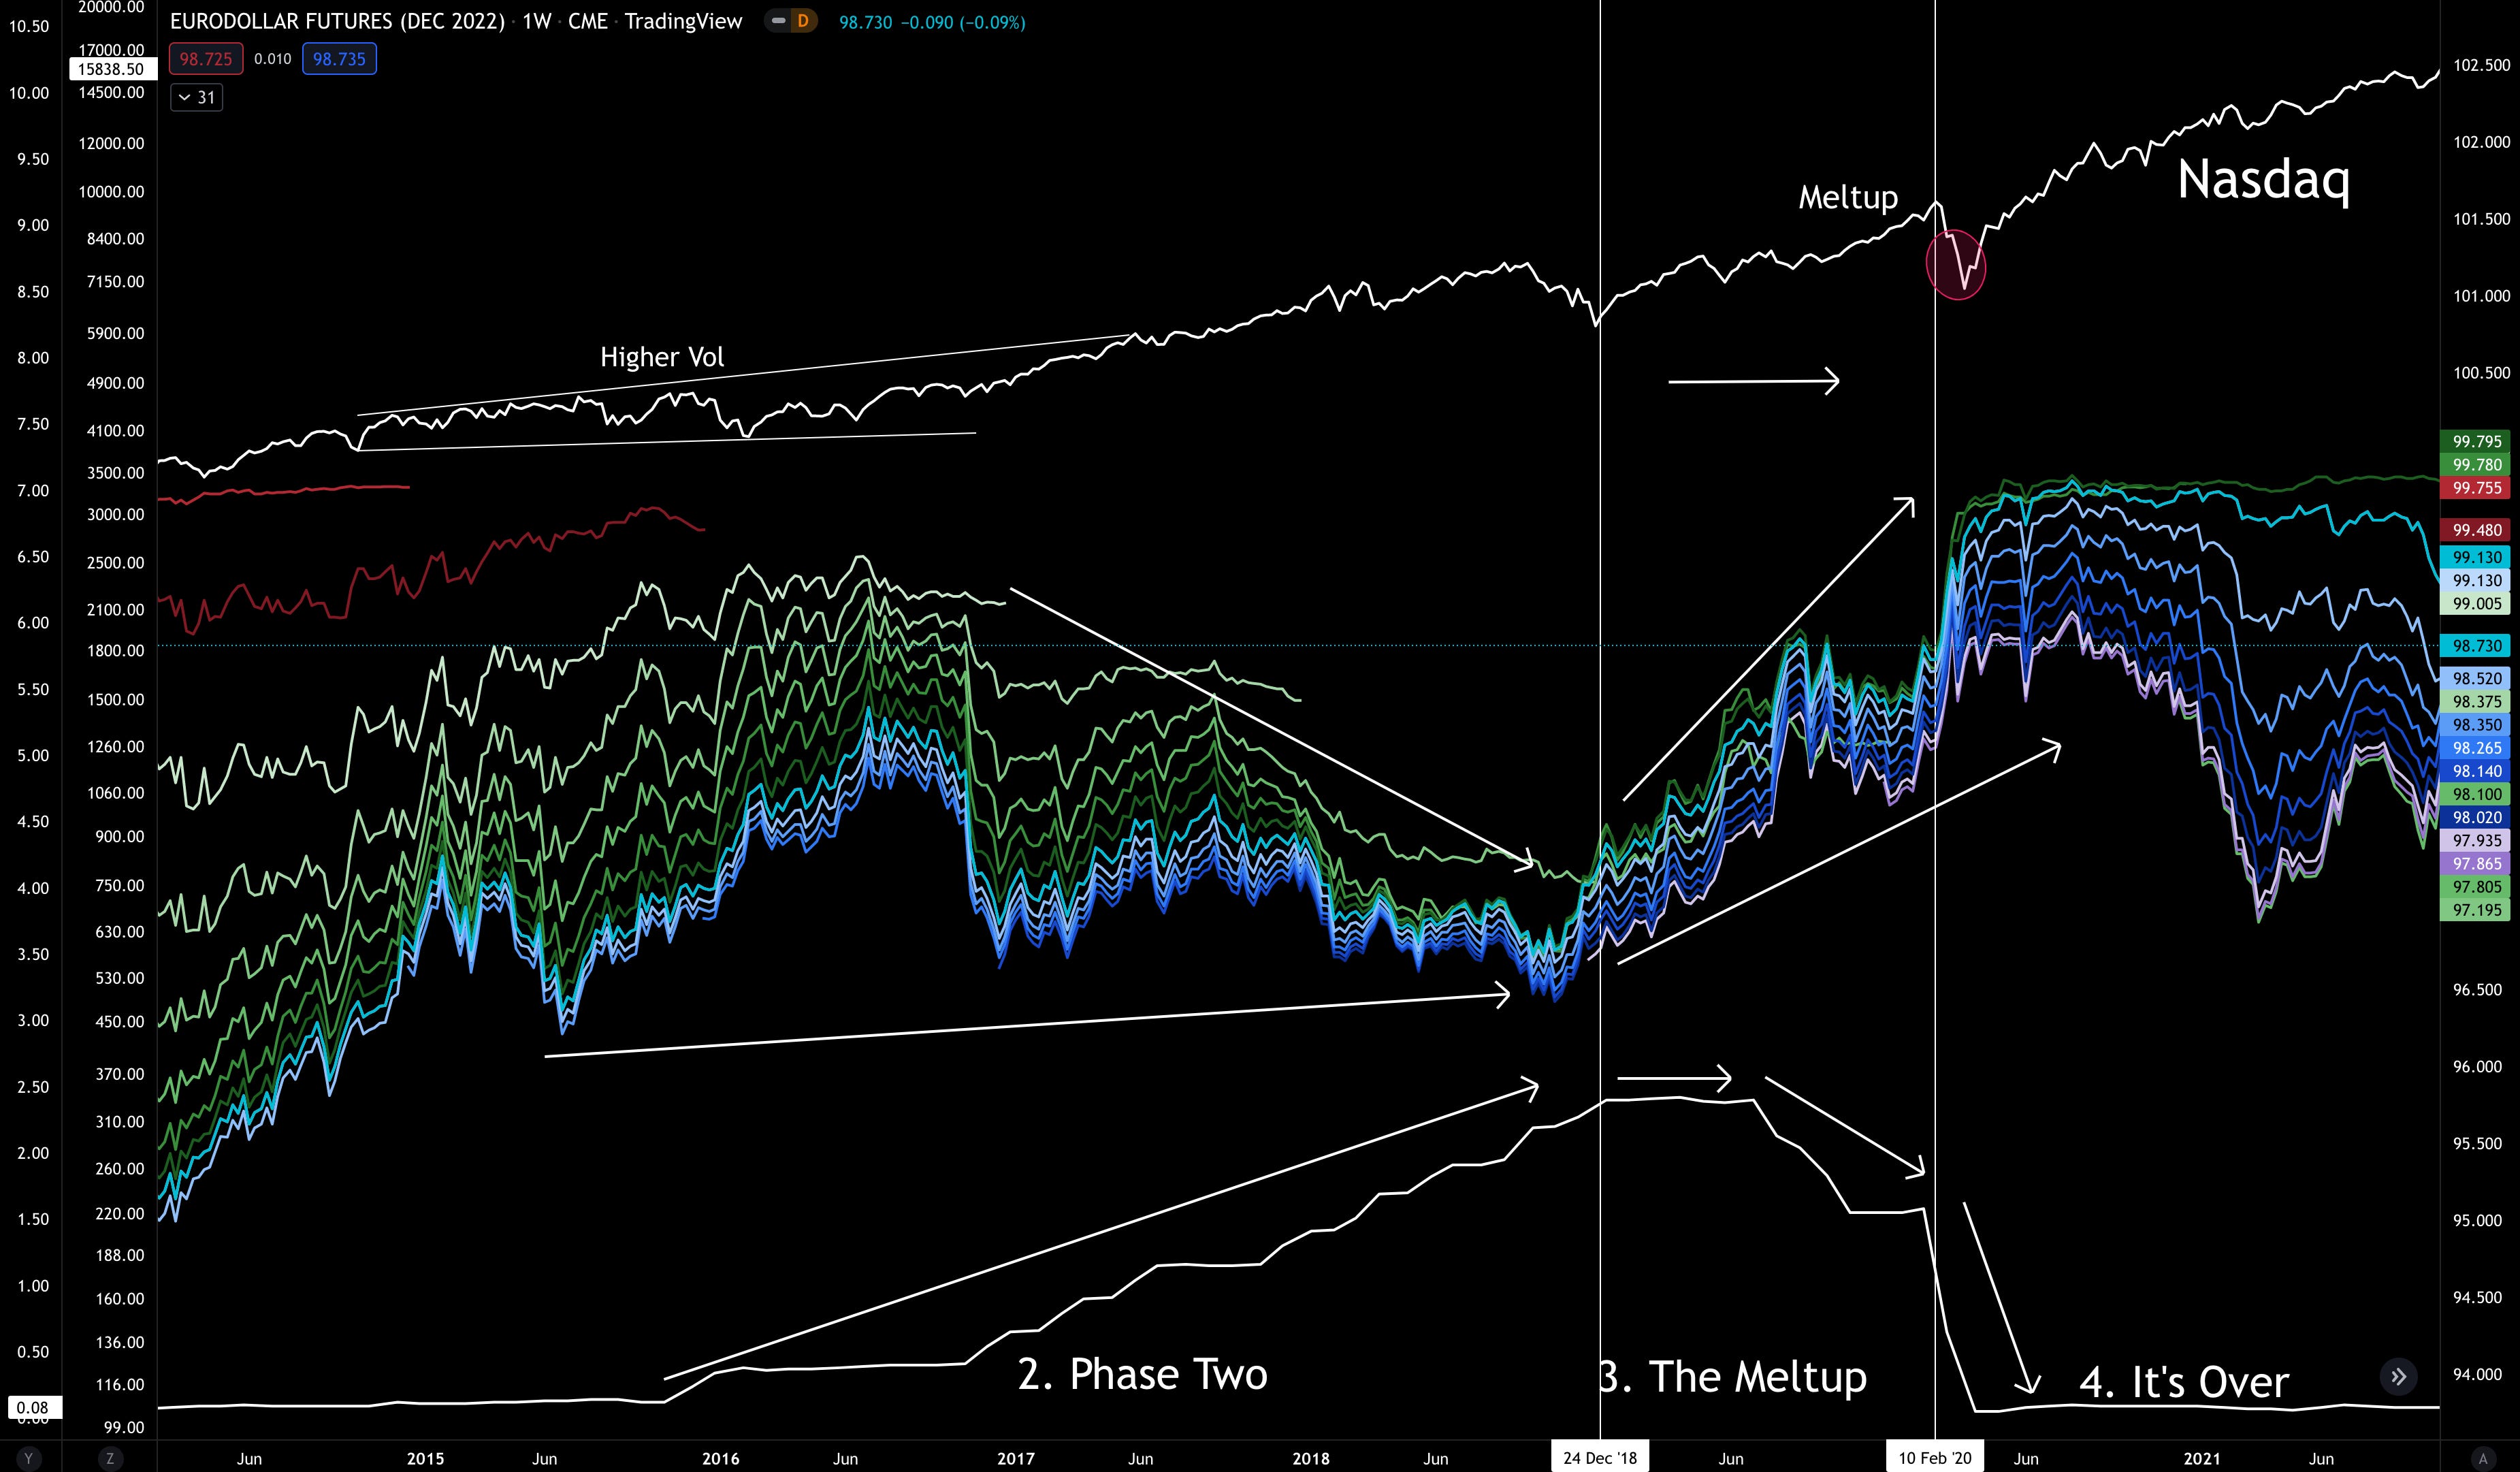
With the cycle ending in early 2020 at the start of the pandemic, we entered the first stage of the cycle again.
This means we are likely to see rates rising again… Which we already know is priced in per our conversation earlier. It’s coming.
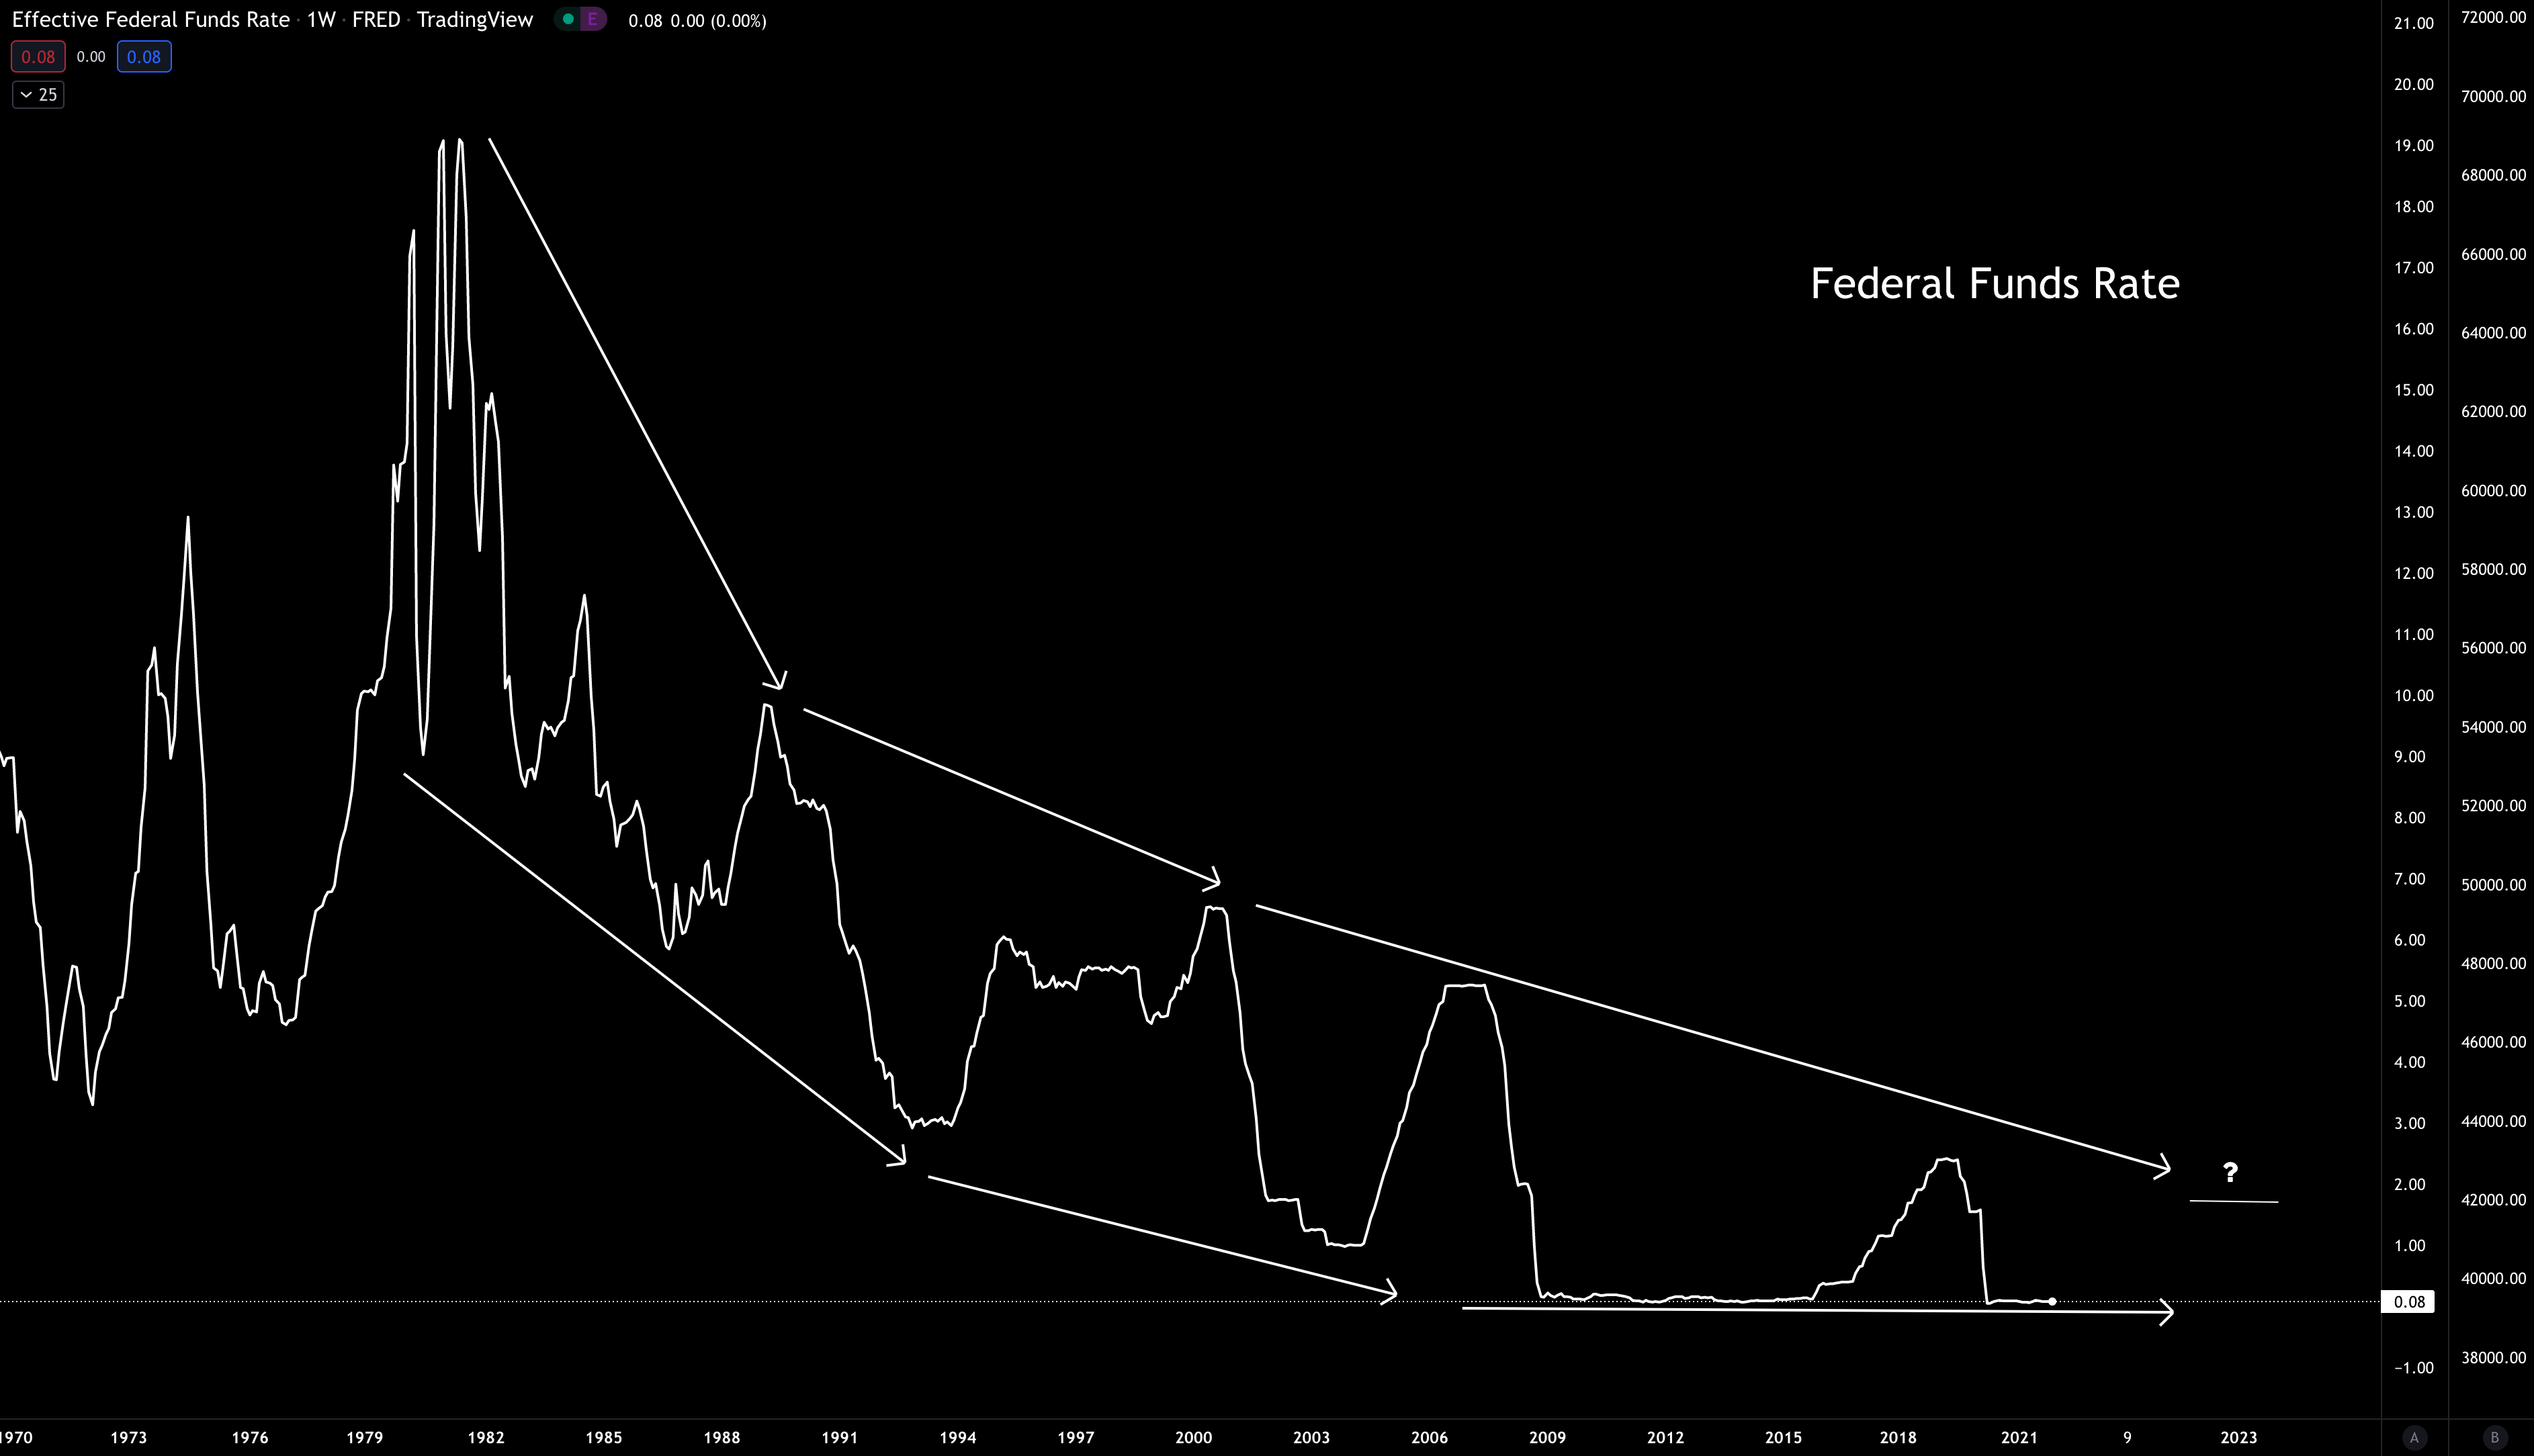
But the reality is, how far can the FED go before it needs to end “Phase Two” and stop hiking rates?
Looking at rates over time we see the FED is not able to raise it past previous highs. It’s a slow trend towards zero.
Based upon this I find it hard to image we get much past 1.5%.
Going back to our Eurodollars framework again, and applying this rate expectation, here’s where we are…
- Futures contracting and rates rising off zero → choppy / semi-bullish market
Based on history, the market still has runway for higher highs.
And applying this Nasdaq proxy to crypto, it alludes to higher volatility with mediocre growth… And spits of strong growth. These spits of strong growth in Phase Two will likely happen as false signals show. Regardless, this environment is better suited to a trader and stock picker than the multi-year hodler.
Then once we see a Nasdaq selloff and the FED plateauing rates again… Get ready for a ride towards the meltup.
It’s a bubble that surely be an absolute monster.
On a final note…
I hope this essay serves as clarity. One that helps you poke holes in analysts claiming the “end is near”, which mostly stems from arguments centering on the FED raising rates.
Sure, we’ll see drawdowns, but the macro cycle has runway if this framework continues to repeat like it has over the last twenty years.
This is the end of Part-one. I hope you enjoyed it. We still have Treasuries and inflation to come. And based upon what I see with inflation, the old adage of history rhyming might be coming to an end.
Until next time…
Your Pulse on Crypto,
Ben Lilly