The Junk Era
11 December 2023 Market Update

People are drawn to junk.
Think about it…
You buy a new house. Then, after you sign the paperwork, the next move is to fill your house with nice furniture… Get the fixtures like doorknobs, lights, and faucets all up to your standards… And before you know it, the house feels like a home. Your home.
This sense of being, a well-earned accomplishment, gives way to the next moment…
The moment on your next vacation where you reach for a $5 novelty item. You tell yourself it’ll look nice on the fridge or next to your espresso maker.
But the truth is, you’ve begun to accumulate junk. You know it. I know it. Even the kid ringing you up at the register knows it.
Now just replace this marketplace with the domain we speak about here, the financial one.
The most verbal similarity here is junk bonds.
They are risky debt. And for a financial portfolio manager, they come after you’ve loaded up your assets into your key building blocks of pristine debt… The necessary pieces of furniture if you will.
Then, just like the home example, the next desire for junk surfaces. High yield is like a shiny little item that acts as a conversation starter to potential share owners of the portfolio in question.
And while this provides the potential for higher gains, it also means the portfolio’s risk is rising.
We know this all too well in crypto… And you likely know exactly where I’m going…
The altcoin. Which we tend to substitute with explicit descriptors, but for now, we will just call them “junk” coins instead.
Nonetheless, the desire to plunge head first into these junk coins emerges as the gains from Bitcoin and Ethereum start to make traders feel at home. Meaning the 90% and 140% gains from ETH and BTC, respectively, seen year-to-date are not enough.
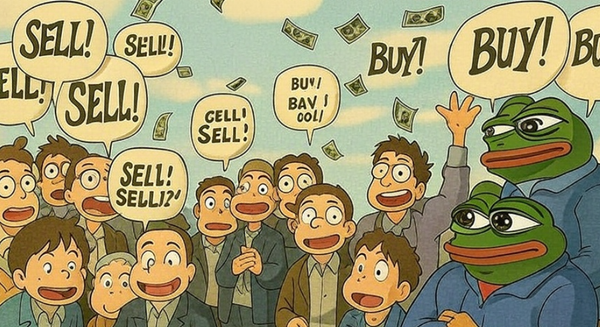
Which is in part why junk tokens began to rip from December 1 into last weekend.
BONK, ORDI, and PEPE were up more than 230%, 200%, and 50%, respectively, for the month going into last weekend.
Hopefully, all of you took the wisdom from last week and paid yourself for your hard trading work before the market took a turn. And I hope many of you went ahead and enjoyed sentimental tokens for their incredible pop.
I say that because the markets do look poised to become a bit more selective. The conversation I had with the trade desk this morning was about risk sentiment… The market feels too comfortable with taking on risk right now.
To see if there was any truth to this gut feeling, we pulled up our Cycle Phases Chart. This chart helps us see what type of “season” we are in based upon quite literally hundreds of data points. If you need a refresher, here’s a quick video that breaks down the concept.
The takeaway is that the yellow phase, which is when all tokens are “in season,” was dominant since November 1. This is a very bullish market to get involved in whenever we realize it.
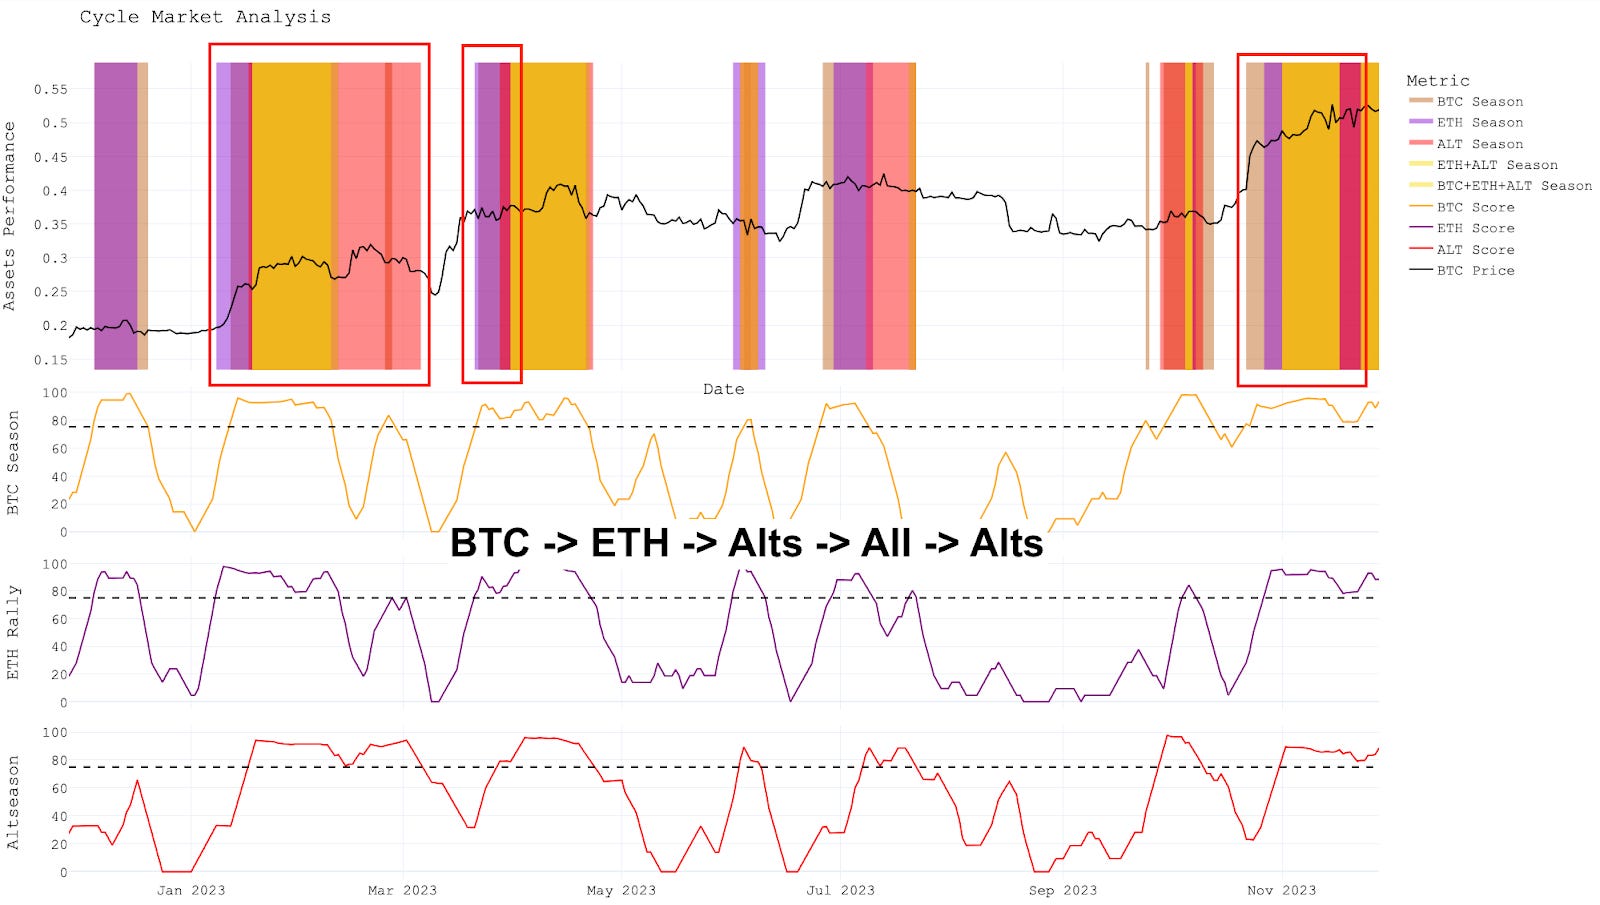
Part of the reason we got such a bullish progression was we also had a very clean progression in terms of “seasons” from BTC to ETH to the rest of the market. You can see in the most recent red box on the right-hand side that we got a brown BTC phase, followed by a purple ETH phase… And even a solid region for junk tokens. Clean.
The clear market structure and progression of phases we witnessed is reassuring as to why the market loaded up on so much risk so quickly. Which means if we do see such a progression again, it might be worth considering adding a few nicknacks to a portfolio.
However, keep in mind that the chart is about a week old. We are currently bringing it into our new front-end that will be made available to subscribers. Once it’s there, I’ll be sure to share it since I did mention it here.
As for right now…
We are nearing the end of this current progression. This doesn’t mean things will just end and price will il Capo of Crypto down to sub-$20,000. If anything, it just means things will become more volatile in the weeks to come.
For any options traders out there, you know we measure volatility using IV, or implied volatility. Our in-house analyst J.J. has discussed it before if this seems like a foreign dialect to you.
Anyways, here’s the current IV term structure chart. It has a noticeable “lump” on the left-hand side. This was a result of the recent selloff… It created a higher IV rating for options contracts expiring very soon.
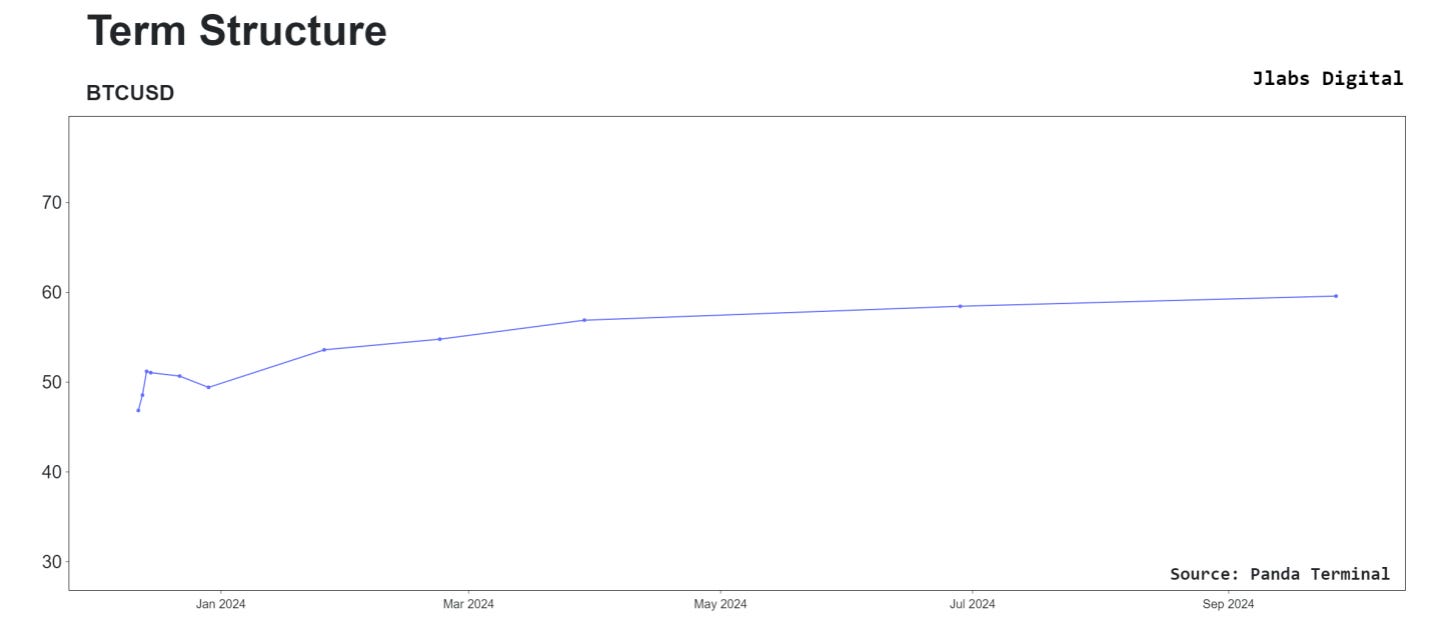
But the real takeaway is that this “lump” hasn’t progressed further down the curve… Meaning volatility is still relatively low.
We quickly went from relatively heightened volatility to a return to a more relaxed state. This would be like something we all realized with fire alarm drills growing up as a kid…
The first few, you respond very quickly. Everything is hurried yet orderly. But after a while, you sort of run through the motions… Your heart rate doesn’t move much, and you expect a return to normal quickly. We get conditioned.
That’s what we see here in our Volatility Spectrum chart below… It shows how quickly the market moves from pricing in volatility, to a return to low volatility. The market is getting conditioned here.
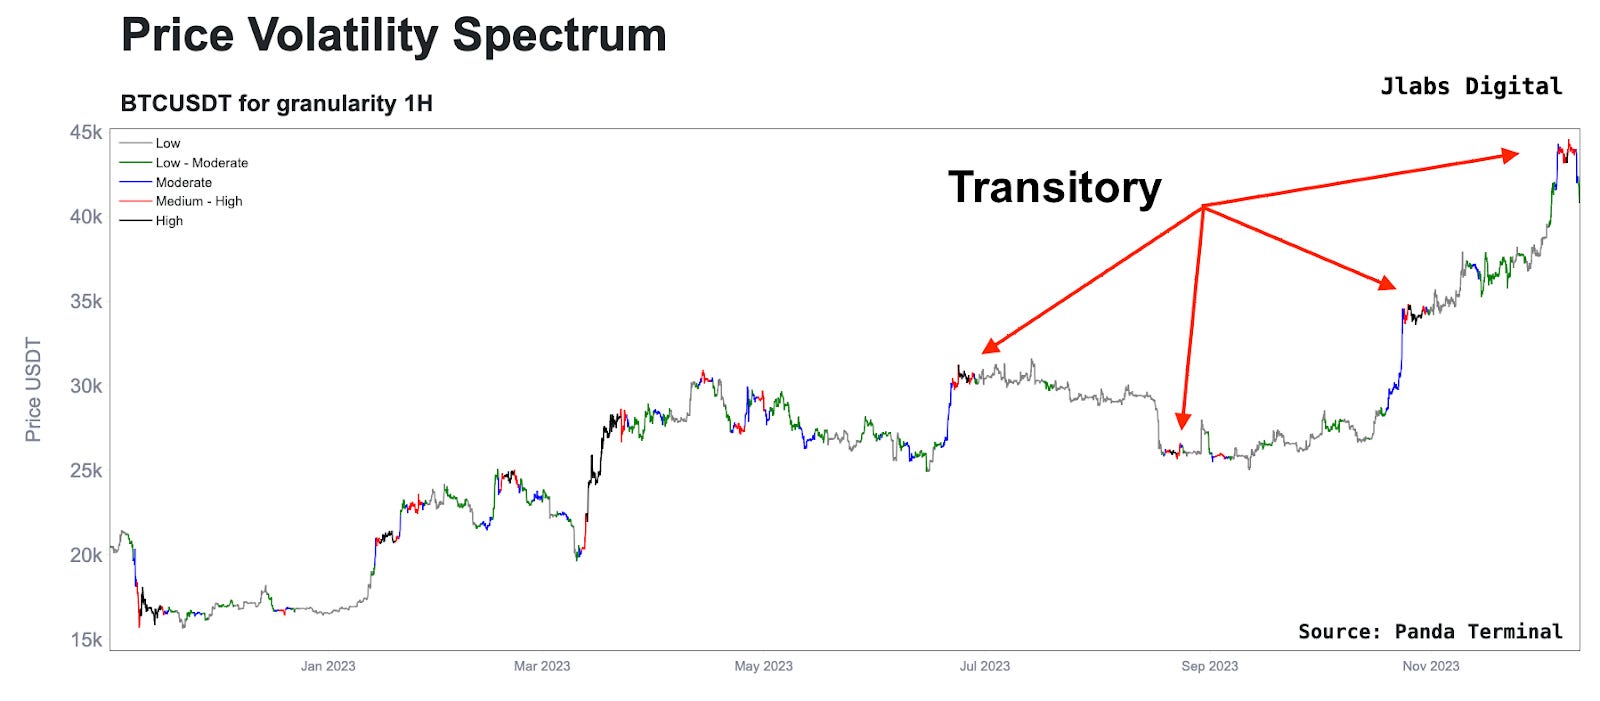
I don’t buy it. The market is a bit overdue here. And judging by where price is right now going into the holidays… A period that is known for lower liquidity… I don’t expect this chart to remain gray and green.
I expect volatility to rise in the coming weeks. Meaning picking winners and losers might be more difficult than what we experienced the last few months.
To the easy stomachs among us, it might just be one of those times where we look to enjoy time with loved ones… For those with a bit more battle-hardened levels of queasiness, stay tuned.
More to come.
Your Pulse on Crypto,
Ben Lilly