The End of Bitcoin’s Bull Market?
Notes From the Lab: This Potent Metric Says Not So Fast


Late December 2022.
Christmas was just around the corner, but given what was happening in crypto markets at that time, not many of us were feeling cheery.
SBF, Sam Trabucco, Caroline Ellison, and the rest of the FTX polycule dominated headlines while Bitcoin (BTC) traded in the low $16,000s.
The darkest days of the darkest winter.
As you likely remember, popular sentiment was suggesting the FTX contagion was only just beginning, another crash was inevitable, and Bitcoin would soon be back under $10,000.
But just when it felt like all hope was lost, we uncovered a potent signal among the noise in our data that told us it was time to “Say Goodbye to the Bear.”
The rest is history. Our metric delivered, and Bitcoin began its epic run not long after, nearly doubling from its post-FTX grave in just a few short months.
But given price’s inability to hold above $30,000, another wave of anxiousness is spreading among market participants…
Is the $31,500 mark we hit last week as good as it’ll get in 2023?
Has the juice been squeezed? Is the bull market over? Are we destined for another trip back to sub-$20,000?
Today, let’s take a look back at MVRV, the same metric that told us to go long in December, to see why it’s suggesting these current anxieties may be overblown.

Ben Lilly here.
For those who have been looking for a new exchange, consider checking out ByBit.
They operate in 160 countries. They have more than 270 assets trading on spot and over 200 perpetual and quarterly futures contracts. They even offer options contracts and NFT trading.
Simply put, ByBit has a lot to offer any trader. And right now, they are offering a $10 welcome bonus if you open a new account and complete some introductory tasks. They also have additional ways for you to earn.
If you are looking for a new platform to trade on, consider ByBit today by clicking here. Also, if you simply want to support Espresso and the Jarvis Labs team, consider giving a click.

MVRV Revisited
First, a quick refresher on MVRV difference, the metric that gave us the bottom signal in December.
MVRV is the ratio of Bitcoin’s market value (MV) versus its realized value (RV).
MV tells us what the entire market’s average cost basis is. RV tells us how much those coins were worth when last transacted.
The difference between these two prices tells us what percentage profit or loss the average Bitcoin transaction is currently realizing.
For example, let’s say somebody purchased BTC at its all-time high of $69,000 in 2021. And they didn’t move those coins until today, when they sold them.
Their RV, or cost basis, would be $69,000.
And their MV would be the price of BTC at the time of the transaction in which they sold it — let’s say $28,000.
The difference between $69,000 (RV) and $28,000 (MV) is roughly minus-59%.
This would give those coins a MVRV difference score of minus-0.59.
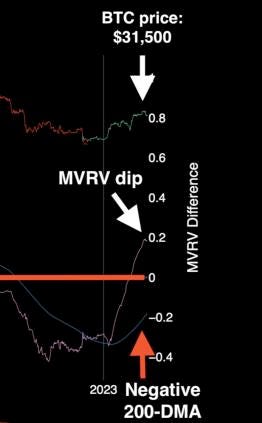
The chart below shows us: price (green and red lines), what the average MVRV difference score is for the entire market in aggregate (pink line), and the MVRV difference score’s 200-day moving average (MA, blue line).
At present, the MVRV ratio is plus-.18. This means that the average Bitcoin transaction is currently realizing a profit of 18%.
The 200-day MA, however, we see is still in deeply negative territory around minus-20.
This means that despite Bitcoin’s price rising 75% since December, the average Bitcoin transaction over the past 200 days is still averaging a 20% loss.
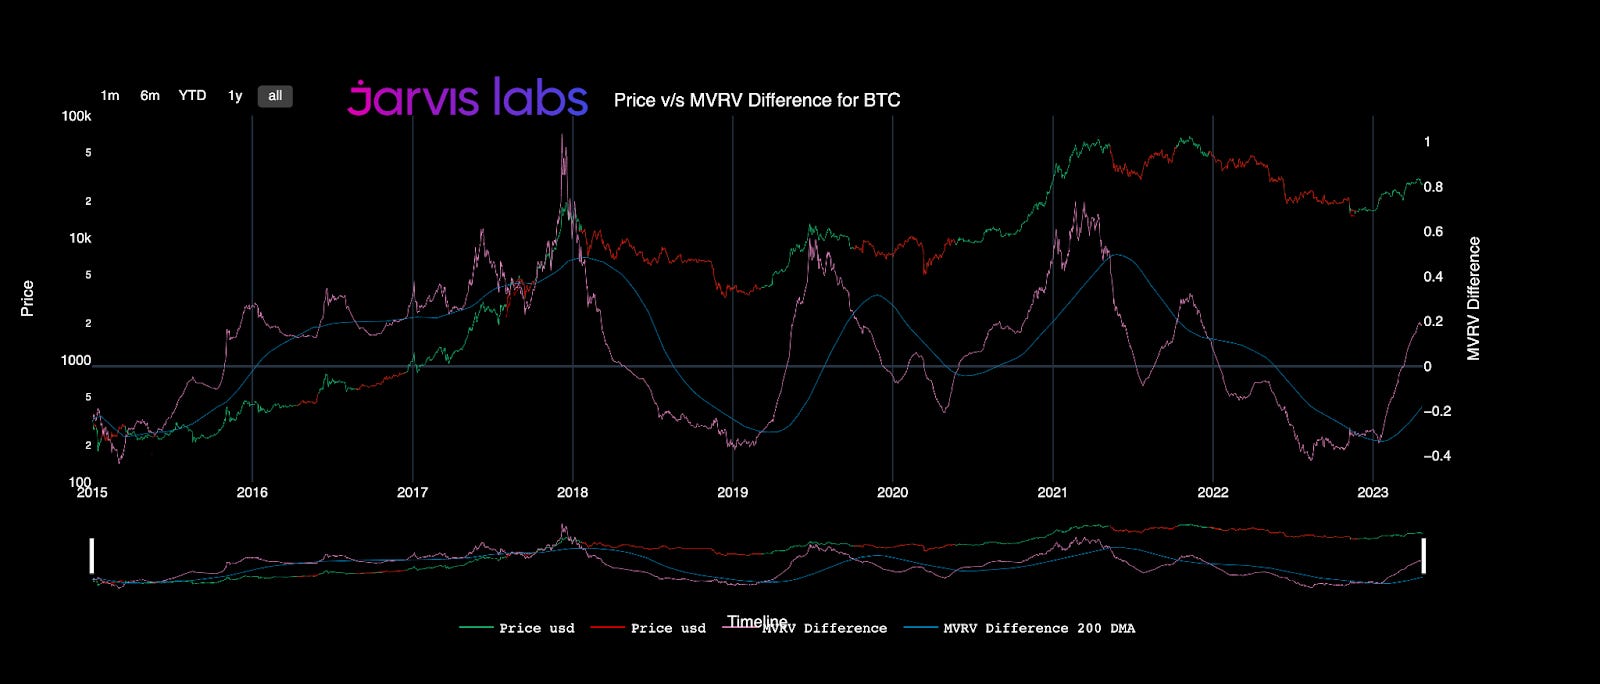
This is notable, because as we’ll see below, in all previous instances where MVRV is positive and its 200-day MA is negative, Bitcoin’s price did not reach a cycle top until after the 200-day MA moved into positive territory.
Big Boon Come Soon?
Each previous time (2015, 2019, and 2020) the MVRV difference score has gone from negative to positive, as it has in 2023, it was followed by a pullback in the score as well as BTC’s price.
However, these pullbacks only marked the top in immediate time frames, not the cycle highs. In each example, price made new highs after the initial pullback.
Today, we’ll review what BTC prices were when MVRV first hit resistance, and what the ensuing 12-month cycle high was following that pullback. We’ll use the chart in the previous section and zoom in on each relevant time frame.
Starting with the below, which shows us November 2015. Here, the initial MVRV pullback happened when BTC was at $400, while the MVRV 200-day was still negative (above the red line = positive, below = negative).
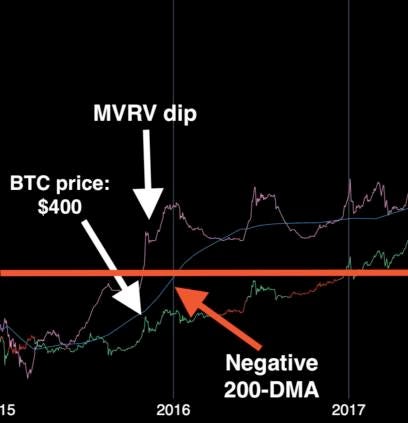
By June 2016, it hit a 12-month high of $785 after the MVRV 200-day MA moved positive.
A ~96% increase from the pullback.
The next instance of this structure came during the May 2019 echo bubble, when Bitcoin ripped from the low $3,000s up to $8,800 to start the year. Despite the intensity of this early run, MVRV’s 200-day was once again deeply negative at the time of the pullback.
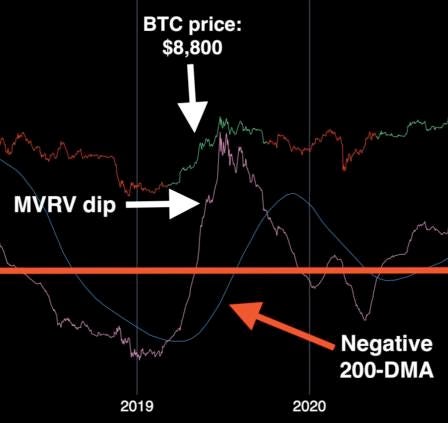
It wasn’t until a month later, when the MVRV 200-day flipped positive that price put in a 12-month cycle high of $13,900.
A ~58% increase from the pullback.
Then in 2020, we saw this pattern replay once again. With BTC around $11,900 in August, the market offered one of its final pullbacks before igniting into a parabolic uptrend. Once again, the MVRV 200-day MA was (slightly) negative at the time of pullback.
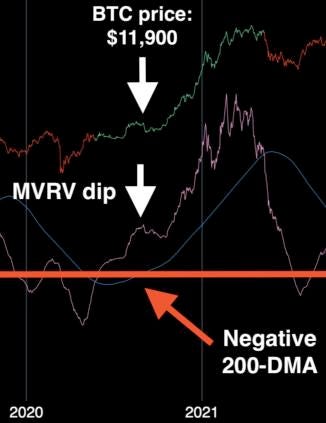
The 12-month high following that pullback came in around $64,800 the following April.
A whopping ~444% increase from the pullback.
And now last, but most importantly, we have today’s current MVRV/price structure.
As we see, following last week’s rejection at the $31,500 high, MVRV suffered its first dip of the year, as it fell 10% from +.20 to +.18 when top buyers were washed out.
Meanwhile, the MVRV 200-day MA still remains negative, making it only the fourth such occurrence of this rare structure in BTC’s history.
Should the past pattern repeat itself, Bitcoin would reach a current cycle high of anywhere between $49,770 (+58% from $31,500 pullback) and $171,360 (+444% from $31,500 pullback) within the next 12 months.
And while I wouldn’t go placing any large bets on such extreme outcomes just yet, this data is worth being mindful of.
After all, markets, especially Bitcoin’s, tend to move in wild and unexpected ways. It’s quite possible that this week’s bearish price action was nothing more than another violent shake-off from the golden bull.
This metric certainly seems to think so…but only time will tell.
I’d like to hear what you think, comment below or message me on Twitter @JLabsJanitor!
Your friend,
JJ
This newsletter is sponsored by Bybit. Be sure to try out the exchange here, and take advantage of all they have to offer today.


