The Bitcoin Milkshake Is Back on the Menu
The Blend: The Real Reason Behind BTC’s Volatility; An “Upgrade” to the Global Monetary Order


Why Bitcoin’s Pumps Are So Parabolic
As the voices drift closer, you hear the door open. You close your eyes, grip the armrest of your couch a little tighter, and take a deep breath.
Every parent dreads this moment. Your three kids just got home from school, and you have to give them the news.
It’s time for them to do their chores.
What makes it so tough is they all have different reactions.
Your 16-year-old usually doesn’t put up much of a fuss. She just nods her head and gets to work.
The 13-year-old often grumbles for a couple minutes, but in the end she does what she’s told.
It’s the 9-year-old you have to worry about. Ask him to take out the recycling, and he starts spitting fire like that superhero baby from The Incredibles.
If you know what I’m talking about… Then you already know how elasticity works.
Elasticity is essentially how much something changes in response to a new event. When you deliver the same piece of news to your three kids, you get three emotional responses of different intensities. One is pretty muted. Another is noticeable. And the third is off the charts.
The different intensities show how elastic each kid’s emotional response is. Give your kids a small number of tasks, see a big change… That’s minimal elasticity. Give them lots of tasks, and see minimal change – lots of elasticity. I like to view it as how much something can handle before it snaps.
In the world of crypto, we translate this to how much a change in demand results in a change in price. It’s quite literally one of the most highly misunderstood topics in the industry.
While at the same time, it's also the most common phrase uttered in the halls of Crypto Twitter: “The parabolic pump.” “The squeeze.” “Convexity.” For Econ nerds, it’s all about elasticity.
Let me give you a quick chalkboard example of what I mean.
Bitcoin’s demand curve – for today’s purposes – is a normal curve, but its supply curve is nearly vertical. Reason being is the supply is coded in.
On a chart, it looks like the example below. Where supply and demand meet, that’s the price of each BTC.
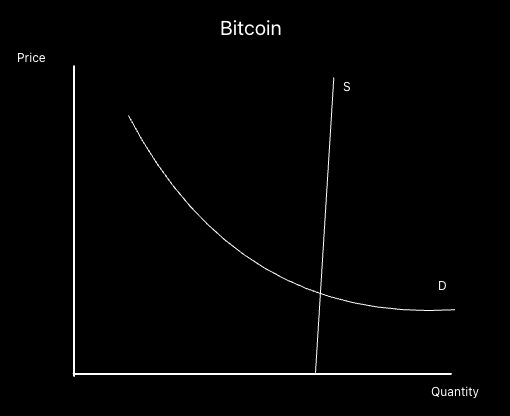
But as demand for BTC rises, that creates a minor change in supply. More hash (computational) power enters the network, which means shorter times for creating a new block. So there are more Bitcoin minted per day as demand shifts higher. This is why the supply curve slants ever so slightly to the right.
To use this example to better illustrate what we mentioned before… When you “demand” the 9-year-old to pick up their room on a Saturday and they freak out…Below is their response in chart form.
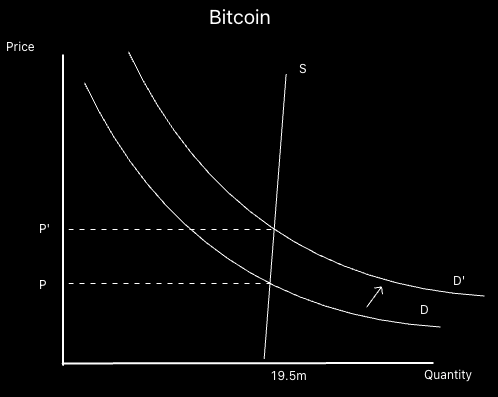
We realize a major freak-out, or move, in price.
(Note, the slant in supply on this chart may imply thousands or millions more new Bitcoin being minted, but in reality, it’s not that much. We’re just using this for illustration.)
Meanwhile, Bitcoin’s supply doesn’t change much relative to this change in demand. There is little elasticity. Or said another way, it’s highly inelastic. It doesn’t “give” a whole heck of a lot.
This type of (in)elasticity is why its price responses are so massive.
Or referring back to our example earlier, for certain assets, news can create outsized movements for price. This is the 9-year-old who doesn’t want to give in to your demands to do their homework, so they end up bouncing off the walls. They have an “inelastic” response because they don’t bend to your will, which ends up making their outburst more violent.
So when demand starts to pick up again in the market, and you’re wondering why price is simply running away without a care in the world, this is why. Bitcoin’s supply has low elasticity.
And as I’ll show you next week, Bitcoin is becoming less elastic over time. Not because it’s aging and becoming a curmudgeon, but for another reason.
But will that mean bigger price swings over time? Well, for that answer, you’ll need to tune in to a few more of these.
And hopefully by the end of these random economics discussions, we will have a better understanding why engineering supply relative to market demand is so important for price stability.
This next topic is something we’ve published in a previous Blend. But in light of my Single Origin piece from Monday, in which I laid out a scenario that could eventually spell the end of the dollar’s reserve status, I thought it was appropriate to resurface this insight…
The Dollar’s Days As the Reserve Currency May Be Numbered
You’ve heard me mention it and likely have heard it from several other keyboard warriors like myself: Bretton Woods 3 (BW3).
It’s a loaded topic that fuels heated opinions among economists, traders, and even retail. It hits on quite literally the most important subject in finance: the global monetary order.
The legacy of Bretton Woods began in 1944. This defined an era where global currencies were pegged to the U.S. dollar, which in turn was backed by gold. The system enabled stability and predictability, with the dollar ascending to a dominant role as the world's reserve currency.
This v1 of BW ended in 1971 when Richard Nixon severed the dollar’s link to gold, bringing v2 into the arena.
It brought along with it fiat currency. Fiat means, “Let it be done.” Or in other words, the “$10” written on the dollar bill makes it worth $10. Meaning gold was no longer behind it, just the formal decree from the supervisor of the money printer.
This thrust central banks even more into the limelight, as their task of maintaining price stability became more difficult.
And since the U.S. was becoming the reserve currency, it meant it needed to run a heavy trade deficit. This allowed U.S. dollars to make their way out into various markets. The trade relationship between the U.S. and China highlights this dynamic the most, with China holding well over a trillion dollars’ worth of U.S. Treasurys until recently.
It also brought about the petrodollar concept. The U.S. helped oil producers by paying in dollars. This in turn allowed future oil buyers, banks, etc., to help finance trade from these producers. And in turn, give rise to the entire oil market of the Middle East.
The U.S. dollar was the conduit of global trade. It’s in part why 88% of foreign settlements involved the U.S. dollar. As easy as it is to hate on petrodollars, eurodollars, etc., this policy did address many global trade concerns (e.g. currency valuation changes, settlement, currency acceptance).
According to rate specialist Zoltan Pozsar, who had stints at the Federal Reserve Bank of New York and Credit Suisse, this all changed with the Russian invasion of Ukraine in 2022.
The severe sanctions levied against Russia denied it access to a significant portion of its foreign exchange reserves, including its supply of dollars. This incident set a precedent: If you go against U.S. policy, then your assets can be confiscated. It was a moment where a global hegemony abused its power to wage financial warfare.
That marked the pivot to v3 of Bretton Woods.
Countries now look at U.S. dollars in their bank accounts and see a new degree of risk attached to them.
They realized that the dollars on their balance sheets mean less than the commodities they could sell to the world. Meaning it suddenly put an emphasis on investing in commodities markets and supply chains.
This is why we are now beginning to see trade agreements where the U.S. dollar is no longer involved. It’s a shift that will take significant time to usher in, mostly because of the sluggish nature of government and old financial infrastructure.
We’ll wrap up today with an insight on another trend to watch out for from Bitcoin over the next few months…
Bitcoin’s About to Take the Driver’s Seat Again
Do you remember where you were on April Fools’ Day, 2019?
I’ll give you a clue… We were trading below $6,000 for about five months and layoffs were happening left and right in crypto.
Then suddenly, Bitcoin prints a massive candle. 17% on the day. A straight-up, “Mamma Mia”-type of candle.
I bring that up today given the events that took place after the Grayscale ruling last week. In terms of price action, right now I see a lot of similarities to what took place in 2019. And it has me anticipating a trend to unfold regarding Bitcoin over the next few weeks and possibly months.
It has to do with Bitcoin dominance (BTC.D), a measure of Bitcoin’s market share of crypto based on its market cap. In the chart below, we can see that that rally in 2019 started back in 2018, when we got a nice double bottom (red box), followed by a solid run up until Q1 2019.
Then, we trended down for a few months (first red arrow) before getting the massive reversal on April Fools’ Day (first green arrow).
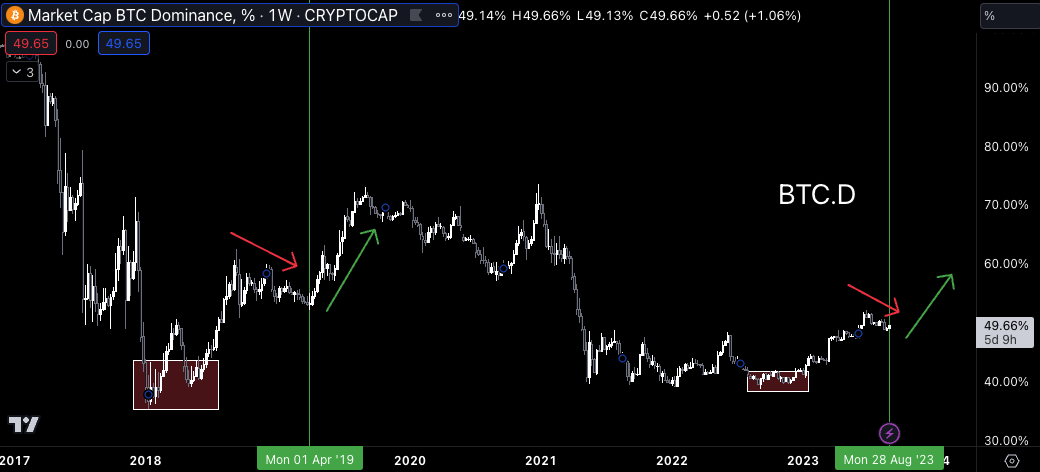
Again, today reminds me a lot of that reversal in 2019. We were in a winter, everybody was low energy, nobody cared about bitcoin or crypto. Similar sentiments as we have today.
And if you look on the right side of the chart above, we also see a similar technical pattern, with a double bottom in late 2022, then a run upward with a brief downtrend in 2023.
Back in 2019, once energy came back, Bitcoin led the way for the next several months. Which I’m anticipating now. And I have to imagine that the pattern of memecoins garnering most of the volume on exchanges will cease.
This is exciting to me, especially because the biggest catalysts for price action are still on the horizon, and they are specific to Bitcoin: the ETF decisions.
But this doesn’t necessarily mean good news for other tokens.
The reason being is if we look at an ETH/BTC chart, which measures the price of ETH relative to Bitcoin, and compare it to the dominance chart, we can see ETH/BTC didn’t fare too well in 2019.
Check it out below. ETH/BTC is the orange line. As it goes down, that means the value of Ethereum compared to Bitcoin is going down, and vice versa.
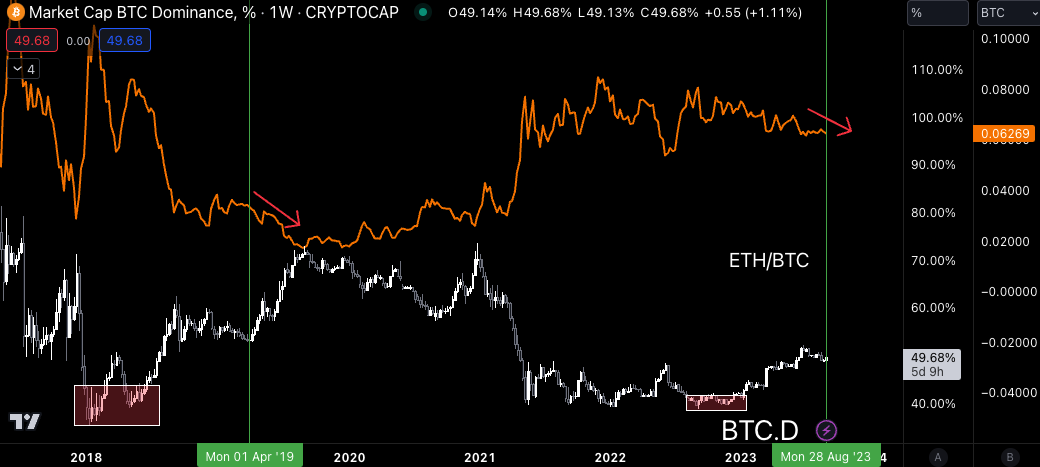
In 2019, Bitcoin earned the lion’s share of liquidity. That’s another way of saying the Bitcoin milkshake effect unfolded, in which Bitcoin sucked a lot of the liquidity out of other tokens.
But once it was done at the end of 2020, it was time to take the first step down the risk curve to ETH.
So for now, I want to see if this dominance theory holds. If it does, I’ll focus on Bitcoin until I see the ETH/BTC drop I’ve been waiting for. Once that happens, I’ll be looking at ETH as well as other larger cap tokens.
And it won’t require me to be right in front of my computer. These types of moves require serious patience to do. I’m talking scaling into a position on the order of weeks, not minutes.
That’s why we need to have patience in crypto. Otherwise, many of us will chase risk way too early and miss out on some of the biggest moves.
This topic fascinated me so much I brought it up on last week’s episode of Alpha Bites and discussed it with the team. If you want to hear their thoughts, you can listen here.
That’s all from me today. Hope you enjoyed these insights.
Your Pulse on Crypto,
Ben Lilly