Swimming Naked
The squeeze that nobody noticed.


My senses piqued as I felt the wind from the West.
It was time to pack it up.
Out where I was, there was no cell phone or internet service to check weather reports.
Changes in the environment had to be felt, not seen.
And to be ready for such changes meant having to be immersed in the environment constantly.
I’d been traveling across the country seeing the sights for months now. My senses were becoming tuned to the weather like never before. It allowed me to sense subtle changes throughout the day.
I figured we had 15 minutes to clear camp and get into our humble abode, a small Airstream travel trailer pulled on the back of my pickup truck.
Just after we pulled out of camp I checked in my rearview to see the rain dropping buckets on the campgrounds and many other camp goers who we had just left behind.
They likely thought we were just lucky…
This past week, as Bitcoin fell to retest $60,000 once again, I felt a similar intuitive sense that a storm was on its way due to how much time I’ve been spending immersed in the wild frontier of crypto options markets.
Sir enough, a storm came and went.
What was interesting is there was hardly a mention of it on Twitter. News desks didn’t see it. And traders not involved in options or in our Lab were giving it no attention.
It’s remarkable in a way. We all saw the headlines… BTC lost its support just below $60,000, ETFs outflows turned negative, mass panic, etc.
All that excitement to just see price quickly reclaim the April price range before the week closed out.
The storm passed just as quickly as it appeared.
That’s because what took place early in the week was your classic gamma squeeze unfolding - a price move that was similar, yet the opposite in some ways from what we saw in late February, and those jarring headlines were little more than red herrings.
Let me explain a bit more on exactly what I mean.
In the chart below, we have a GEX chart. GEX measures how much gamma is likely sitting at each price level. This gamma in particular is for entities that are likely to hedge. If the bars are red, it means the hedging happens in the same direction as the movement in price.
Meaning if red bars sit just below the current price, as price moves into the red bar region, it speeds up. Green is the opposite.
In the GEX chart here, it shows heading into the April close last week that there was considerable short gamma pooling below $59,000 on BTC and $3,000 on ETH.
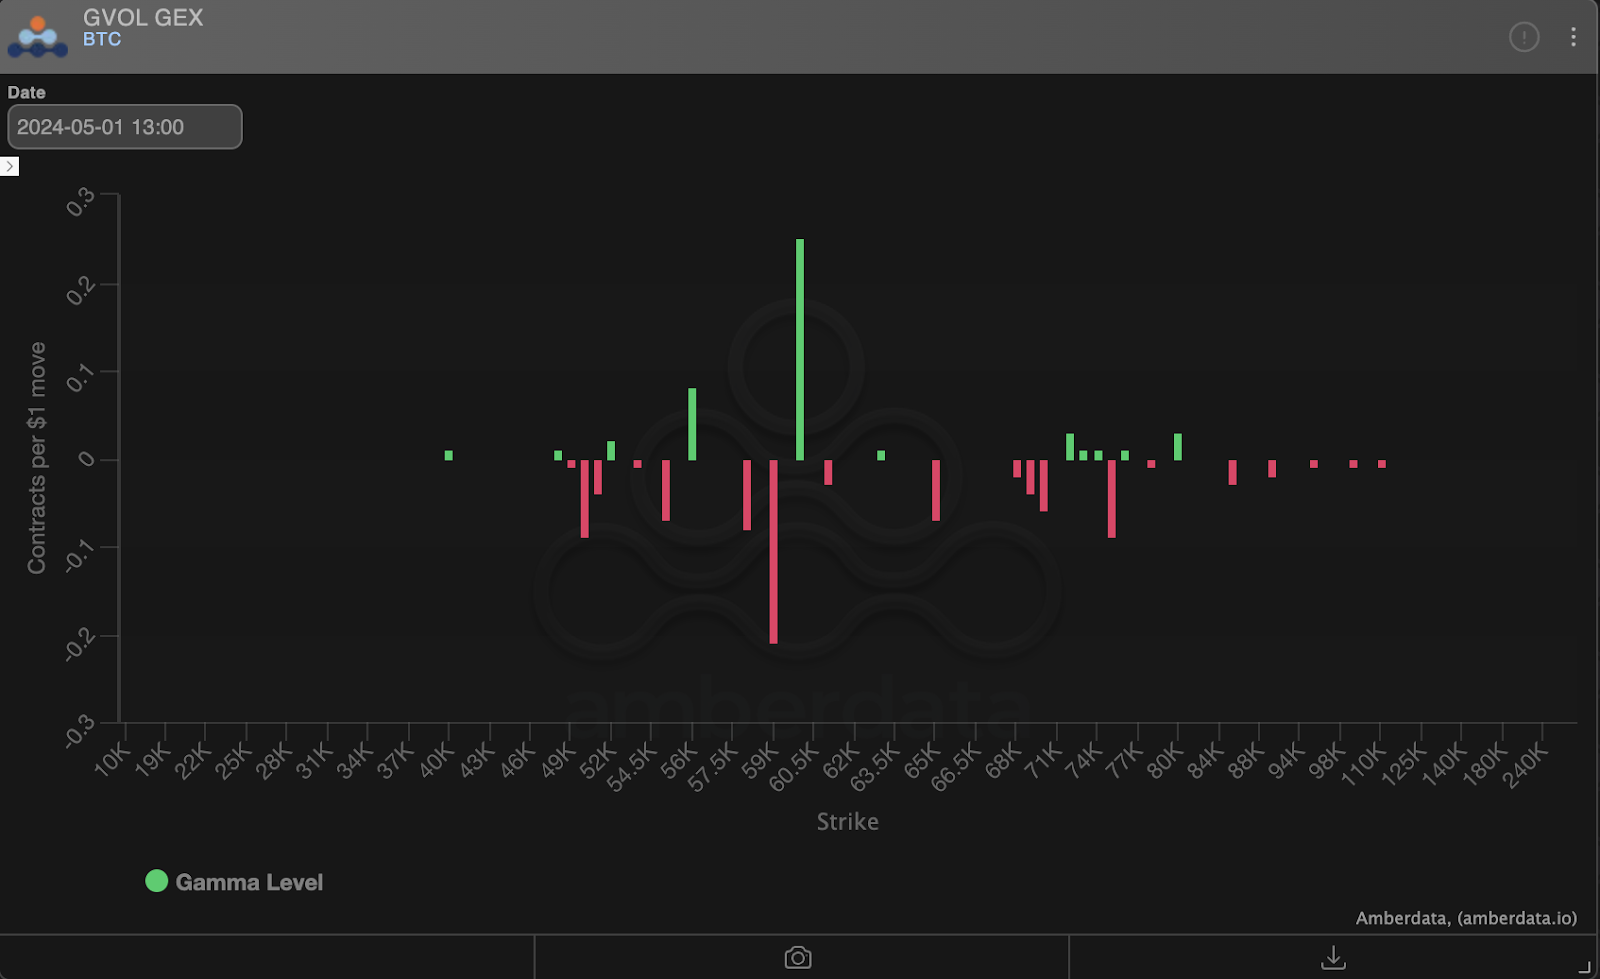
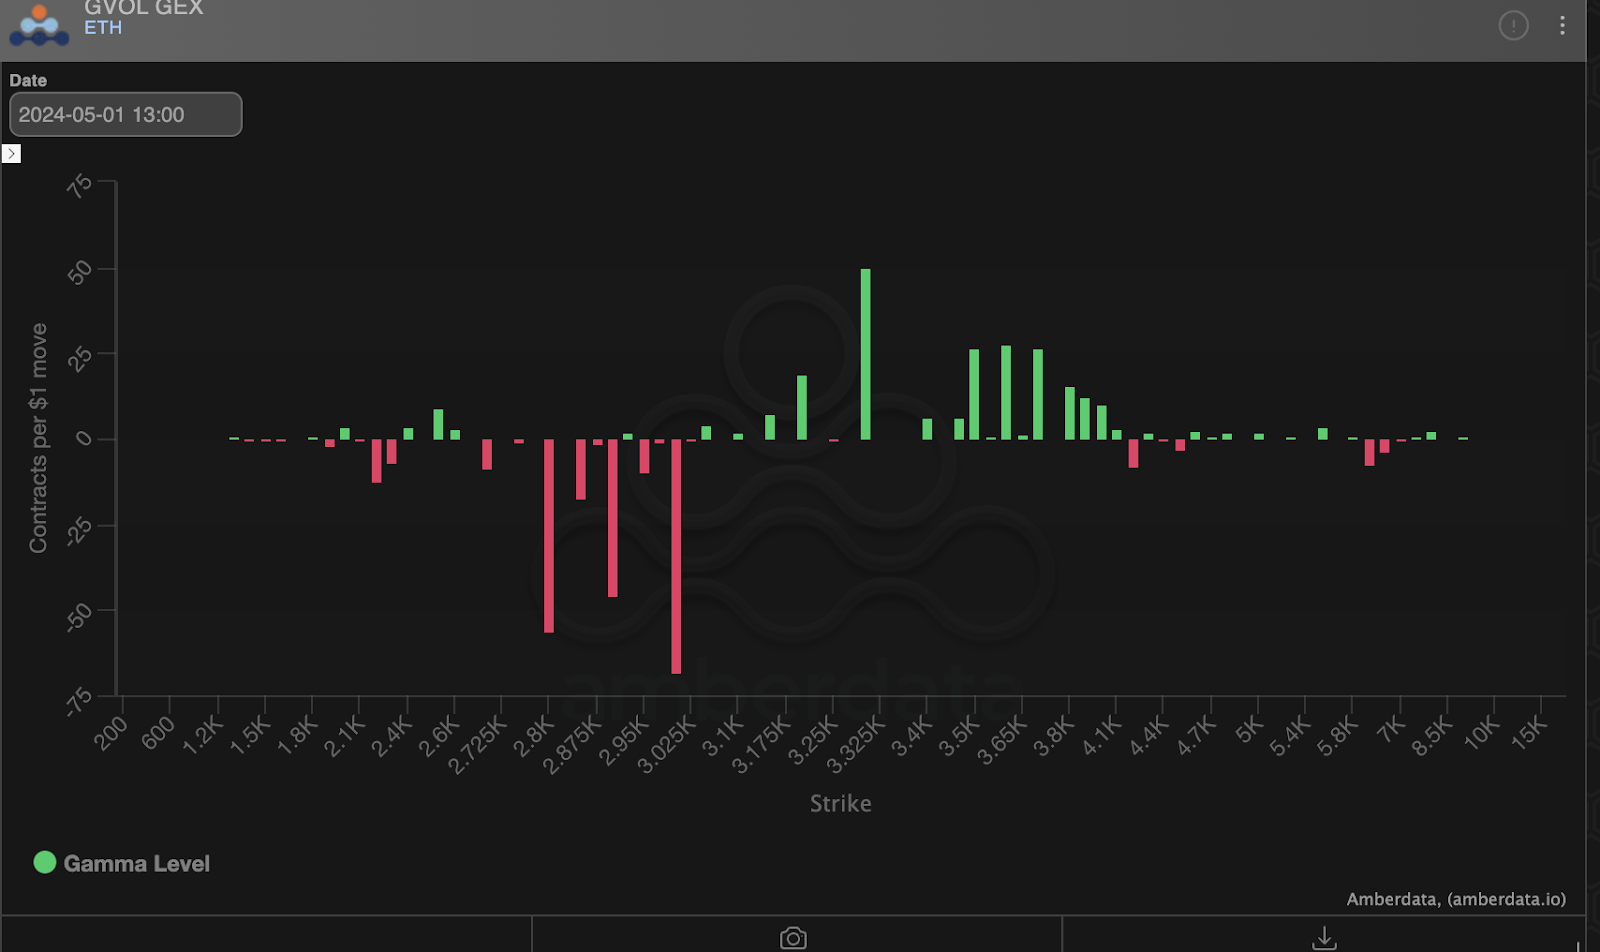
This meant that options sellers were shorting BTC and ETH as price broke support, and accelerating the downside price action.
That’s a gamma squeeze.
It was the primary driver of BTC’s drop from $59,000 to $56,000, and ETH’s drop from $3,000 to $2,800 within minutes.
This need for protection to the downside coincided with Wednesday’s FOMC event. The market was quick to show us who in the options game was “swimming naked”.
It was quite the event.
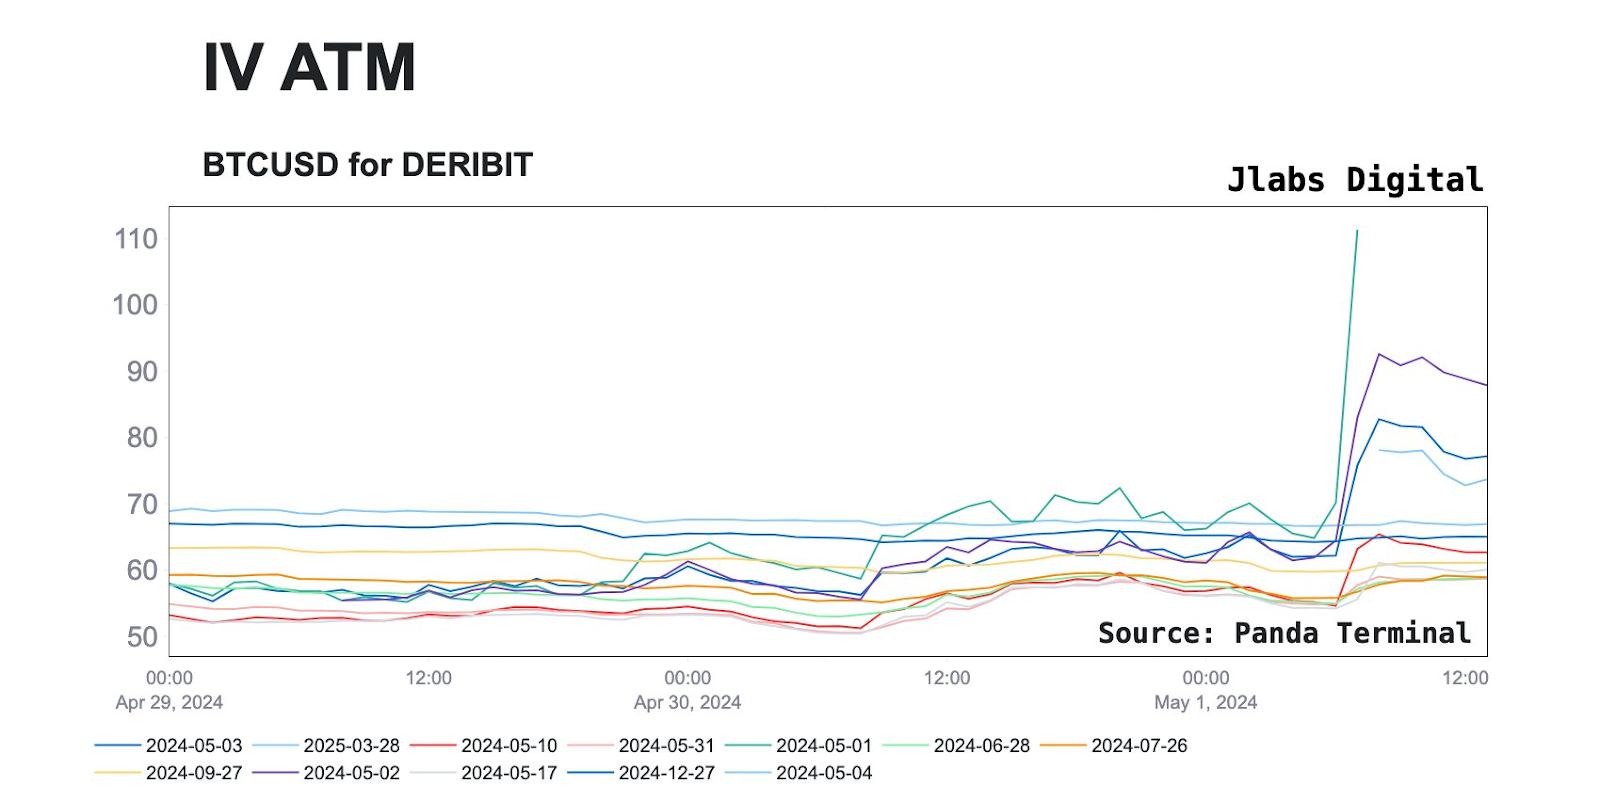
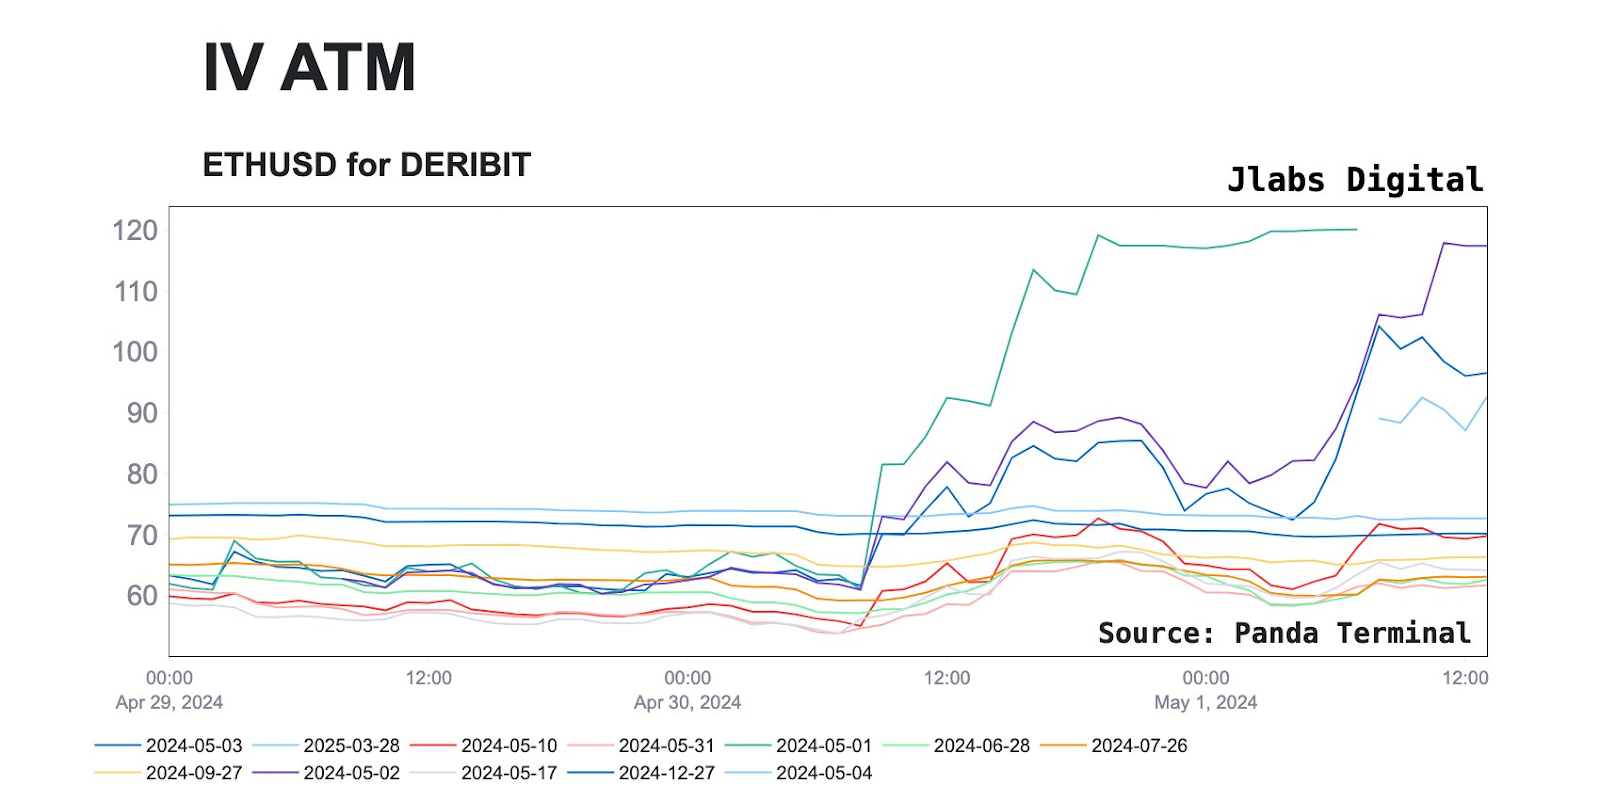
Now, before we move on, I still want to show you this panic reflected in at the money (ATM) IV charts for both BTC and ETH. IV is implied volatility, and it’s how we measure just how much of a premium options contracts are going for.
When there is a squeeze like this, these IV prices skyrocket.
You can see this spike in the tweet below, along with some term structure charts as well.
The funny thing about observing the options market is you’ll often find that most people don’t buy insurance until they have too, which often causes people to rush into positions at the same time, and ultimately overpay for contracts they could have purchased much cheaper prior to the IV spike.
It’d be like those campers paying 2-3x the amount for a poncho or dry clothes after they rain began.
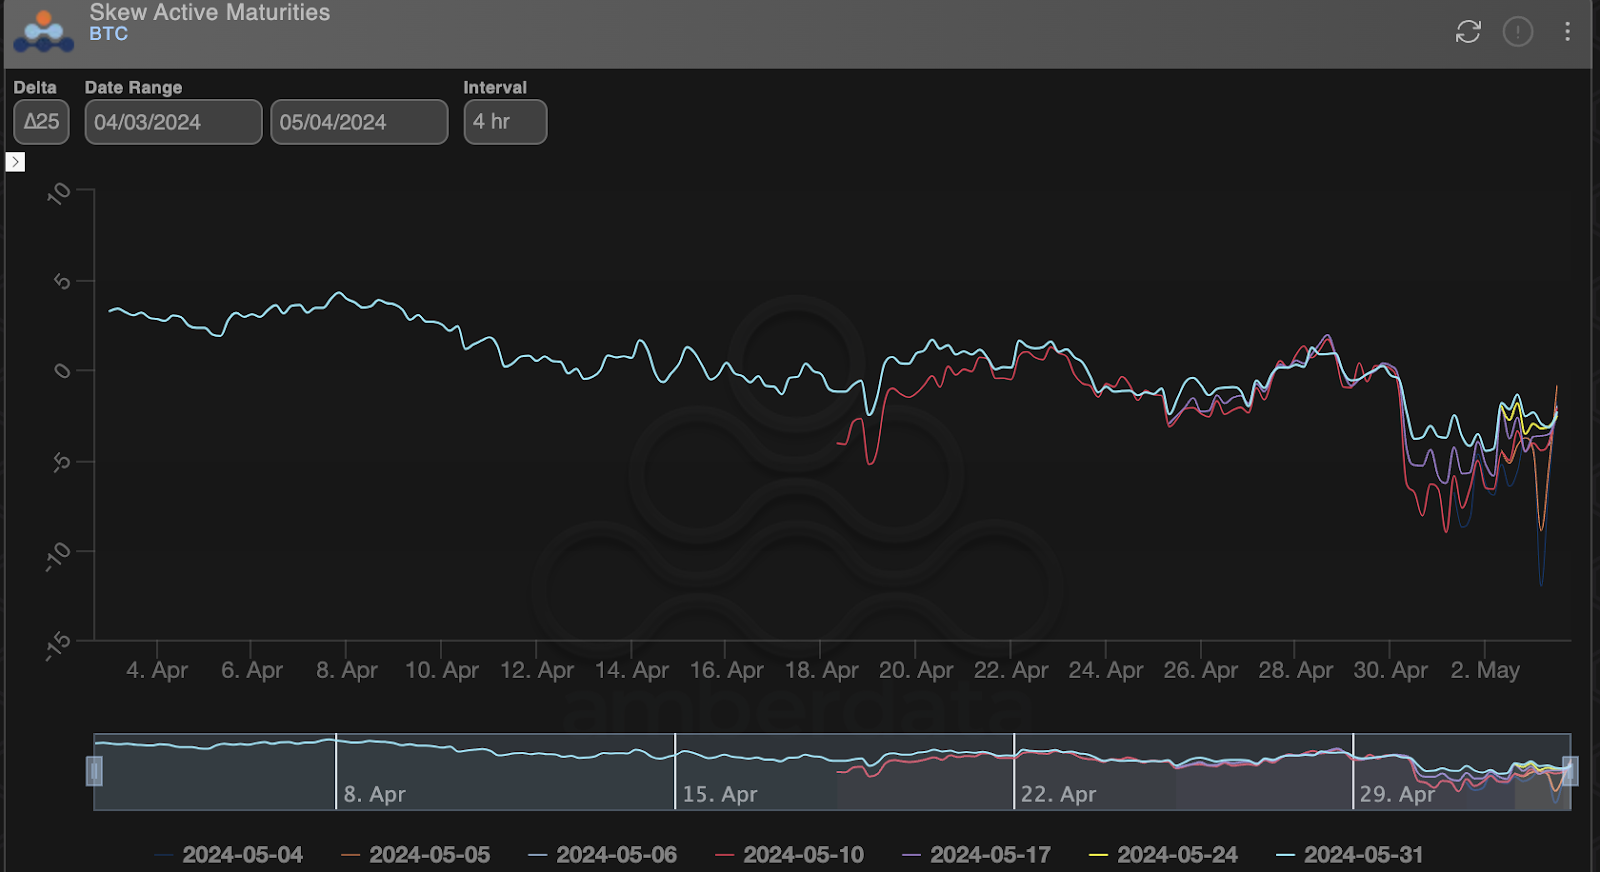
Another way we can track this fear is through the put skew, which measures the premium cost of out-of-the-money puts vs calls, and as we see here Tuesday night it flipped deeply negative for all expiries in May - which means people were willing to pay more for short exposure than long.
We can think of it like negative funding rates in the futures market, something that doesn’t happen all too frequently, but when it does, it doesn’t last long.
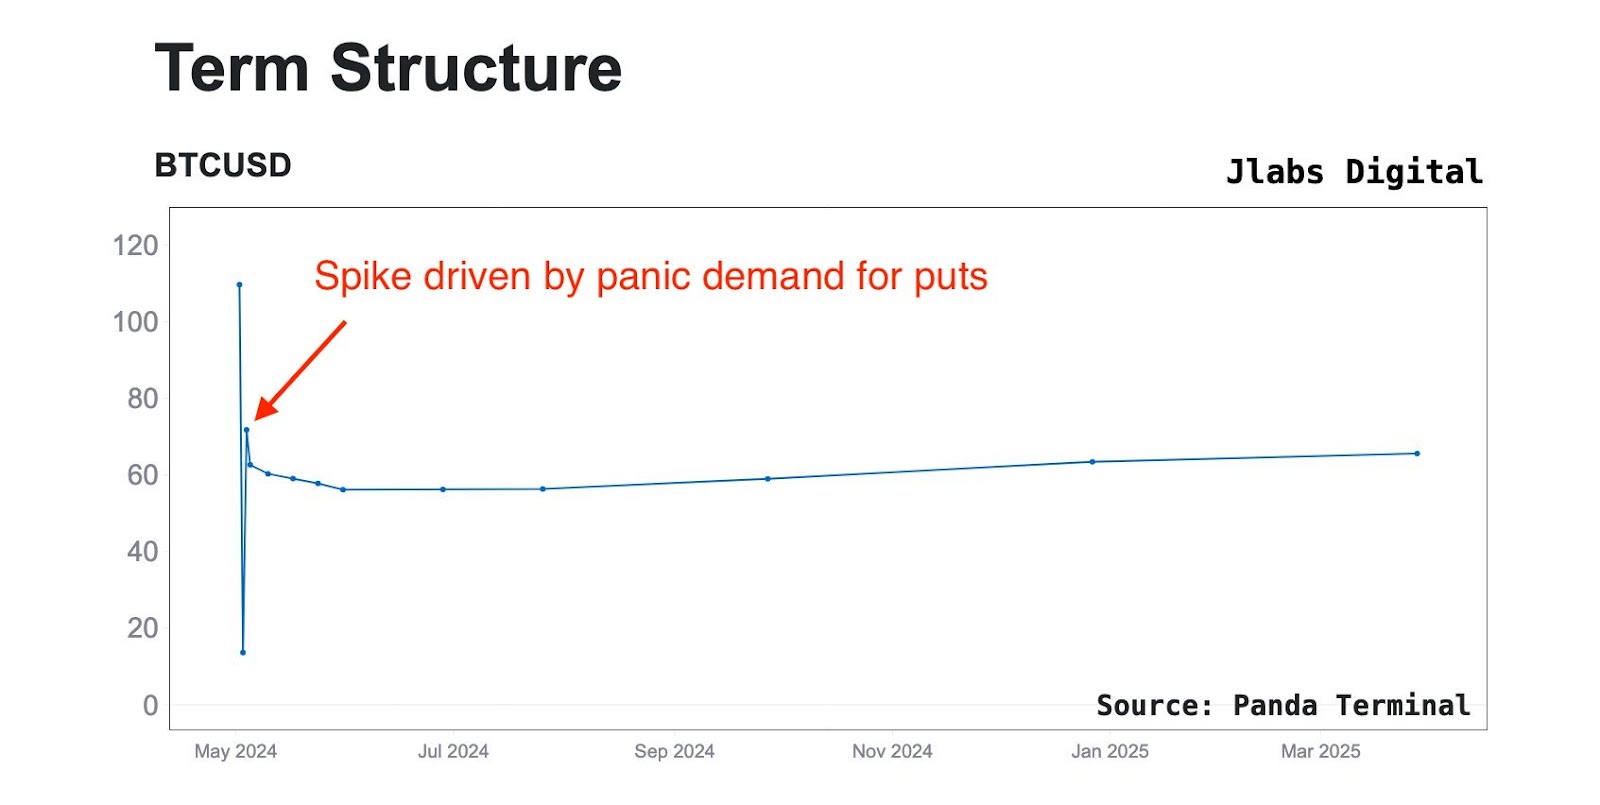
As a result of this rushed demand for short dated put options, there was a spike in IV term structure chart for the May 10th expiry. It was trading at an IV of nearly 60 in the aftermath, while the rest of the expiries along the curve were trading at a discount.
In the days since, and following the recovery back above $60,000, this spike was pulled back down through options sellers and the term structure chart has since normalized into an upward slope for the remainder of 2024. You can see that in the chart below.
This is opposed to the inversion we had been witnessing before the squeeze.
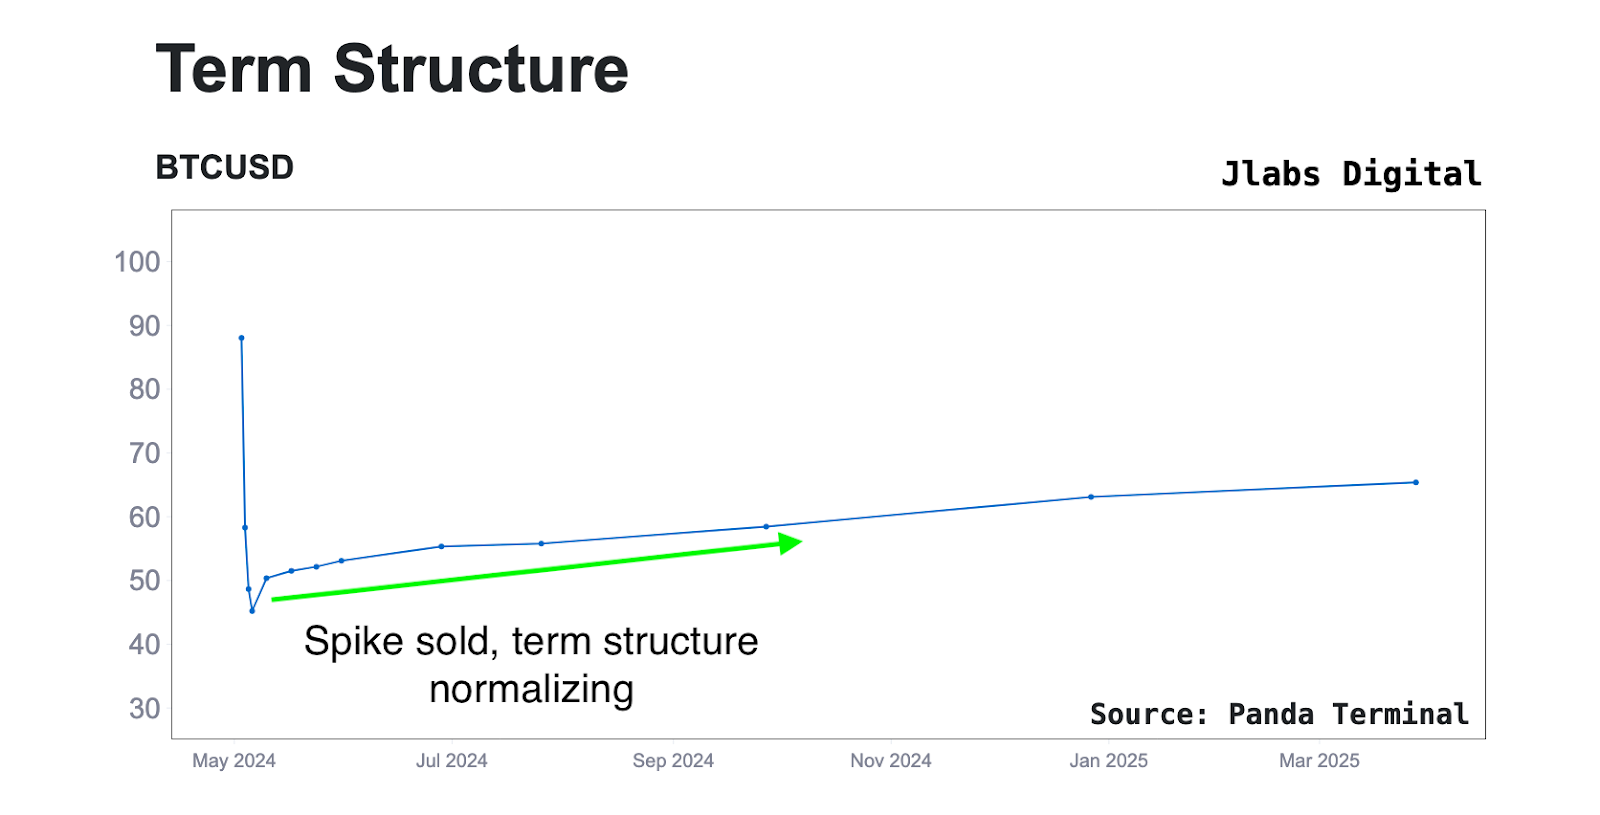
This upward slope is an encouraging signal amidst a chaotic move that makes many feel more uncertain on future prices than ever before.
It was a much needed reset after February amd March’s explosive upside move.
If last Tuesday’s sell-off was in fact the bottom, we would be entering into a period of consolidation on BTC between the 50-day MA resistance (currently at $66,100) and 100-day MA support (currently at $59,900) for at least the first half of May.
If these levels hold for the next few weeks, this compression in volatility will make long dated call exposure for the second half of this year contracts worth viewing. That’s because call premiums have dropped considerably over the past month.
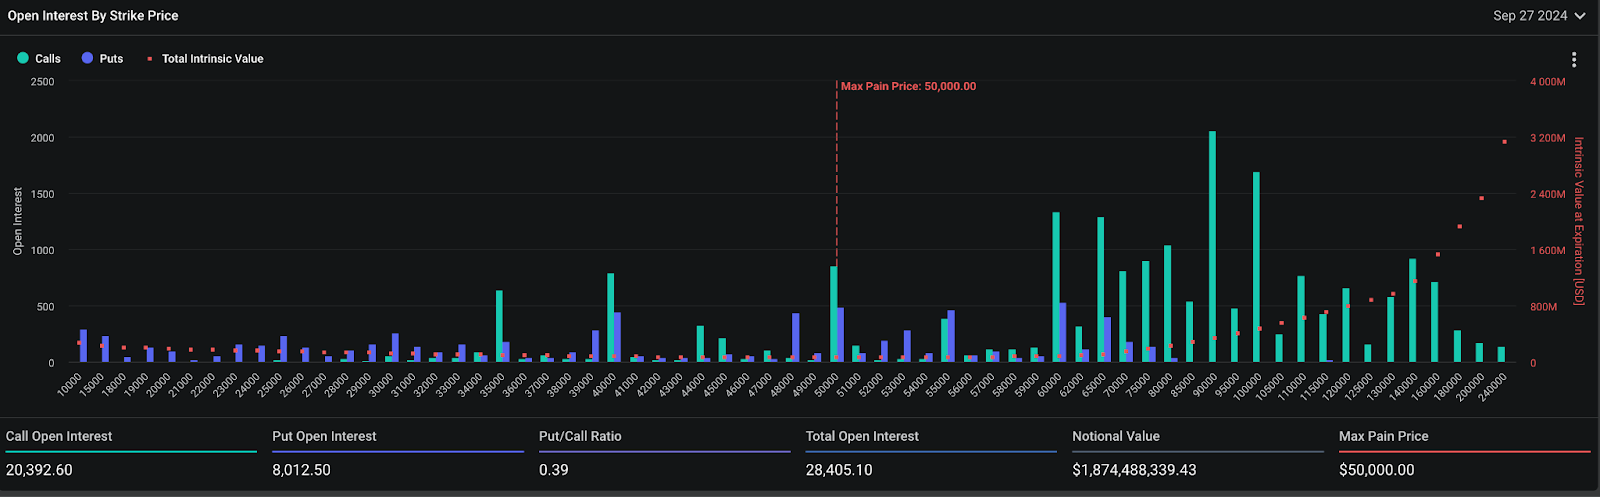
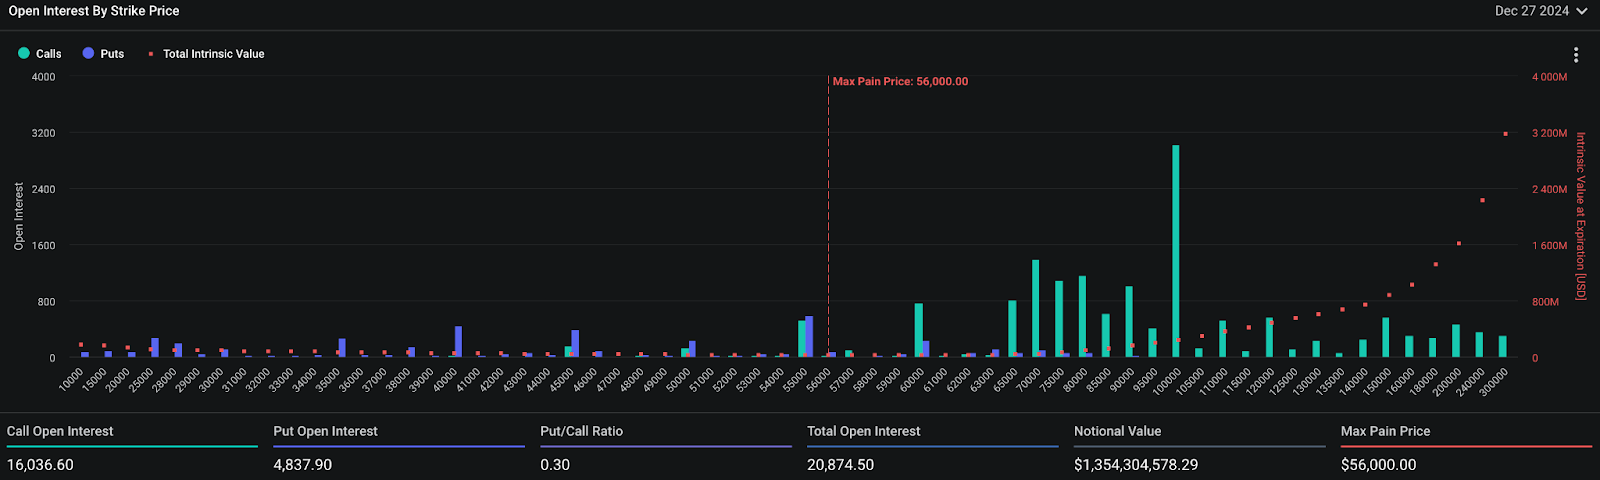
If we take a look at the end of September and December 2024 expiries below we see some large bets have already been placed in this direction.
They have over $1.8 billion (September) and $1.3 billion worth of notional open interest (December) respectively, despite them being many months away from expiration.
Most popular among the September strikes this week were the $60,000 and $65,000 call options:
The $70,000 and $100,000 December calls also saw considerable volume:
Keep an eye on these in the weeks to come, if price can find a higher floor throughout May, the next upside expansion to all-time highs could happen rapidly from there and you’ll want to have some far out exposure trade around if that happens.
That’s all for me this week, as a reminder tune in to The Trading Pit every Tuesday and Thursday where we’ll be unpacking this price action as it develops, as well as the next video in our options education series dropping next Wednesday. There I’ll show you how to use options to time the top of this next cycle without needing to perfectly time it.
Until then….watching the tape,
JJ


