Shanghai Shakeout
Notes From the Lab: Analyzing ETH’s Technicals and On-Chain Data Going Into Shanghai

Thirty-three-and-a-half billion dollars is about to come into the crypto market.
I’m not talking about some new fund from some venture capital firm. Nor am I talking about another country following El Salvador’s lead and making Bitcoin legal tender.
No, that amount actually represents the total value of Ethereum (ETH) supply that will be unlocking tomorrow following the Shanghai upgrade.
We see it below on the most important chart to watch this week.
What it shows is the total amount of Ethereum staked to the network since the ETH 2.0 Beacon chain went live in November of 2020, which was the beginning of the network’s shift from proof-of-work to proof-of-stake consensus.
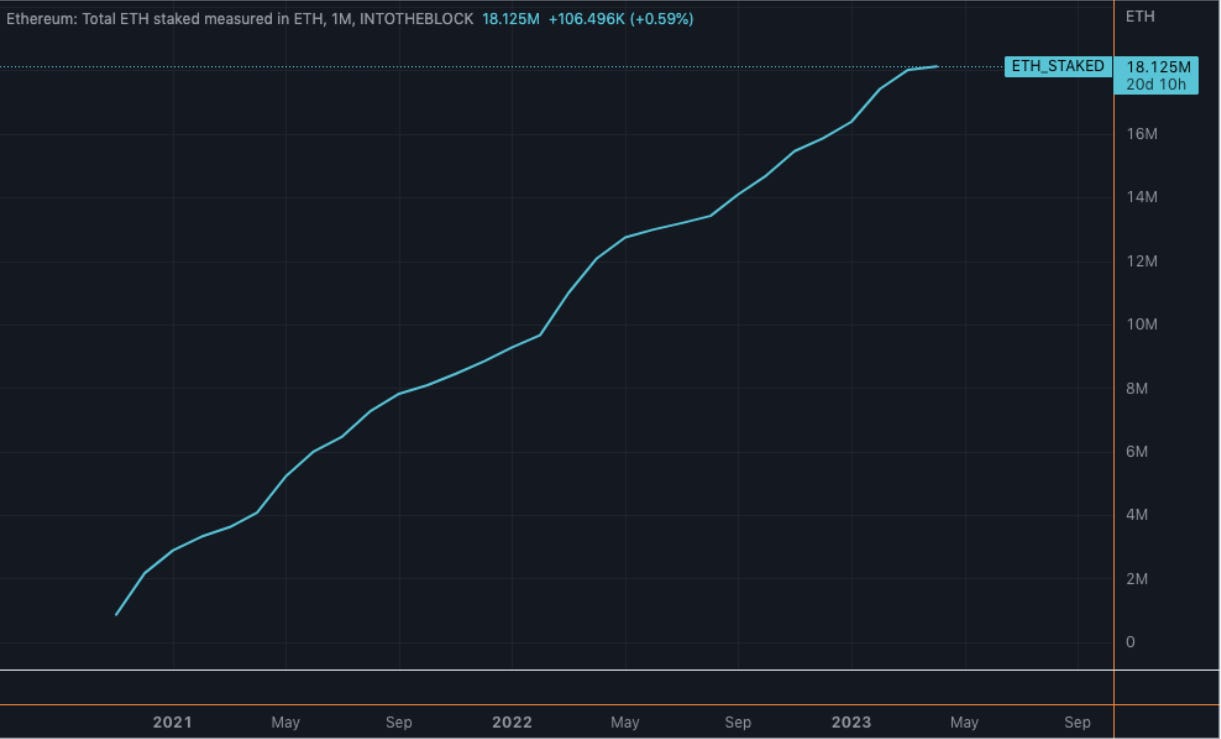
Currently, the total amount of ETH staked is 18.125 million (~$33.5 billion).
The reason this chart has only gone up since the launch of the Beacon chain is because prior to this week’s Shanghai upgrade, ETH staking has been a one-way street. Validators could stake their ETH, but once they did, there was no option for them to unstake and cash out.
This dynamic will change after tomorrow’s Shanghai upgrade, when stakers will then be free to keep their ETH staked, or withdraw it to sell or use as they see fit.
The knee-jerk reaction to this supply unlock is that it is extremely bearish. This is because increased supply ultimately translates to increased sell pressure.
And when viewed without any context, you might begin to worry that this massive influx of ETH supply is destined to trigger a vicious sell-off that sends us spiraling back down into the pits of the bear market.
Another failed escape from the rusty cage, just like Bruce Wayne in Bane’s prison pit.
But as always, my mission in these updates isn’t to deliver you the latest flavor-of-the-week Twitter narrative, be it FUD- or FOMO-inducing, but rather to present you with a levelheaded view of the objective story I see being told through data.
Which is exactly what we’ll be doing today as I unpack ETH’s current market structure, and explain why the Shanghai unlock is not as bearish a development as many have been led to believe.
Let’s begin.

Ben Lilly here. As you know, we want to take Espresso to the next level. To do so, we’ve explored bringing sponsors into our newsletter, but in a way that first and foremost benefits you, our readers. To that end, we aim to share introductory offers that give you an opportunity to trial new services, tools, or exchanges.
We are excited to announce our first sponsor, the trading platform ByBit. For those who have been looking for a new exchange, consider checking them out.
They operate in 160 countries. They have more than 270 assets trading on spot and over 200 perpetual and quarterly futures contracts. They even offer options contracts and NFT trading.
Simply put, ByBit has a lot to offer any trader. And right now, they are offering a $10 welcome bonus if you open a new account and complete some introductory tasks. They also have additional ways for you to earn. So if you are looking for a new platform to trade on, consider ByBit today by clicking here. Also, if you simply want to support Espresso and the Jarvis Labs team, consider giving a click.

Mojo Risin’
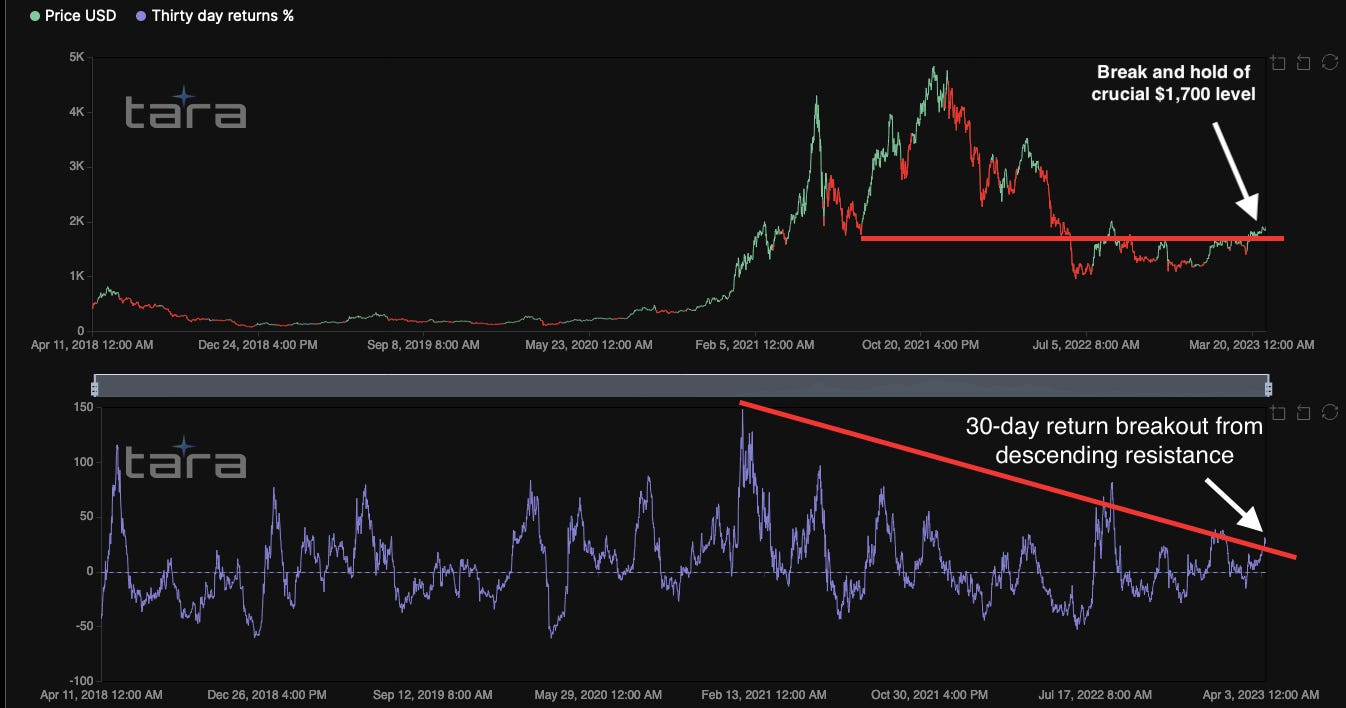
If you’ve been following along with us the past few months, you likely remember me mentioning the importance of ETH’s $1,700 level in November, then again in January.
In both those essays, I noted that a high-volume push over $1,700 would be crucial in determining ETH’s trajectory in 2023. Remember, trends tend to follow strong price movements fueled by high volume.
As we’ll see below, last month delivered exactly the resistance break we were looking for.
On this daily chart, we see it made a picture-perfect retest of support in March, which then quickly led to a breakout above resistance into the end of the month.
Unlocks be damned, this technical reading forecasts only clear skies ahead for the foreseeable future.
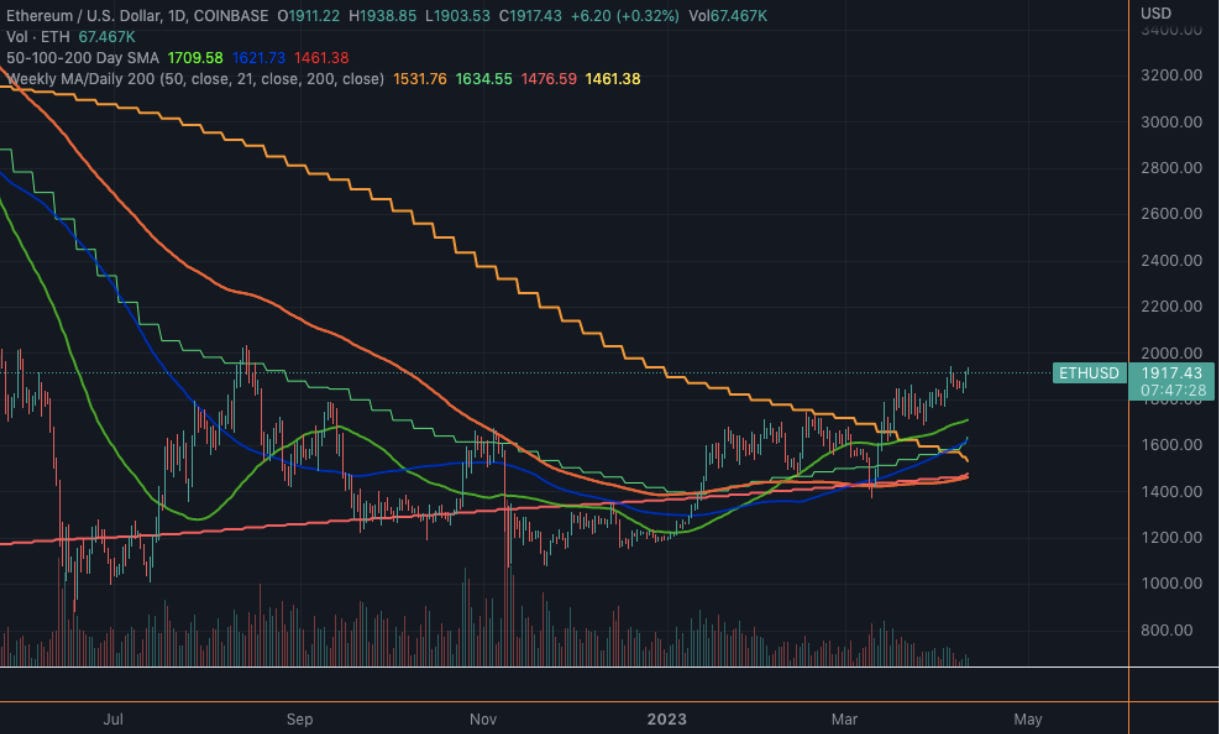
You can’t draw it up much better than that.
Now, could the initial wave of supply that Shanghai unlocks lead to March’s breakout being retested?
Of course it can! And you should have a plan for that scenario.
But don’t let short-term volatility cause you to miss the forest for the trees. March’s technical breakout was a big deal that won’t be easily undone.
It’s also worth noting some important nuances surrounding the Shanghai unlocks. For one, there are withdrawal limits that cap how much ETH can be unstaked per day, mitigating the immediate effect of sell pressure on price.
Plus, a large amount of selling is already priced into the market. Many stakers who need access to cash ASAP have already sold claims to their staked ETH over-the-counter, or hedged their long position with shorts via options and futures contracts.
For those reasons, I would be inclined to view narrative-driven dips back into that $1,700 range as an opportunity rather than the sudden end of 2023’s bull run.
A Shanghai Shakeout, if you will. Not unlike that of Bitcoin’s Golden Bull.
Plus, the on-chain confluence we’re seeing only strengthens our stance…
Whale Songs
Let’s lay out the bullish confluence we’re seeing on-chain by starting with our whale divergence chart.
This measures “whales” (wallet addresses holding more than 10,000 ETH) buying patterns versus the rest of the market, labeled as “fish” (wallet addresses holding less than 10,000 ETH).
Below, it shows that ETH whales found deep value in March’s dip to the $1,450–$1,550 range. (The red and orange dots indicate whales buying ETH, while the blue and green dots represent whales selling.)
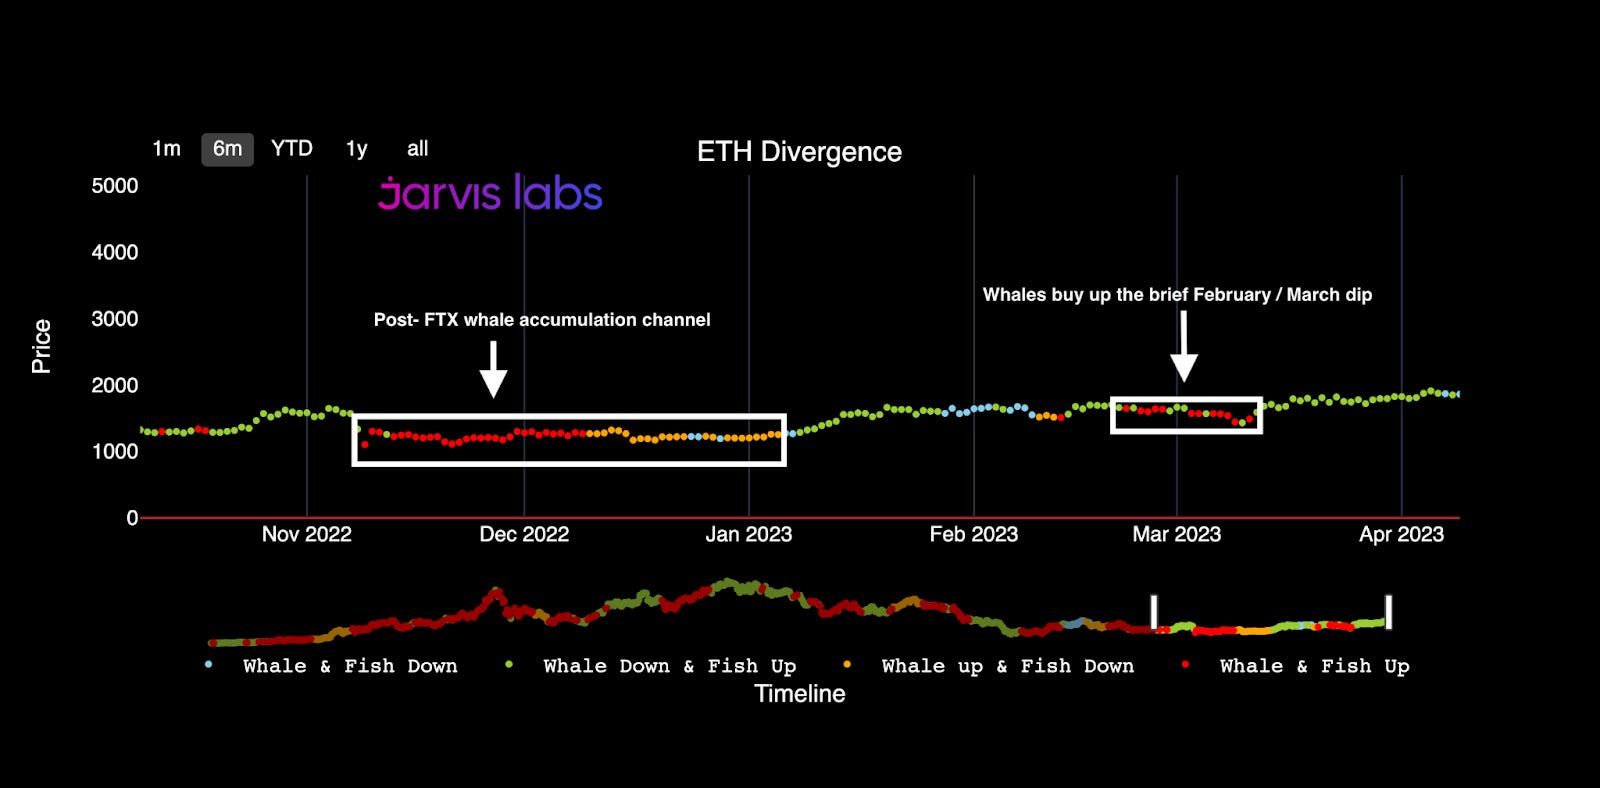
As we see, this was our first ETH whale sighting since they accumulated in the $1,000–$1,200 range post-FTX, a promising development.
Not coincidentally, March also brought an all-time high on our ETH exchange-whale ratio chart, another metric you may remember from January’s update.
In case you’re not familiar, this is one of our proprietary metrics (You can find it on our TARA dashboard.) It represents the supply owned by ETH’s largest whale wallets versus the ETH supply owned by crypto exchanges. The higher the ratio, the less ETH available to be sold on exchanges, which has historically led to much higher prices.
On the chart:
- Purple line = cumulative wallet balance of ETH’s top whales (currently ~25 million ETH)
- Green line = ETH price
- Tan line = cumulative ETH balance on top exchanges (currently ~7.5 million ETH)
- Red line = exchange-whale ratio (currently 3.3)
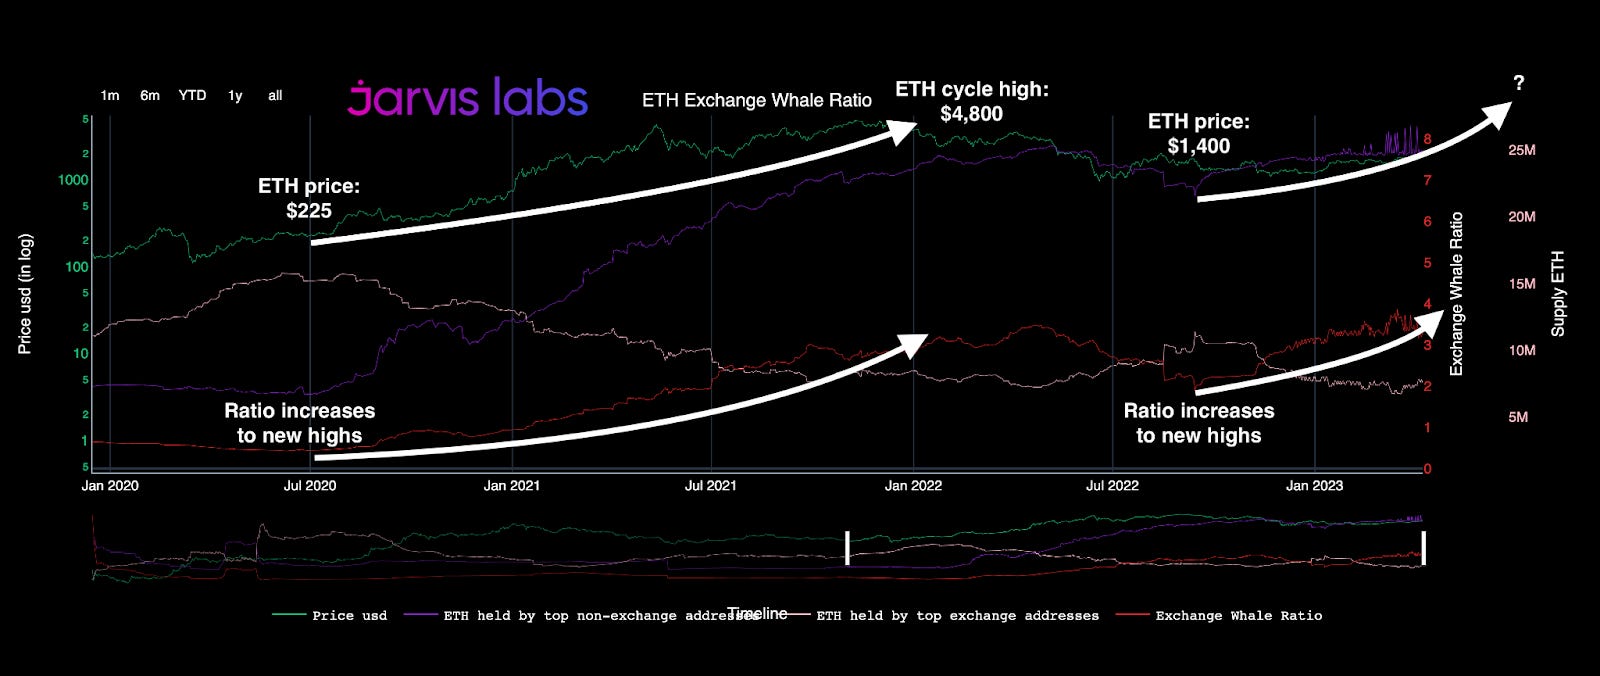
What’s notable about this ratio making all-time highs in March is that the last time we saw it break out was just prior to ETH’s last cycle of fundamental adoption, in the lead-up to the Beacon Chain launch.
From mid-2020 to late 2021, ETH whales drove up this ratio from under 0.5 to almost 3.5 in about 18 months.
Not coincidentally, this led to ETH’s price also entering a new bull market, as it rose by over 20x, from $225 to a cycle high near $4,800.
And there is additional symmetry between these two cycles. In the earlier run, DeFi summer airdrops led to increased network activity that fueled ETH’s rise.
Oddly enough, history is repeating itself in this regard as well, as the recent ARB airdrop has kicked off another wave of increased activity and FOMO.
Time is a flat circle.
This idea that we’re in the early stages of a new bull market rally, à la summer 2020, rather than the late stages of a bear market rally is supported in the final fractal we’ll be discussing today.
A key final piece of data that’s signaling this rally is on the verge of ripping much, much higher.
Thank you for reading Espresso. This post is public so feel free to share it.
Let the Good Times Roll
Finally, let’s take a look at a metric Mr. Benjamin Skew and I have been monitoring closely since July of last year when we published this thread together.
That metric is ETH’s 30-day returns, which reflect the amount of gain or loss one would have if they bought precisely 30 days prior.
Below, we see how the 30-day return trend (bottom graph) was stuck under resistance for two years, from mid-2018 until mid-2020. But once it broke through and regained that momentum, it coincided with price (top graph) shattering through the key resistance level at $400 without looking back.
Following that breakout, price then rose by 10x-plus, topping out over $4,300 just nine months later.
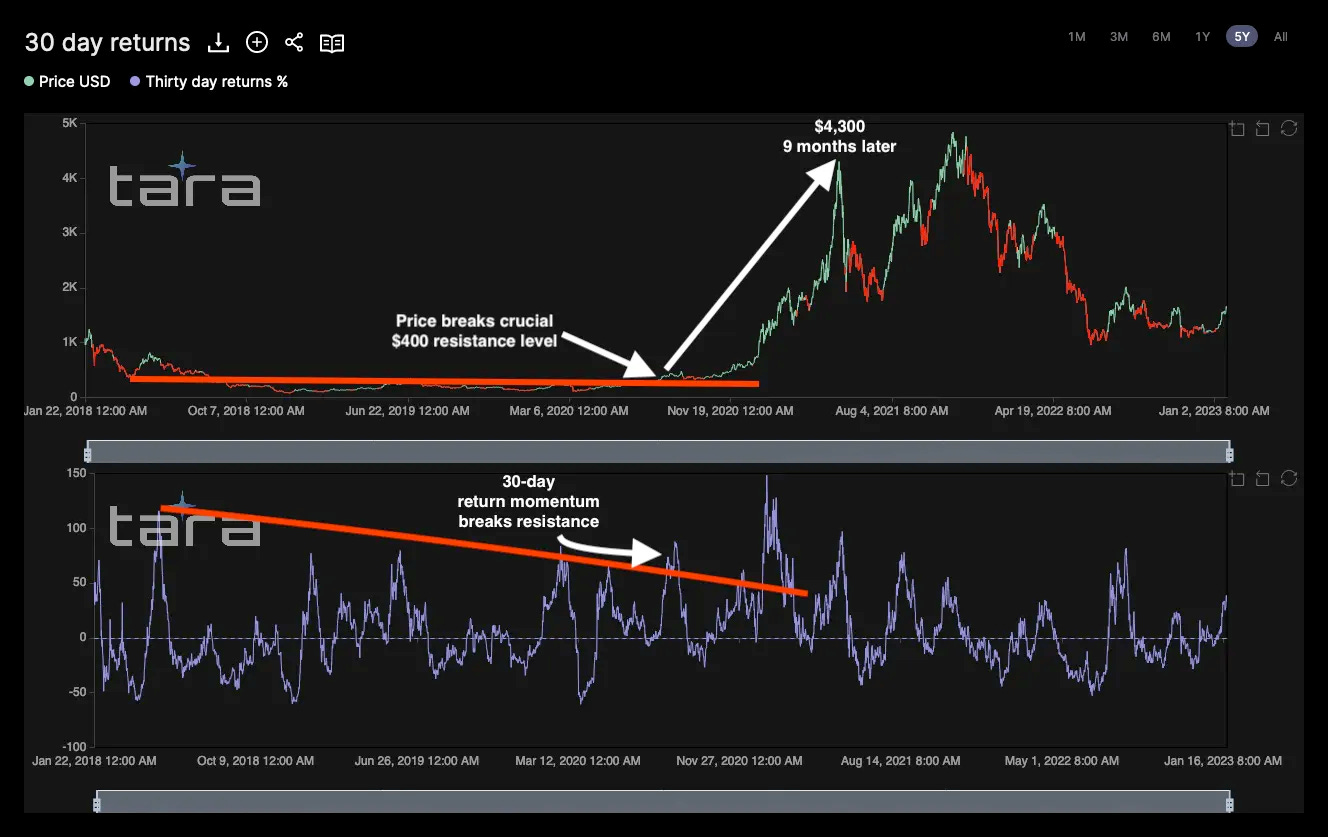
What’s interesting is that the current structure of these 30-day returns is remarkably similar to that fractal. And now both price and 30-day returns have once again broken above key resistance levels in unison.
If this breakout is real, rather than another summer 2022-style brief wick, we should expect 30-day returns and consequently ETH’s price to begin a cycle of rapid appreciation in the near future.
Now, does this mean we should expect 10x-plus returns within the next nine months again?
No, sadly.
But when you consider all the other data covered above, and the neutered dollar we’ve been discussing throughout 2023, what it does mean is that we have entered into a new regime where ETH boasts a confluence of bullishness in all aspects: fundamentals, technicals, and on-chain.
The perfect inverse of 2022’s market structure of doom and despair.
In other words:
Let the Good Times Roll.
Your friend,
This newsletter is sponsored by Bybit. Be sure to try out the exchange here, and take advantage of all they have to offer today.


