Scary Predictable
End of Week ChainPulse Update

The predictability is getting to the point where you start to second guessing yourself.
Price approached the $60k breakout, liquidity began to form a pool slightly lower as retail started to FOMO into long positions… This in turn caused funding rates to get a bit excessive… the sell walls at the breakout level never were lifted… And then retail ran out of ammo.
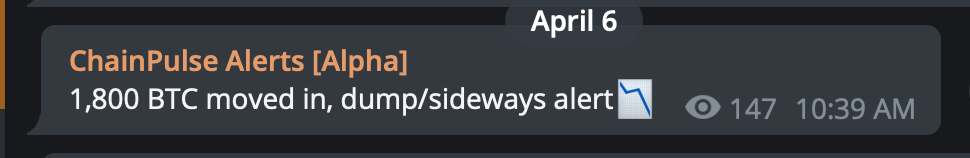
This exhaustion resulted in price trending lower. Then right on cue we got this signal when price was above $58k:
Then shortly after the dip we saw these transactions hit the blockchain:
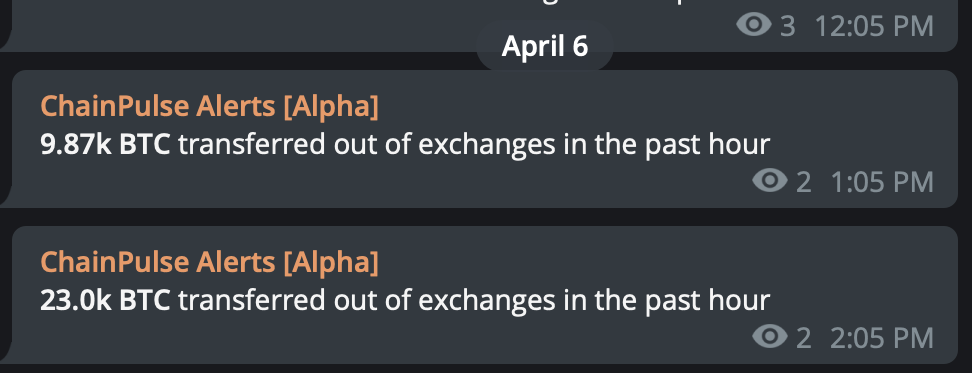
That’s the pool of liquidity we spoke about. These major BTC transactions were likely the result of The April 4th and April 6th dips. Whales were waiting and accumulating.
And then we saw it again on April 8th:
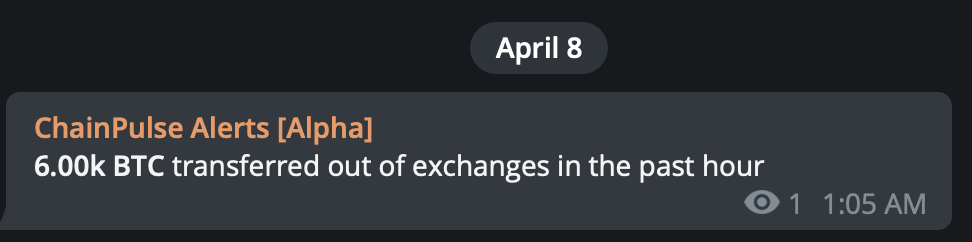
It is the type of thing where you know these things are happening, but rarely see the actual evidence. There’s the evidence. Whales are buying the dip. There’s heavy accumulation taking place.
There’s still the possibility of one more push lower, which is what our Chart of the Week alludes to. It’s still valid.
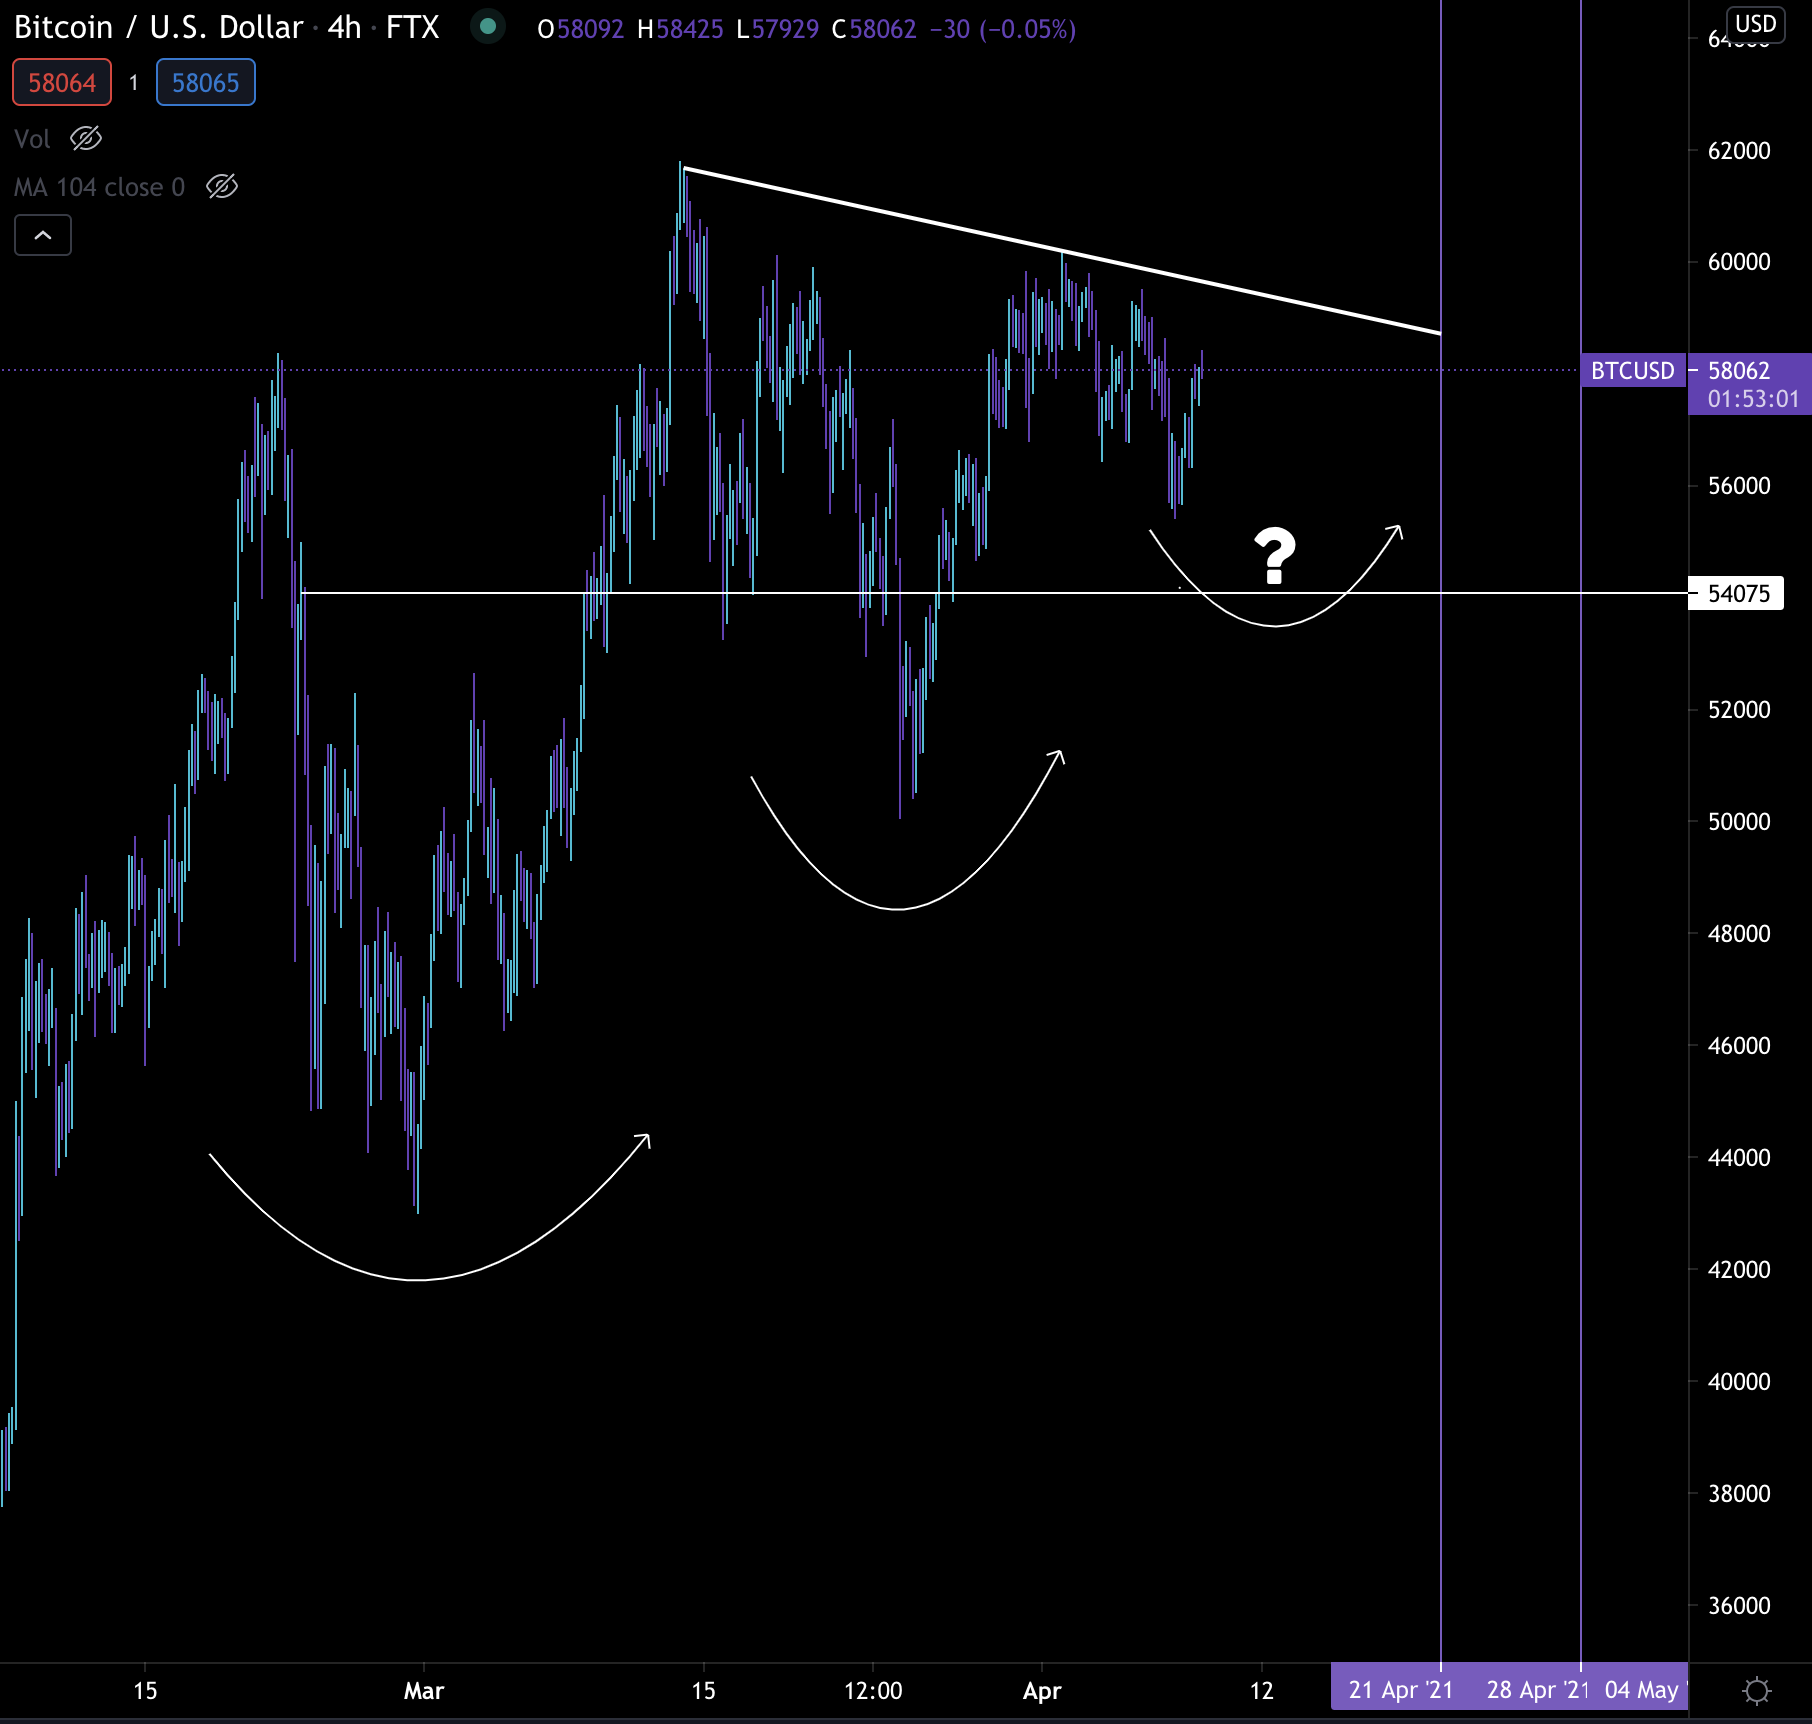
Now if we grind a bit lower or chop along for the next few days, then it’ll be one of the best moments to buy call options if you think this bull market is gearing up for another rally.
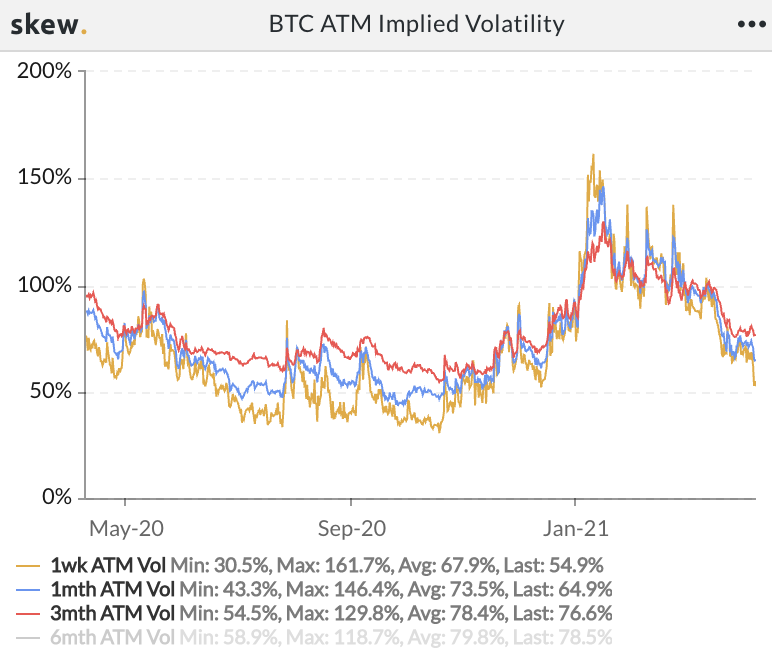
That’s because Implied Volatility (IV) is dropping. IV is a very important metric that influences the cost of the option. When volatility is high, IV is high, and also means options are expensive. When IV is low, options are cheaper.
As you can see in the chart below, IV for 1 week options dropped hard… options that expire one month from now (blue line) are starting to drop… And 3 month options will likely drop over the weekend.
These are close to yearly lows. Doesn’t get much better than this.
I’ll now pass the baton over to Benjamin with your End of Week ChainPulse update…
ChainPulse Update
Let’s run through the update today with some order. We’ll hit on funding rates, whale transactions, and then fuel in the market…
In terms of funding, markets cooled down after the bearish price action early this week.
It was much needed for altcoins as most of them had a large rally with funding rates getting rather excessive.
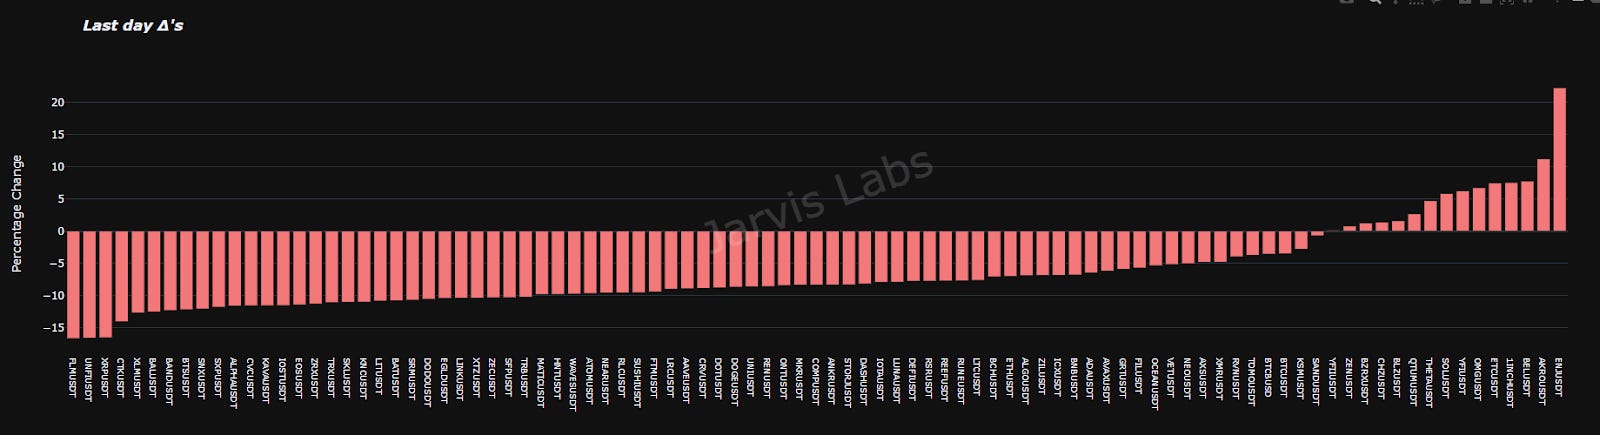
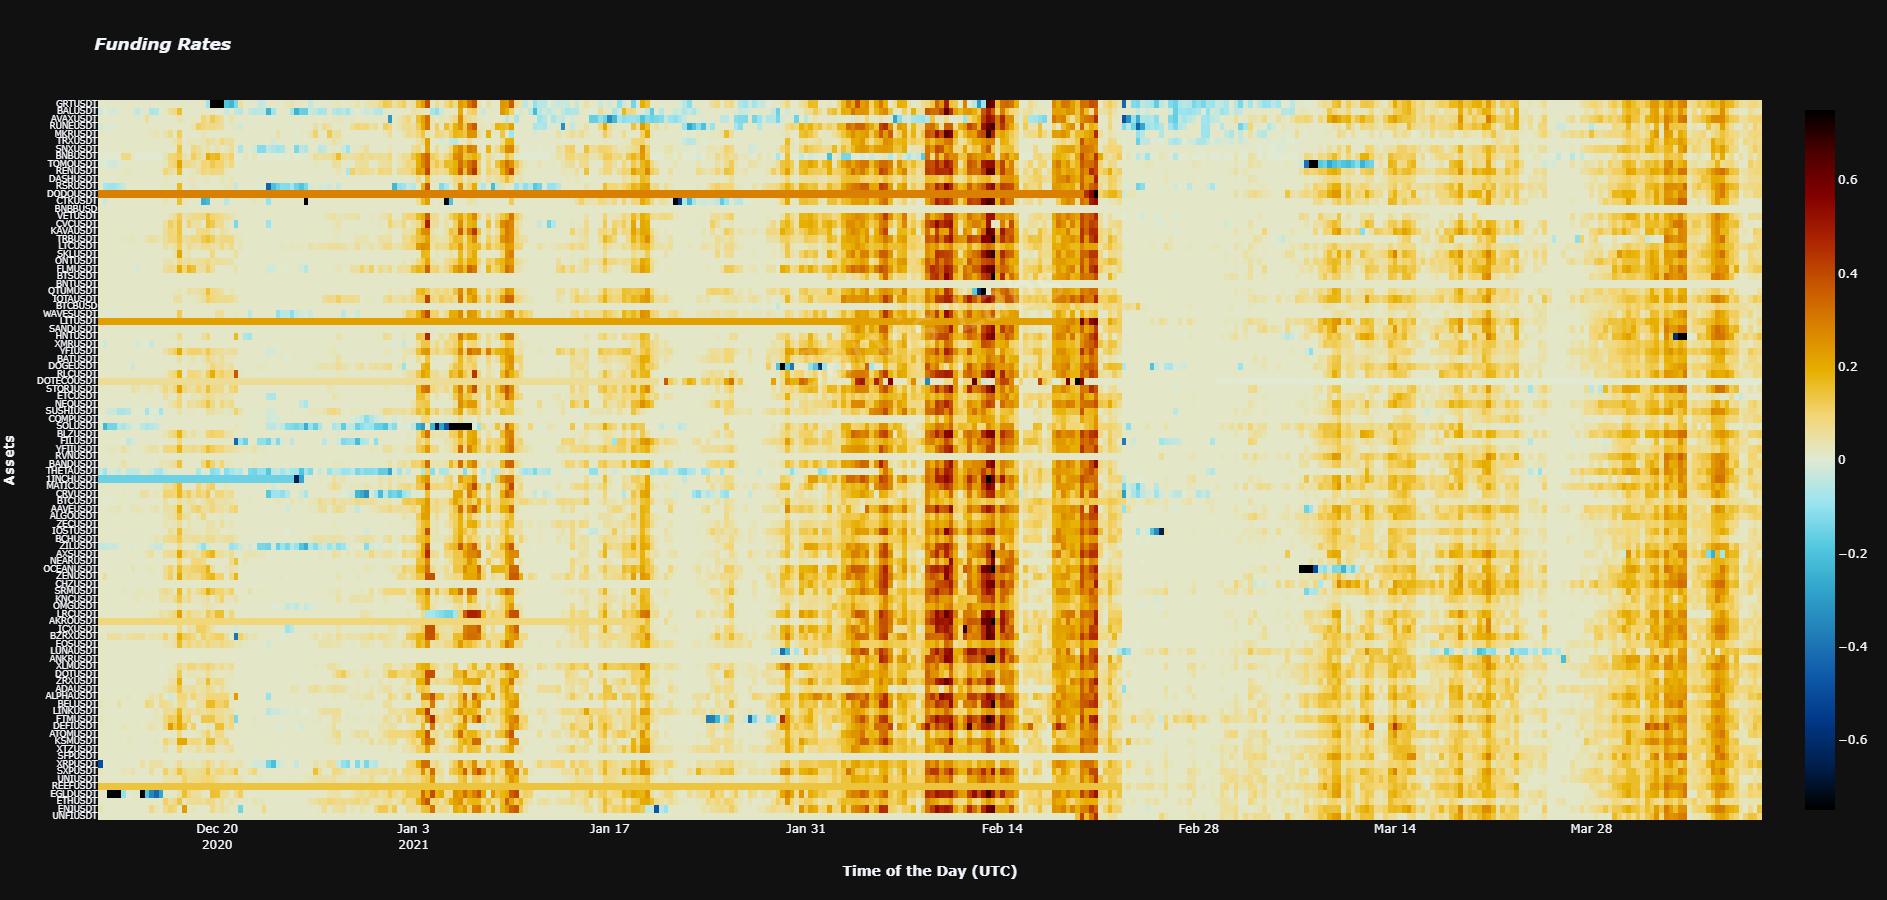
The correction left alts down nearly 20%. Since then most overleveraged positions exited and funding rates have returned to normal. The top chart is the percentage change in price over the last day, as you can see a lot were negative. And below you can see the funding rate heatmap. The more red, the more FOMO or higher funding rates.
Since Wednesday bitcoin found a local bottom slightly below 56k.
This is where we witnessed high whale transactional volume. Price literally reversed right on it. You can see that in the chart below. Blue dots is high transactional volume.
We call it the Feeding Grounds chart… we don’t love the name yet, so open to suggestions.
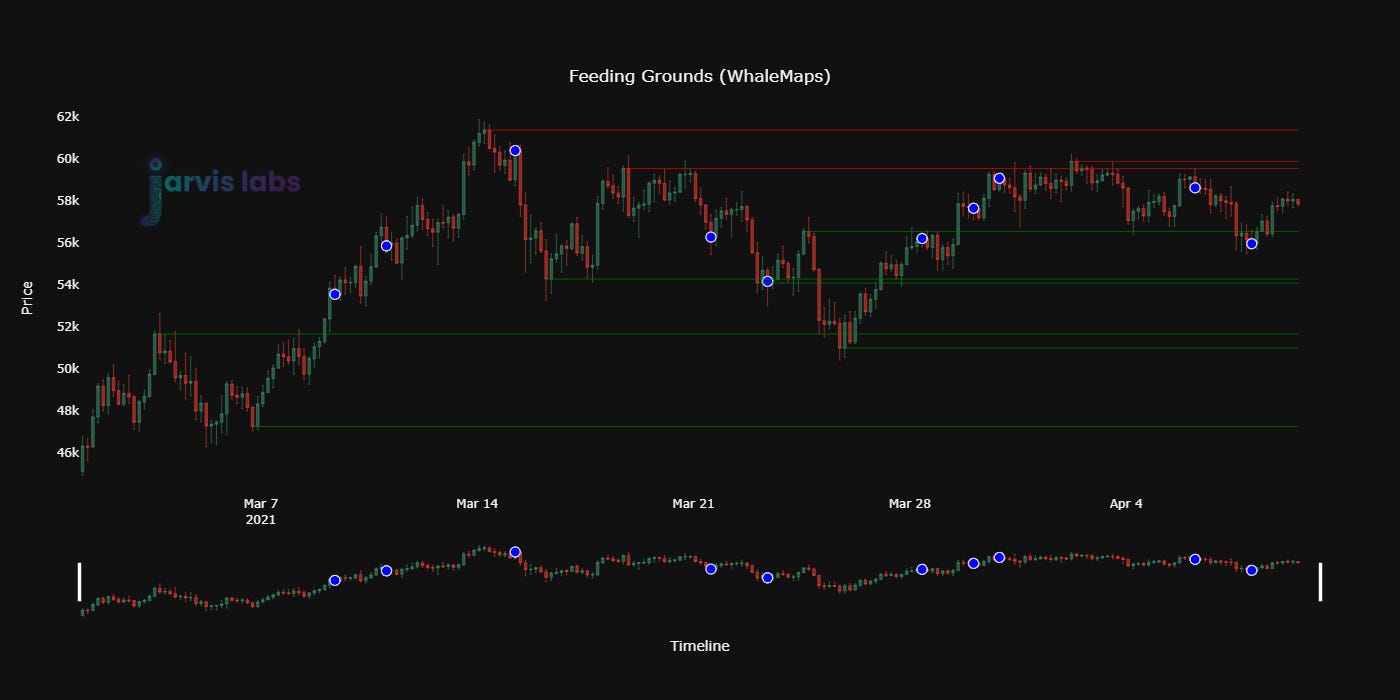
We’ll state it again, bitcoin has not necessarily found a bottom yet, still a lot of overhead resistance.
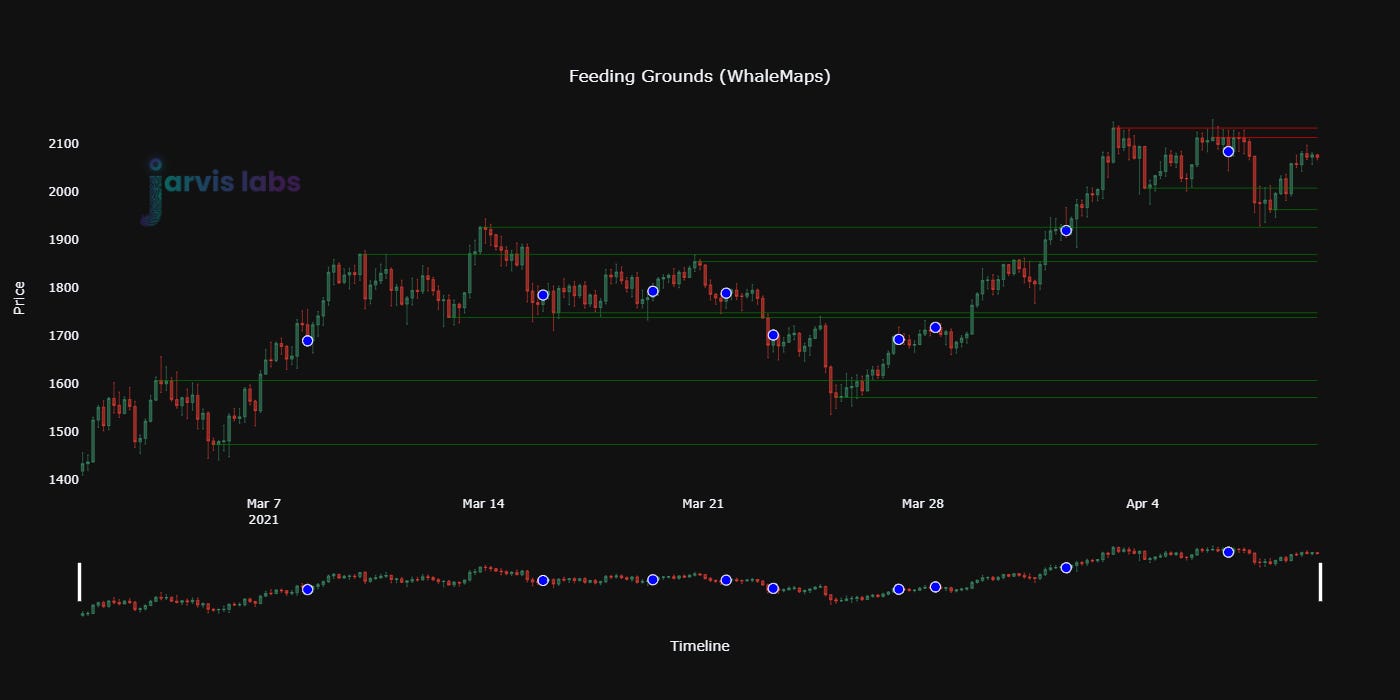
Ethereum on the other hand showed a much stronger bounce off its lows. There is incredible demand with various indicators supporting this. Similar to BTC, ETH has a lot of resistances before it rallies.
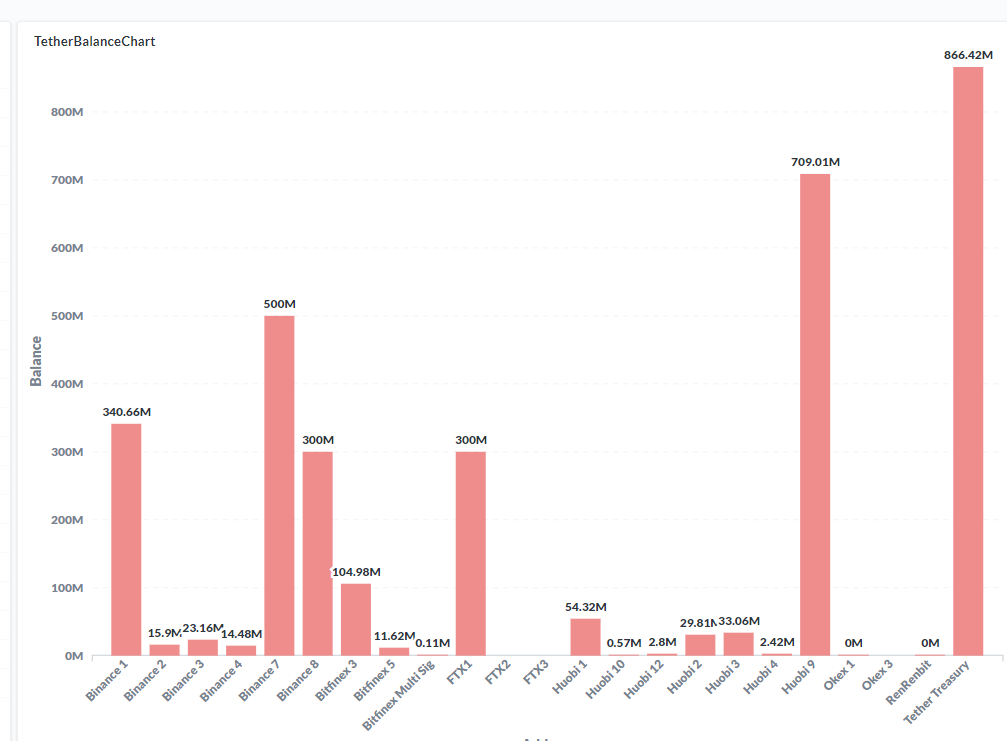
As far is the fuel in the market, it’s looking great.
Tether minted one billion dollars worth of USDt and loaded up their treasury. This is very bullish move and will likely be used for the forthcoming rally. Just a matter of time.
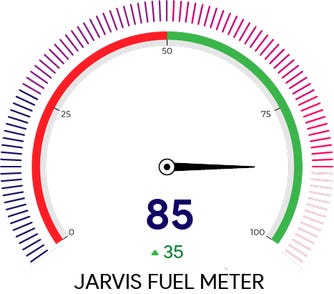
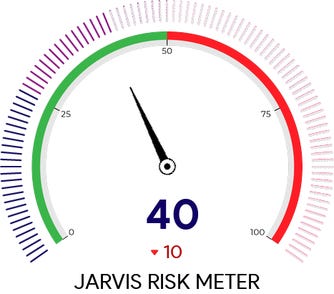
As a result of such major USDt, our fuel meter sits at 85 with our risk meter at a tame 40.
That’s it for today. Hopefully you’re armed and ready for the weekend no matter what the market brings us.
Your Pulse on Crypto,
Ben and Benjamin
P.S. - ICYMI, we unveiled the SxS Upgrade yesterday. It’s a mammoth upgrade to Jarvis AI. In yesterday’s article we unveil what all the charts are and how they work. You can read it here.


