Say Goodbye to the Bear
Notes From the Lab: The Trend-Changing Signal With a 100% Hit Rate


Drip.
Drip.
Drip.
The sweat poured off my forehead and onto my laptop as I contemplated making the biggest trade of my life.
It was a hot afternoon in late August, Bitcoin (BTC) was up more than 30% from its June lows, and I was feeling the flow of FOMO overtake me…so much so, that I nearly sold off my prized comic book collection in order to go all in on BTC around $21,000.
You might remember this story from “Almost a Bad Decision,” where I explained how compelling BTC looked at the time, due to a key ratio (more on this below) reaching all-time lows.
Thankfully, after further analysis, cooler heads prevailed, and I realized the value of patience. In the end, I concluded that despite this metric bottoming out, that alone was not an indication that the bear market was over.
Just a few months later, the FTX scandal rocked crypto. And since I decided not to pull the trigger in August, BTC’s fallen nearly 25% below my planned entry point and currently sits around $16,500.
It was another classic example of how emotions and narratives, if left unchecked, betray us.
Narratives can turn even the best traders from objective money managers into subjective prisoners of the moment. Instead of making analytical, data-driven decisions, their trades become rash and impulsive.
This is perhaps the most important thing I’ve learned during my time at Jarvis Labs. Objective data is the only way to overcome the many traps and fallacies of narrative-based investing.
Outsized rewards flow to those who exercise the discipline required to follow data-driven systems when market emotions are at all-time highs…like they are today.
Despite Sam Bankman-Fried getting arrested, we’re still dealing with the fallout of FTX as numerous entities go belly-up or announce layoffs. There are even rumors that Binance is on shaky ground. People are afraid this bear market will never end.
With that in mind, today let’s revisit this important metric and see how its latest signal, which has a 100% hit rate, is shouting that the bear market is about to be over.
Despite what the headlines and armchair analysts may be leading you to believe…
Reshuffling the Deck
First, a quick refresher on MVRV difference, the metric we looked at in August.
MVRV is the ratio of Bitcoin’s market value (MV) versus its realized value (RV).
MV tells us what the entire market’s average cost basis is. RV tells us how much those coins were worth when last transacted.
The difference between these two prices tells us what percentage profit or loss the average Bitcoin transaction is currently realizing.
For example, let’s say somebody purchased BTC at its all-time high of $69,000 last year. And they didn’t move those coins until today, when they sold them.
Their RV, or cost basis, would be $69,000.
And their MV would be the price of BTC at the time of the transaction in which they sold it. Today, that is $16,500.
The difference between $69,000 (RV) and $16,500 (MV) is roughly minus-77%.
This would give those coins a MVRV difference score of minus-0.77.
The formula we use to calculate the MVRV is just like that with a slight twist that gives us more insight into the market. We call it the “MVRV difference” indicator, and you can find it on our TARA NFT dashboard.
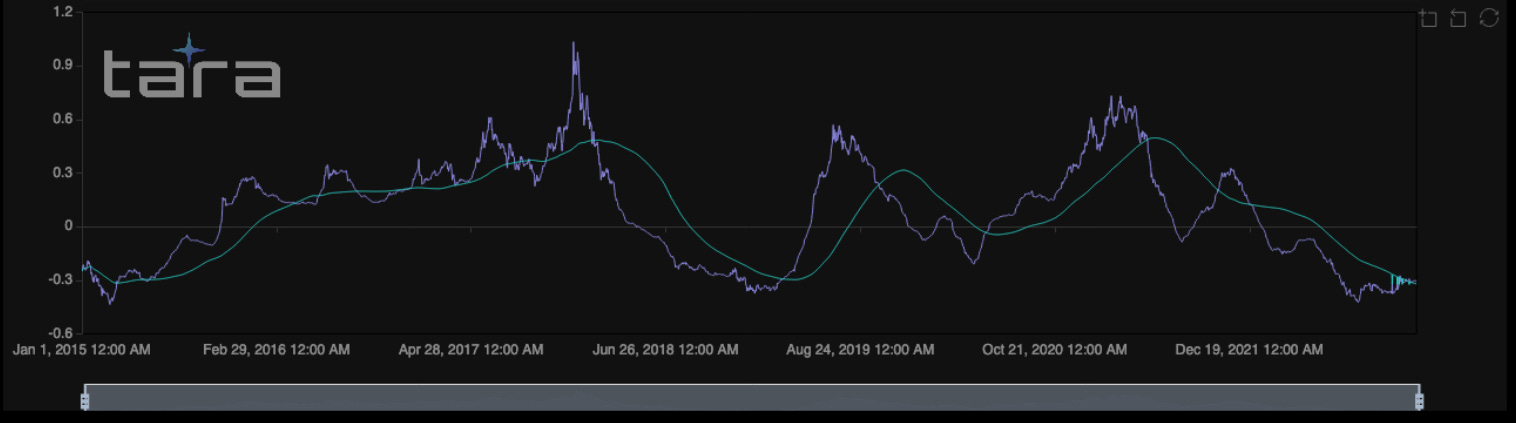
For example, the purple line on the chart below (we’ll explain what the green ribbon means in the next section) shows us our calculation of the market’s average MVRV difference score since 2015.
Currently, it sits around minus-0.31. This means on average, the market’s BTC cost basis is about $24,000 ($24,000 - 31% = today’s price of $16,500).
In August, the MVRV difference was minus-0.41, and Bitcoin’s price was roughly $24,000. Which means the average cost basis then was about $42,000.
This ratio rising while price falls, tells us that most, if not all, of those underwater longs from the $40,000-$50,000 range have since capitulated.
Supply has moved from weak-handed speculators who prematurely bought the dip, to more disciplined buyers who waited patiently to buy below $20,000. This transfer in turn lowered the entire network’s average cost basis.
A reshuffling of the deck, if you will.
And what you may not have noticed at first glance is that the MVRV difference has just recently broken past the green ribbon we mentioned above. This ribbon represents our MVRV’s 200-day moving average (MA), a crucial resistance it's been trapped below since 2021.
In a market full of noise, this development is pure signal.
The MVRV difference breaking above or below the 200-day MA has had a 100% success rate in predicting major market shifts dating all the way back to 2015.
And to prove that statement isn’t hyperbolic hopium, let’s take a look at the results of our backtesting.
Pure Signal
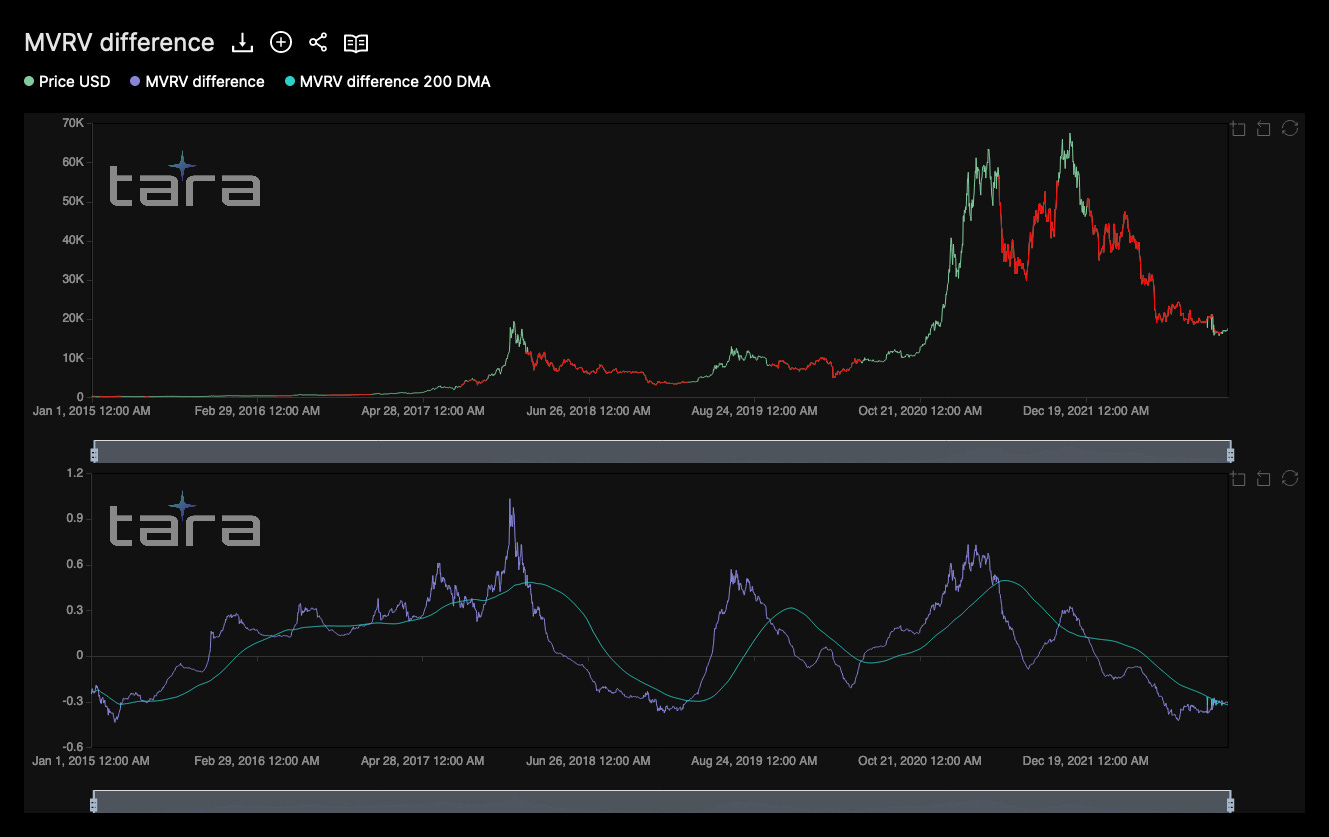
Below, we see the full power of the MVRV difference’s alpha on display, by juxtaposing it against a price chart of BTC.
No Bitcoin market, bear or bull, has ever changed its trend without this metric warning us weeks in advance.
In the top chart, green lines reflect MVRV above the 200-day MA.
Red lines reflect MVRV below the 200-day MA.
If you ignored all other forms of analysis and focused only on this macro indicator alone, you could have moved to cash in December 2021, when BTC was near $50,000, and stayed there until…earlier this month.
After taking a look at the chart above, I knew we had to dig a bit deeper to underscore the value of MVRV’s ability to catch trend changes early, so I showed it to Jarvis’ head quant, Mr. Benjamin.
He and his quant team are super talented at finding insights from data in ways this simpleminded janitor can hardly comprehend.
You’ll see what I mean when viewing the results of their backtest below.
Buying BTC when MVRV moves above the 200-day MA and selling when it moves below has generated cumulative returns 400% higher (blue line labeled “Strategy”) than passively holding BTC (yellow line labeled “Benchmark”), and requires only half the amount of time in market.
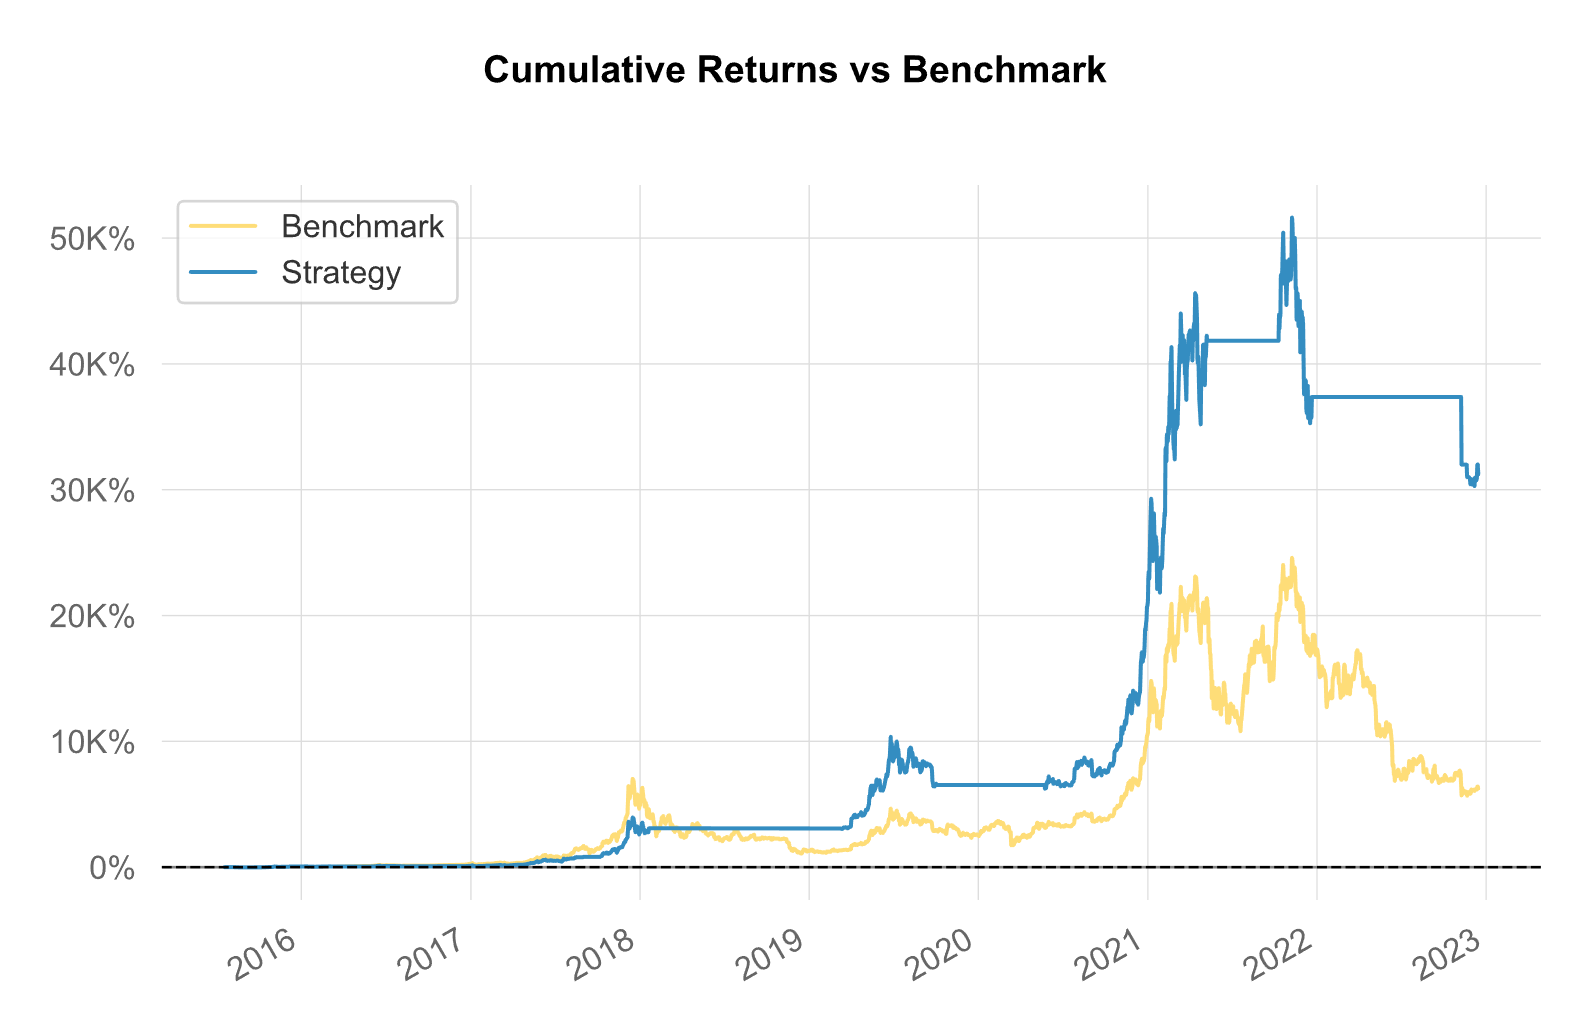
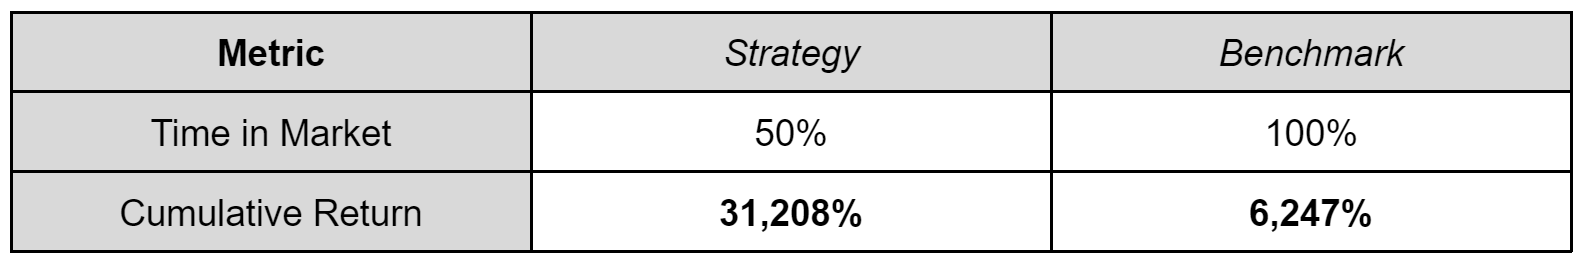
This means that if Person A bought Bitcoin only when MVRV moved above the 200-day MA, and sold only when it was below, they would have 5x the gains of Person B who simply bought and held Bitcoin.
Person A would also only need exposure 50% of the time (during MVRV bull markets), as opposed to Person B who would be exposed to market volatility 100% of the time.
Following this simple system allows Person A to not only catch trend changes early and multiply their returns, but also saves them from the stress and opportunity cost inherent in having capital invested during bear markets.
I don’t know about you, but experiencing all of Bitcoin’s bull market rewards with none of its bear market anguish sounds like a pretty sweet deal to me.
Following this simple trading system would also have Person A in a long BTC position currently.
For as much as analysts love to think out loud and obfuscate things with complex narratives, oftentimes the truth is much less complex.
It’s just a matter of rewiring our brains to rely more on objective data, such as the MVRV difference, and less on flavor-of-the-week opinions about what “should” happen to prices based on unknown outcomes of future events.
This sort of practical approach to markets is the only way to put turbulent times like these into perspective. It allows us to spot opportunities where the overly emotional see only chaos.
Be Like Water
All that said, there are never any guarantees, only probabilities along a wide spectrum of possible outcomes.
The market tends to humble those too proud to admit this with stunning efficiency.
So while this signal has had a 100% hit rate in the past, there remain possible outcomes where this time is indeed different, and prices instead sink further.
And with so much uncertainty still lingering around potential bankruptcies, exchange reserves, punitive regulations, and unknown unknowns, it’s not hard to envision scenarios where Bitcoin’s price faces deeper pain in the near future.
For all we know, MVRV could fall back below its 200-day MA by tomorrow and this trade will be invalidated.
That is why it’s important for us to “be like water” and update our market biases daily to ensure we’re in sync with data rather than emotions.
The ability to do this without hesitation is a superpower. An antidote to the cognitive dissonance that turns markets into echo chambers during times of extreme sentiment.
And it’s exactly why our TARA dashboard and quant team exist. Data is the tool we use to avoid falling victim to narrative fallacies, and ensure our views on risk versus reward are properly calibrated at all times.
With that in mind, next time I’ll be sharing further backtesting results of trade strategies using MVRV. And we’ll see how this indicator can be used to achieve equally stellar gains in an even shorter amount of time.
Be sure you’re subscribed! (Likes and shares are always appreciated as well.) I don’t think you’ll want to miss this one.
And until then, be like water, my friends.
Yours truly,
JJ
On Twitter @JLabsJanitor


