Rogue Wave
Market Update: 4 Jan 2023

The National Oceanic and Atmosphere Association didn’t always believe these existed.
These waves that looked like literal walls of water.
They were more like myths from scruffy peglegged salty seadogs.
But after some time, the logic started to stack up...
Rogue waves are real.
The ocean has many different currents and swells happening simultaneously. Some are stronger than others. Most are from various winds blowing about the landless patch of Earth from pressure systems doing their thing.
This wildness and seemingly unpredictable mess means two or three of these currents can produce a wave that stacks atop one another… Forming a giant wave that feels like it comes out of nowhere.
Meaning it’s all about multiple waves of various amplitudes, lengths, and speed lining up at the same time for a brief moment.
For those that haven’t been out past the continental shelf and into the ocean above the deepest areas of the abyssal plains, it’s likely hard to fathom how such a rogue wave could be so sudden and so massive. But it’s there… And it’s not as random as it might seem.
Technology now exists to predict such things.
As for crypto, it had its own rogue wave surface in the markets seemingly out of nowhere.
For somebody surfing exchanges opening up cross-margin positions without a thought of hedging, the rogue selloff capsized your portfolio.
$468 million was wiped in terms of open interest as measured by True OI. You can see that below.
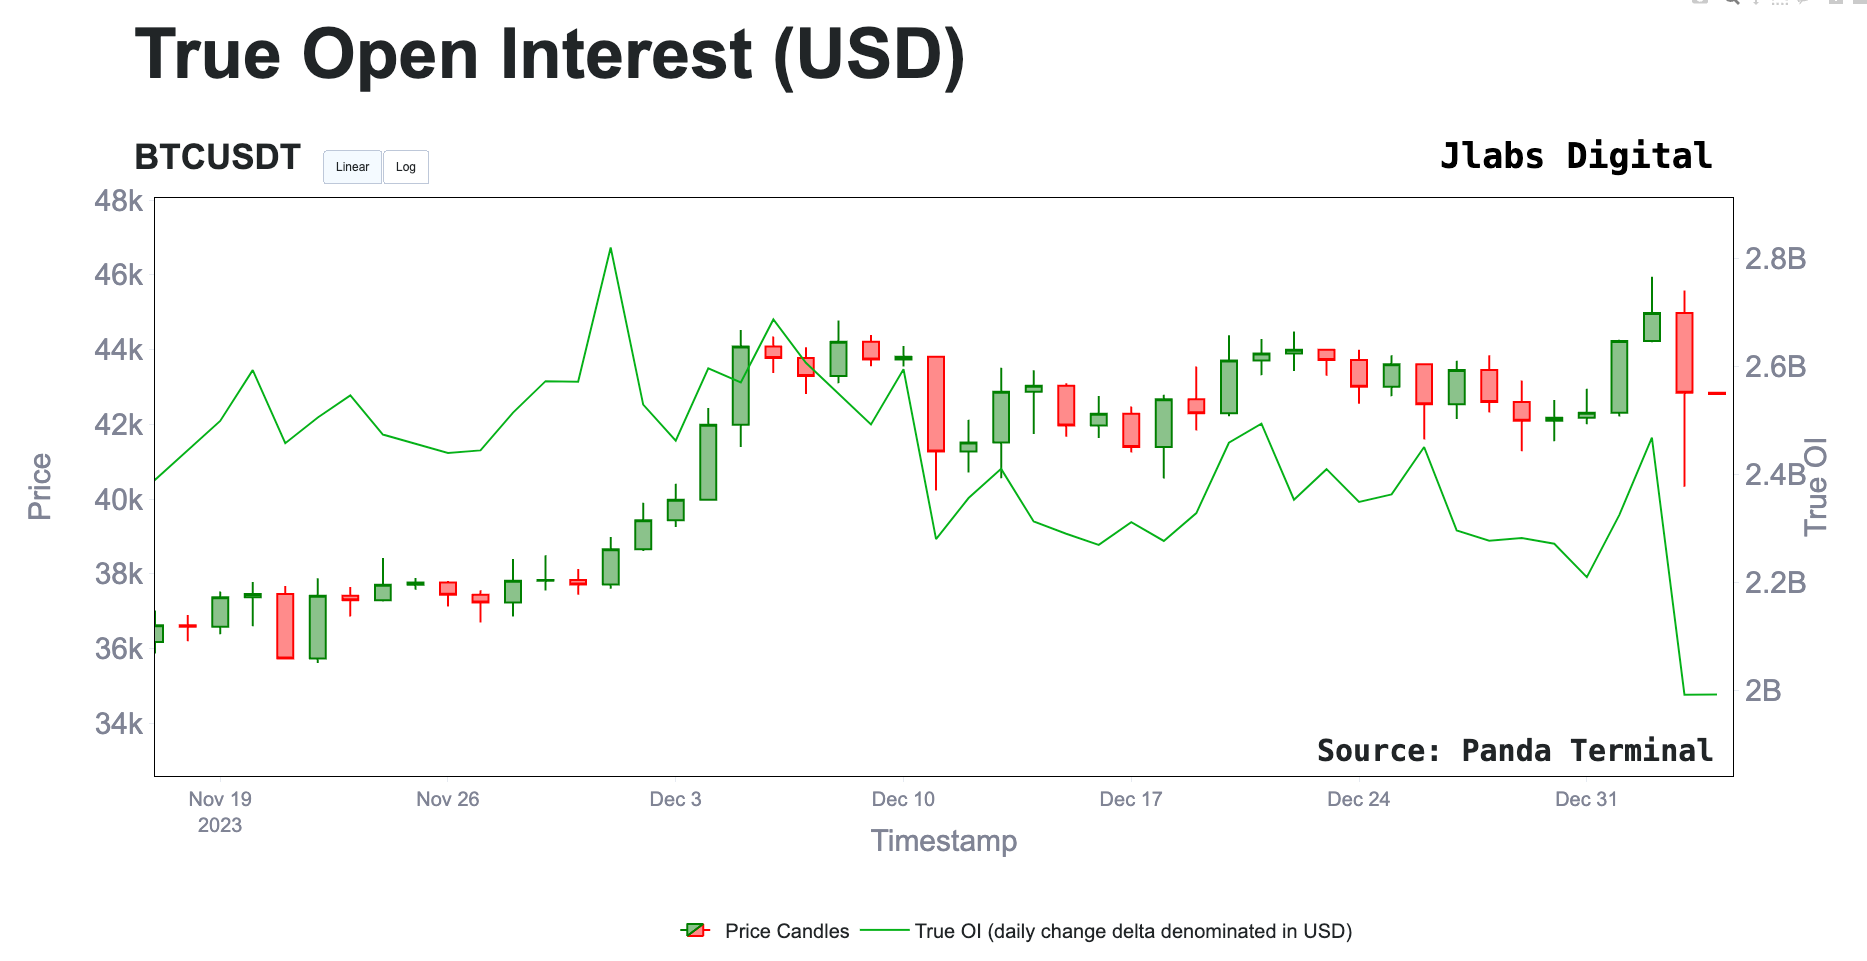
Traders on Hyperliquid, a place where we can see a leaderboard-like view into traders battling it out in the arena with transparency, you can see the carnage.
Most of them look like this…
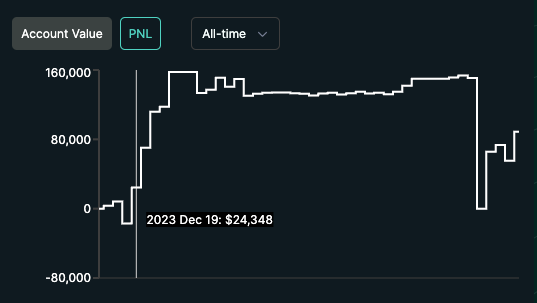
It’s a chart where we see that December was generous… And in the last 24hrs, it was given back.
Several vaults were over leveraged and are now down more than 60-70%…And what it tells me is that this was a rogue wave indeed.
The question then is… Was it possible to detect it and what does the landscape look like now? To answer that, I would like to first take a moment to explain what a detection system looks like on our end…
Signals
One thing I tend to realize quickly whenever talking to a new client or even subscriber of this newsletter right here is that nobody really knows who Jlabs Digital is.
We sort of like it that way. It means we can do our thing without too much distraction. But for those that are curious, we ingest trillions of data points, assess risk, find alpha, execute, and automate.
Seems simple enough.
But what people fail to realize is the scale at which we operate at when it comes to each item I mentioned.
If you want to skip this section and get into the charts / update, feel free… Just find the next chart or image below. But for those that are curious, read on…
Data - we are talking Big Data here. Not your typical CSV… But more like we want to run a calculation on some data, an analyst will estimate the cost before we say “=sum(wallets)”. Then there’s the work of how do you organize such truck loads of data as each block gets created.
I don’t think crypto truly appreciates just how much data gets created each day. Sure, the data is “open, transparent, permissionless”… But to analyze it, that’ll cost you. This creates a world of “haves” and “have nots” when it comes to computing such large datasets.
Assessing Risk - I truly believe most of crypto assesses risk based upon a gut feeling. Understanding how to minimize risk on entry, hedge a portfolio, what change in metric results in your position being invalidated… Let alone what is the death spiral rate of an improperly balanced DeFi swap pool based upon its transaction volume.
Designing algorithms is not just about generating a “buy” signal… It’s about knowing each step of the process - signal hit rate, entry and sizing method, invalidation method, exit method, hedging, and more.
Find Alpha - This is probably the easier part of our work. We are constantly designing new metrics and proof-of-concepts to find opportunities. In such an expansive market with arbitrage and dislocations at every turn, the hard part isn’t the signal… It’s how to act on it with success. Which is about the next part…
Execution - When you’re on Tradingview and hook up your account to place an order, how many seconds does it take for that order to hit the books? It takes two hands to count that high.
What type of order is placed? Market order, limit order, DCA, ladder entry… And is it responsive to changes in the orderbook or tradeflow? Most systems lack any real sophistication.
To give you an idea about the Jlabs team… The guys handling execution measure in milliseconds. And they already know what needs to be done to shave an additional 40 to 200 milliseconds based upon their proposals.
Code efficiency, order calculation and creation, server locations, fail systems, monitoring… It’s impressive what they do in order to steer clear of any rogue wave.
Autonomous - When you look back on the data being computed and how its acted upon, the software needs to be more robust than a few algorithms. That’s J-AI, a trading system that is coming up on its sixth birthday.
I mention all of this to give some background and context for this next part… It takes a lot of resources to come up with what seems like a simple alert like this…
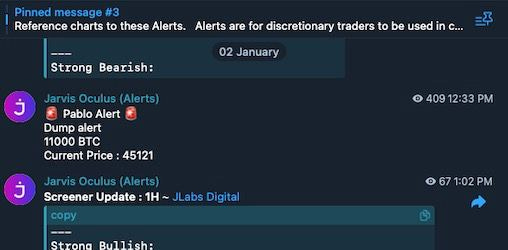
While many look at such an alert and think to short it, we tend to view it as risk. That risk being the rogue wave that can form seemingly out of nowhere.
Hopefully that helps address any questions you might have, similar to what Vladyslav here asked.

You won’t find this on whale alerts. Most traders that you can copy trade onchain know they show up on those alert systems. They’ve gone out of their way to avoid detection. But what’s true about most of them…
They tend to be one signal of many… Or one wave of the many that are moving in the ocean.
For those that listened in on our Trading Pit episode the other day, we mentioned several metrics and data points were telling us that the market was weakening. You can listen in here if you missed it.
For this reason, the Pablo Alert was merely another wave getting ready to combine with other waves to form that major selloff in the market.
The U.S. dollar was one such signal.
Here’s the move in the U.S. dollar as measured by the DXY over the last couple days…
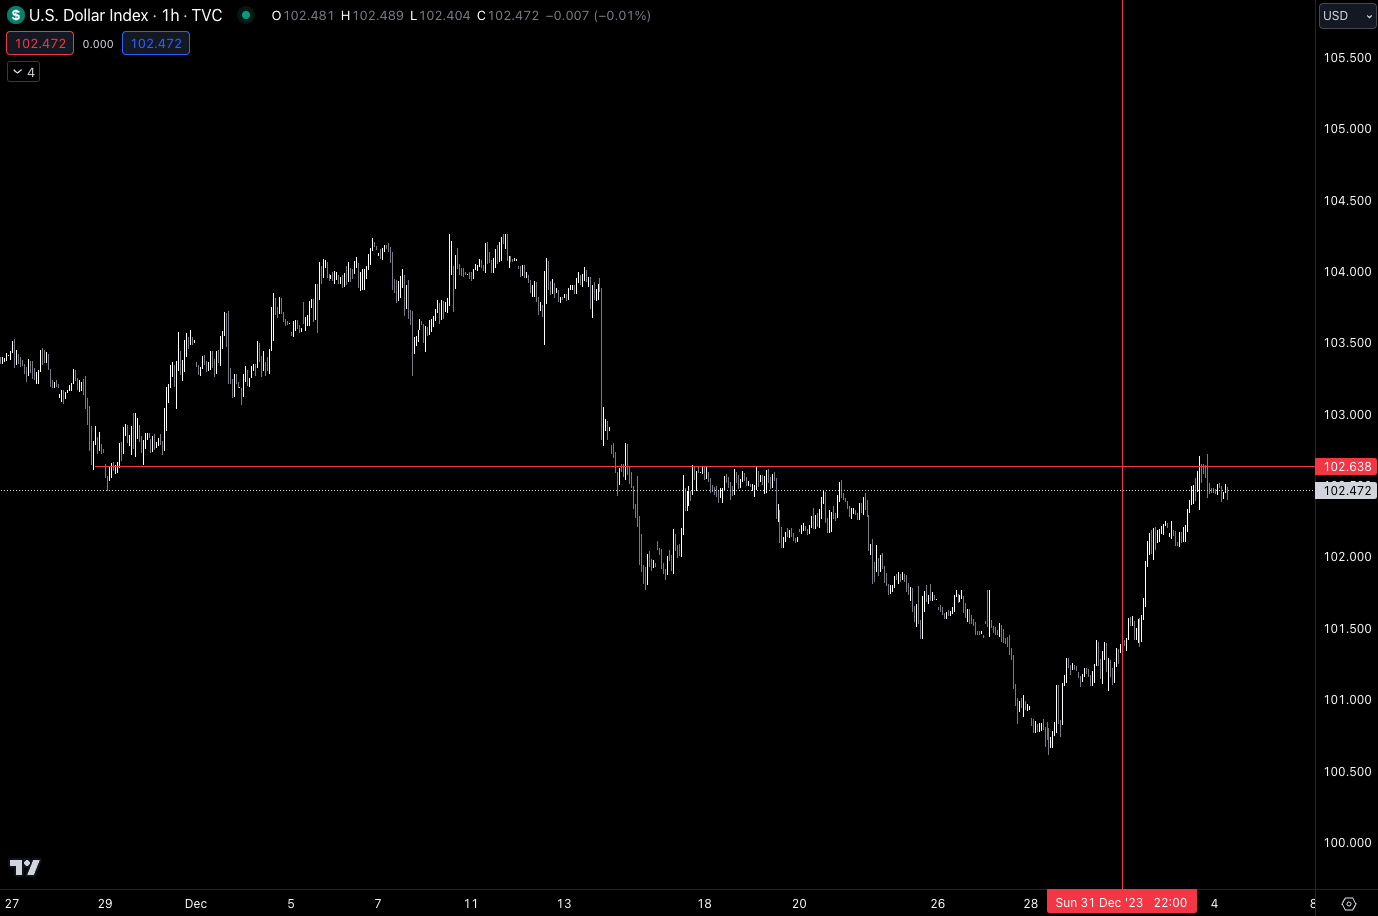
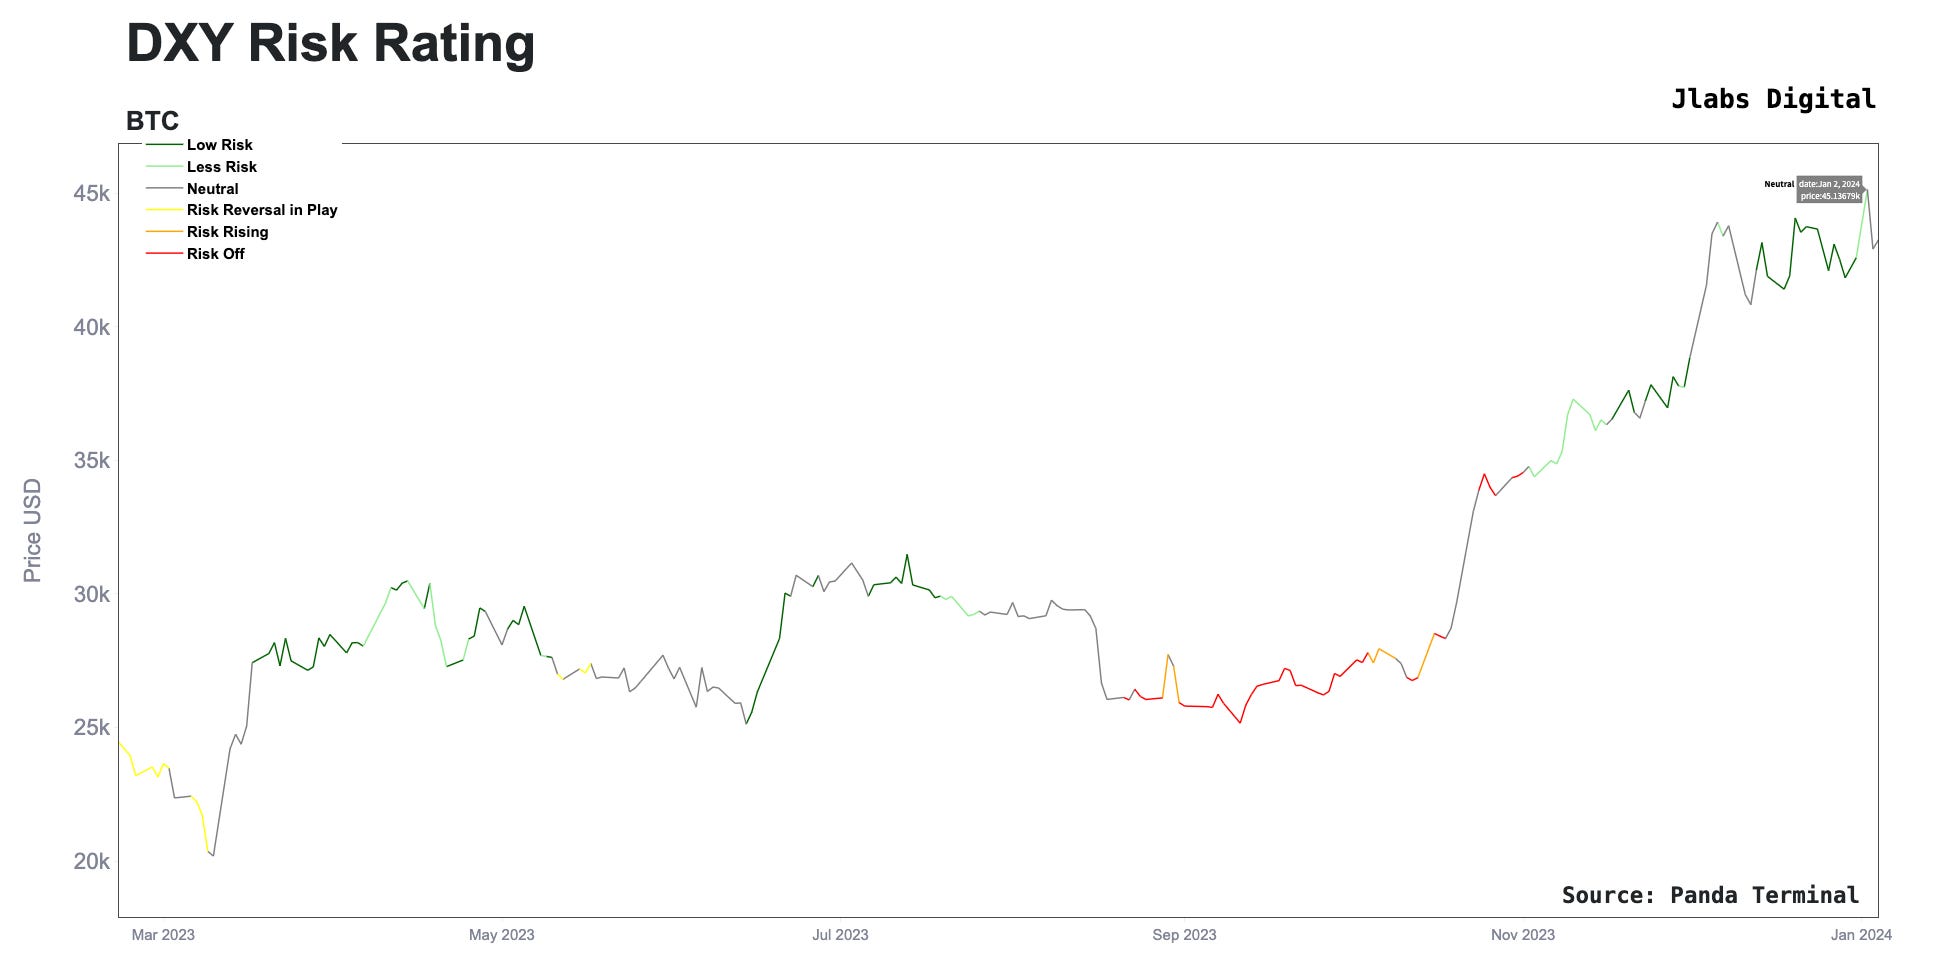
It was enough to turn our Risk Rating from Low Risk to Neutral the day prior.
The other signal was happening in the price movement and orderbook. There’s a term called slippage… It’s essentially an indicator in liquidity around the current market’s price.
When slippage rises, volatility can rise. What we saw in the day prior was slippage crept higher. You can see that in the box labeled “Unhealthy” below.
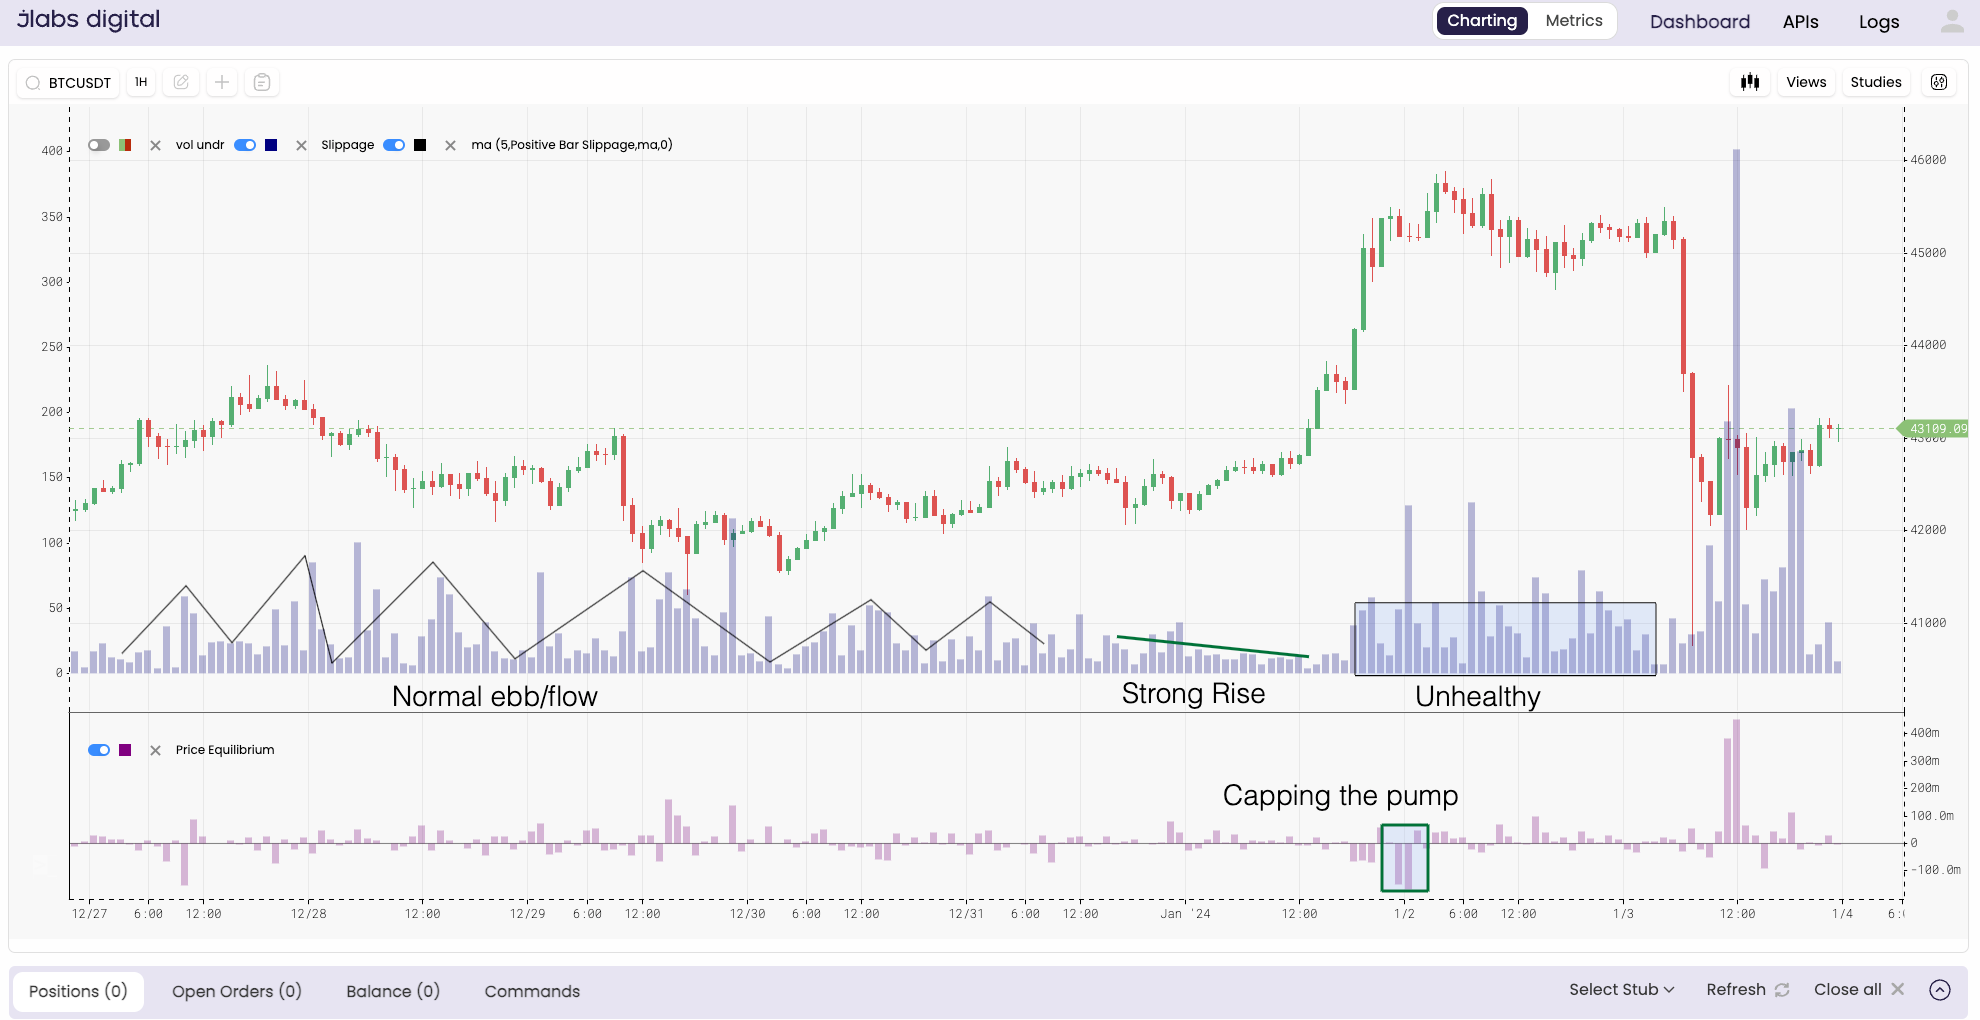
The market went from a normal state to one with slight disturbances on January 2.
I say all this to basically tell the Matrixport analyst, bravo. You took advantage of current market conditions to play your card at the perfect time.
As for what this means moving forward…
Future
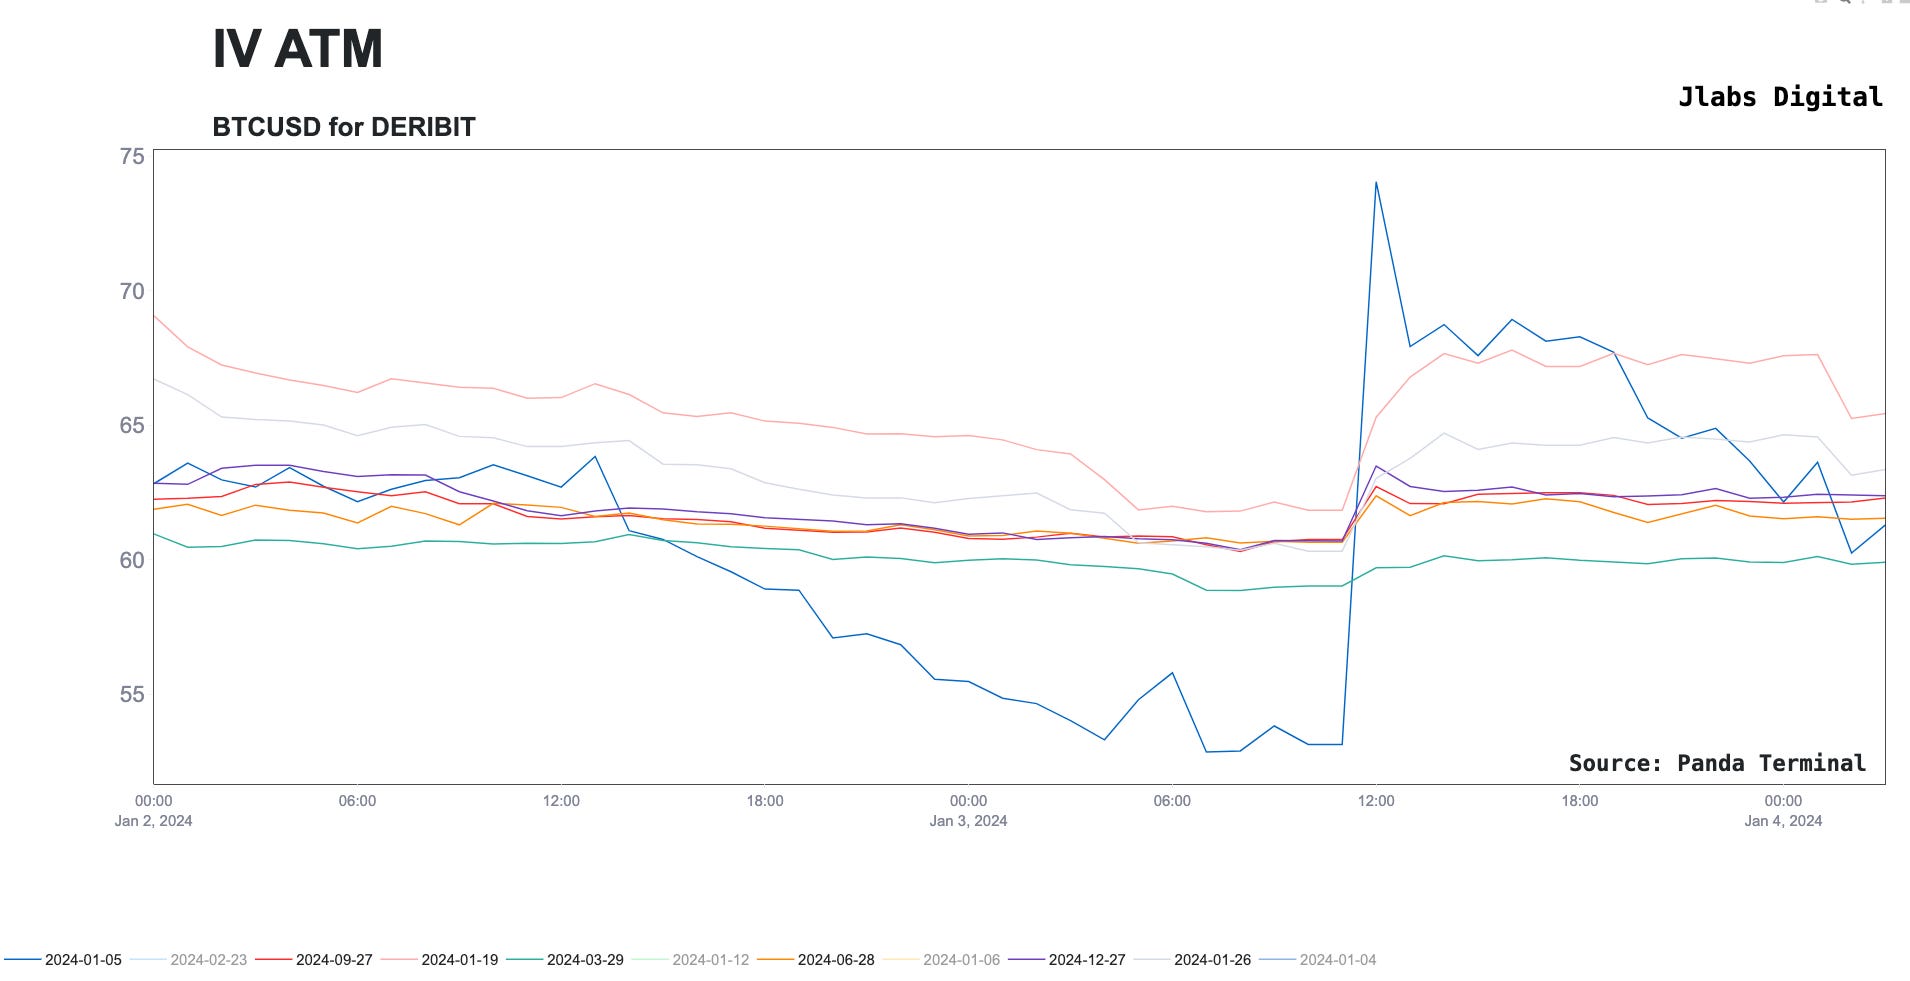
Slippage is coming down as you can see in the previous chart. The other subplot in that chart above shows a tentative market.
The market is still not making a move in the options market. In this chart below, you can see how little IV moved. By the end of the trading day, IV was back to what it was before the rogue wave. The exception being the contract expiring tomorrow.
Open interest hasn’t come back from the massive end of year expiry that just happened… I’d expect to see that post-ETF news.
Which is all to say…
The market feels like it’s waiting for the ETF news to drop. This will be very exciting to see play out in the week to come.
It doesn’t get any better than this. Until next time…
Your Pulse on Crypto,
Ben Lilly